Log Browser
Last updated: 1 minute read.
When you look through your Dashboard and your error breakdown statistics, you’ll find that you will want to drill down to the root cause of the errors. This is what the Log Browser is for.
The Log Browser will isolate individual log lines in your analytics data set and allow you to filter them by:
- API Name
- Token ID (hashed)
- Errors Only
- By Status Code
You will be presented with a list of requests, and their metadata:
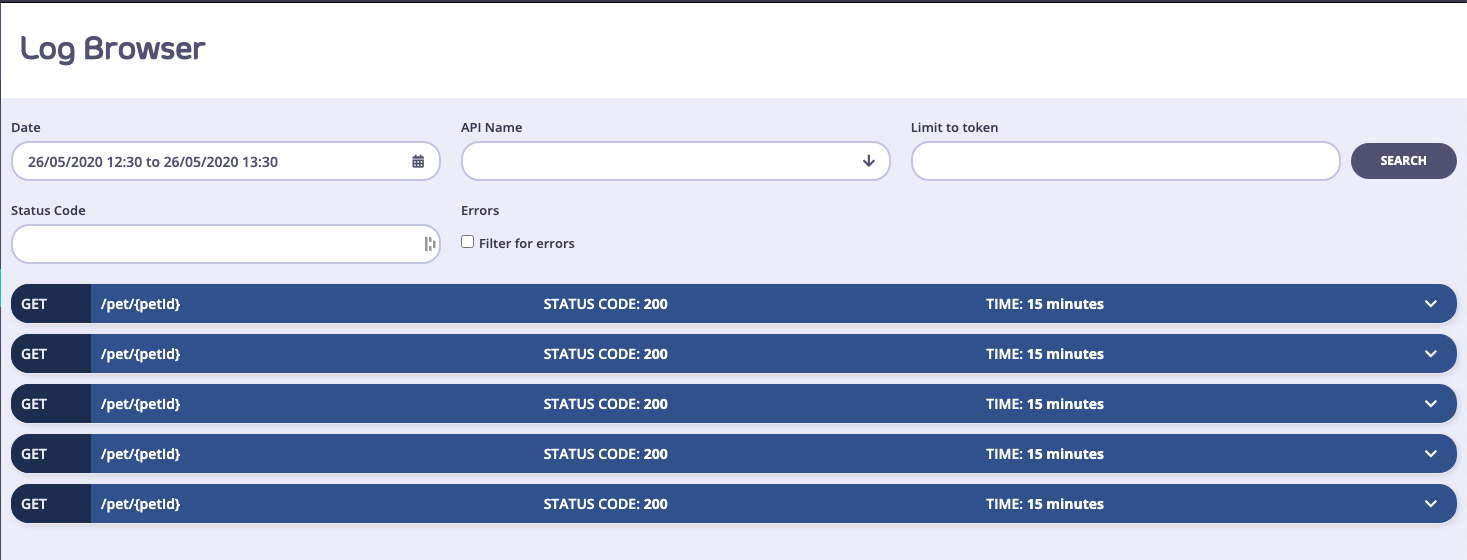
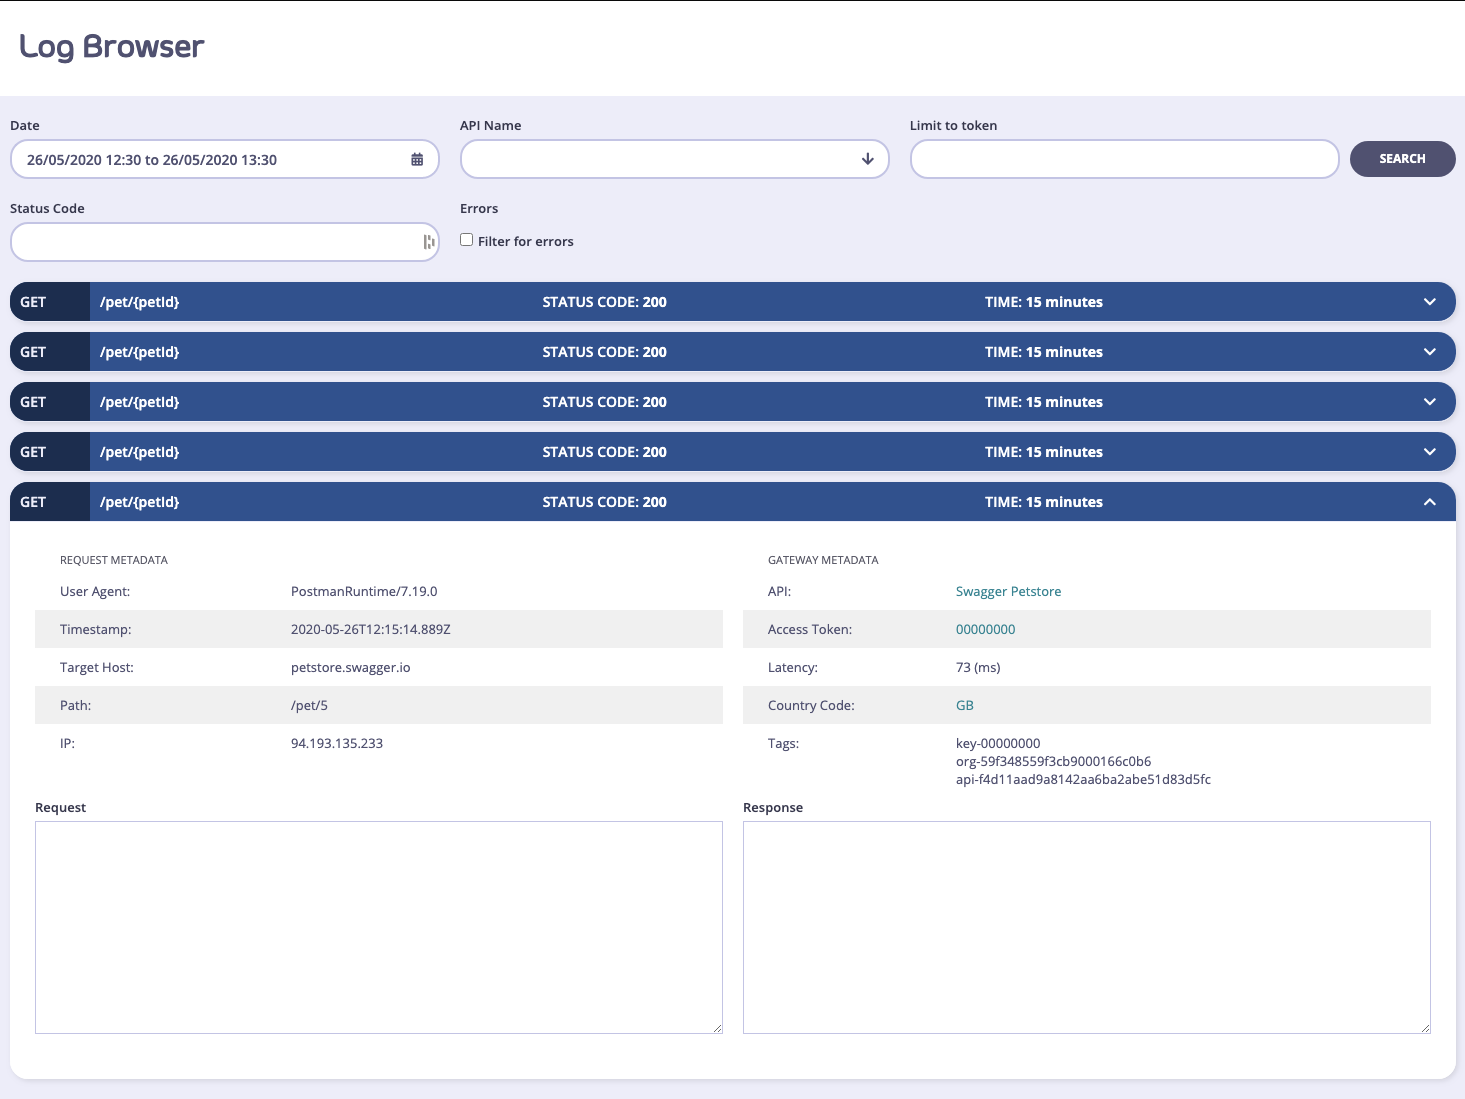
Click a request to view its details.
Self-Managed Installations Option
In an Self-Managed installation, if you have request and response logging enabled, then you can also view the request payload and the response if it is available. To enable request and response logging, please take a look at useful debug modes .
A warning on detailed logging: This mode generates a very large amount of data, and that data exponentially increases the size of your log data set, and may cause problems with delivering analytics in bulk to your MongoDB instances. This mode should only be used to debug your APIs for short periods of time.
Note
Detailed logging is not available for Tyk Cloud Classic customers.