
GraphQL has come a long way in a short time, and has enabled technology teams to add value, in ways of developer velocity, easier adoption of APIs, and more.
Apollo is to GraphQL what nginx is to reverse proxying. As a result, it became the de-facto choice when starting a new GraphQL project.
But at what cost?
Apollo is written in NodeJs, a notoriously slow, single-threaded language. [1]
Nowadays, there are many options beside Apollo. For example, Tyk Gateway as of v4.0.0 includes a fully featured GraphQL library written in GoLang, the language Docker and Kubernetes are written in.
The end result means that Tyk’s GraphQL performance is an astonishing 5-10x faster than Apollo’s.
Performance is a broad term, I define it here as “RPS” and “Latency”. Given a certain sized hardware, how many Requests Per Second (RPS) can a GraphQL server process, and how long does a single API request take to complete a round-trip.
The business use case
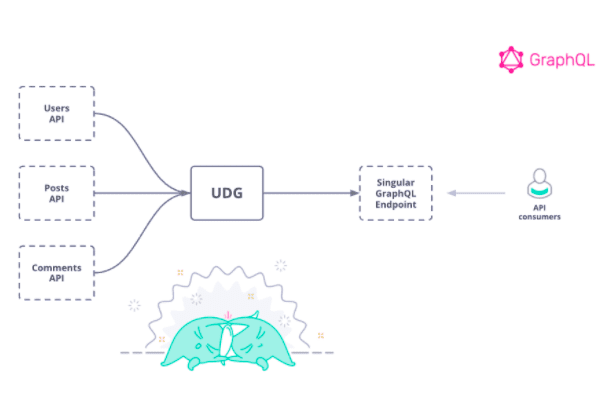
Let’s imagine we’re building Twitter, and we have 3 back-end REST services which we want to unify as a GraphQL API.
The backend APIs are implemented as REST APIs & endpoints:
- Users
This API provides data about a particular user.
- Posts
This API provides posts belonging to a user, given a user ID
- Comments
This API provides comments belonging to posts, given a post ID
The traditional approach is to build a UI that consumes these 3 APIs. Instead, we’re going to take advantage of GraphQL and combine these into a single GraphQL API for our front-end application.
Then, we can send a single GraphQL API request which retrieves ALL the information we need to populate the user’s landing page, containing the user’s information, all the posts they’ve written, and all the comments that belong to each post.
Results
Note: The below results were achieved using an open source repository here which you can and should replicate yourself.
Requests per second (rps)
| Average | Round 1 | Round 2 | Round 3 | |
| Apollo | 640 rps | 652 rps | 622 rps | 647 rps |
| Tyk | 3448 rps | 3447 rps | 3447 rps | 3452 rps |
P99 latency
| Average | Round 1 | Round 2 | Round 3 | |
| Apollo | .2248 secs | 0.2137 secs | 0.2428 secs | 0.2180 secs |
| Tyk | .0225 secs | 0.0227 secs | 0.0226 secs | 0.0223 secs |
Source, Hardware is c4.2xlarge, 8 core vCPU on AWS EC2
What are we seeing? On average, Tyk can process nearly 5.4x more requests per second (RPS) than Apollo, given the exact same hardware, GraphQL query, and back-end services.
How much money would switching to Tyk save you in hardware?
And on average, Tyk is nearly 10x faster than Apollo in terms of P99 latency. That means, for 99% of your API requests, Tyk’s end-to-end response time is only .0225 seconds, while Apollo clocks in 10x slower at .2248 seconds.
How would this latency improve your applications?
Scales with APIs
You must be wondering: “How does performance scale as we add more data sources/APIs into our Data Graph” ?
Let’s take a look:
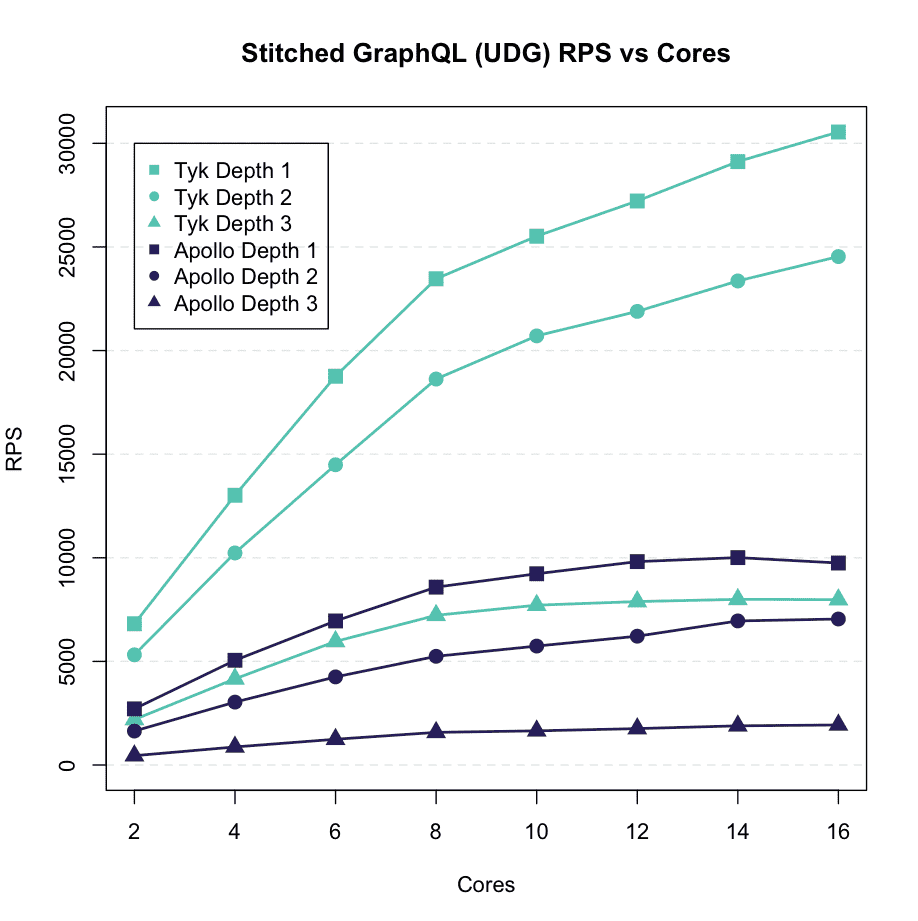
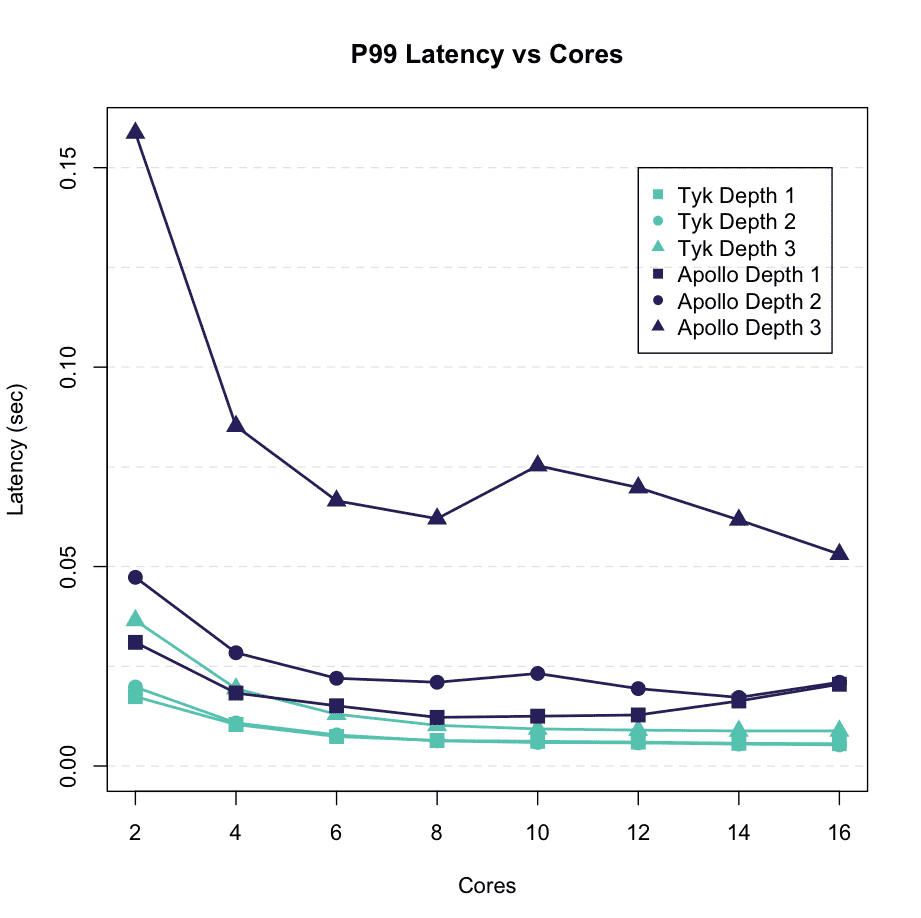
We ran more queries, using different depths. Each depth adds a new REST API to consume data from. As we can see, Tyk continues to significantly outperform Apollo as we add more data sources.
Want to recreate this for yourself? See the manual for GraphQL performance testing using open source tools.
What next?
- Book a demo with us to see how Tyk can help your organisation achieve its goals
- Read more about Tyk’s Universal Data Graph and how it can help your business
- Reach out to me personally with your questions and feedback, [email protected]
- See our performance benchmarks
References
[1] Toptal