Here is an overview of a recent exercise where we provisioned an AWS environment and did some simple performance testing with Tyk.
If you missed it, we provided a summary of some recent benchmark testing we did with Tyk on AWS. Rather than complete the performance testing in private, we wanted to document the steps we took to achieve the results we posted. We hope by doing this, you can run your own performance testing – with Tyk or other Gateways, and also flag any questions or comments you may have about our method. We’d welcome any comments, thoughts, or challenges, just let us know!
For our testing, we have outlined the following steps:
- Selection of AWS for all environment hosting
- Selection of an Upstream
- Selection of a load generator capable of high throughput
- Selection of an API Gateway (Tyk!)
- Performance & results gathering
For ease of installation and simplicity, everything will be running through Docker.
Creating a baseline for testing high RPS
Assumptions: For the purpose of this blog, we have assumed a basic understanding of AWS, Docker, and terminal commands for these platforms, though we will walk you through them anyway.
For our testing, we will be using AWS as our POC environment. We will first need to create a single AWS VPC and Subnet. We will need to create a subnet with at least 3 available IPs for each of our EC2 instances. This is all the AWS infrastructure we will need for the rest of this PoC build.
For our testing, we will be using AWS as our POC environment. We will first need to create a single AWS VPC and Subnet. We will need to create a subnet with at least 3 available IPs for each of our EC2 instances. This is all the AWS infrastructure we will need for the rest of this PoC build.
Watch the following video where I walk you through how to do this:
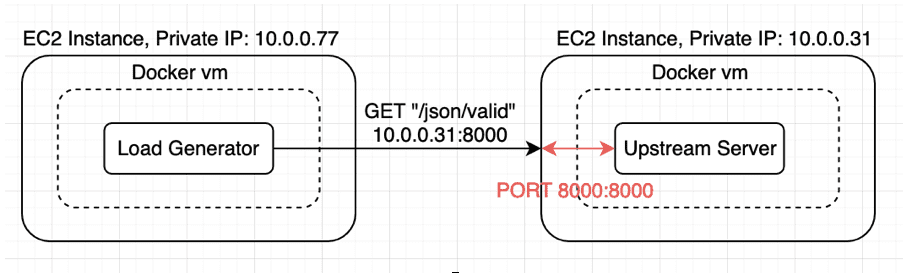
Our initial environment is set up with two EC2 instances. The load generator instance is a C5.9xLarge, and the upstream instance is a c5.2xlarge.
Here’s what it will look like once setup:
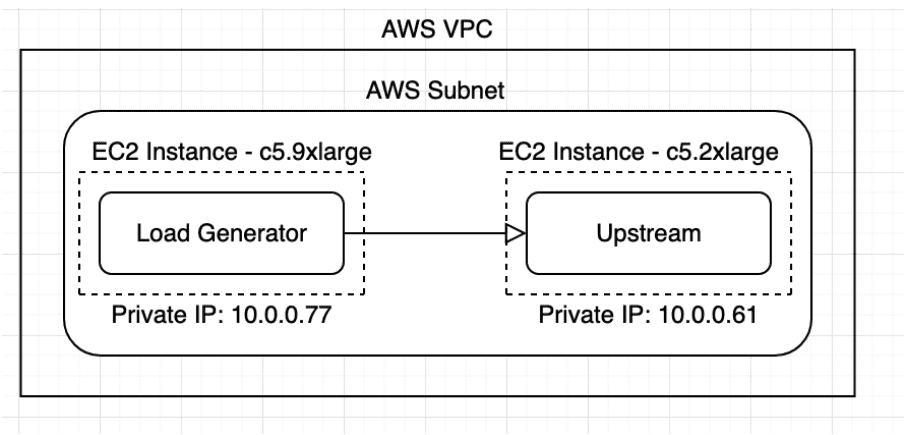
For all EC2 instances, we are using AWS Linux 2 because it is cost effective and is capable of running all of our software components needed for this POC, most of which will be running in Docker.
Upstream and Load Generator
With our preference for all things open source, we will use a GO bench suite as our upstream.
This is an upstream that one of our colleagues created for previous load testing exercises. This upstream will mimic a typical HTTP response of our APIs, which are REST based, and will return mock JSON payloads.
For our testing, we wanted a load generator capable of sending POST JSON payloads as well as authentication tokens to mimic a frontend user or web app.
Let’s install the upstream:
We are going to be installing the mock upstream through Docker.
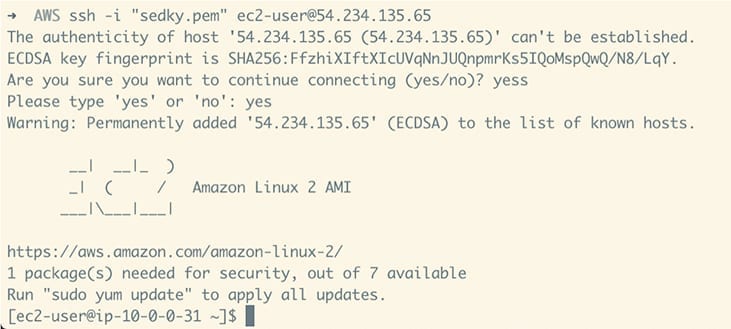
1. SSH into the upstream EC2 instance by running the following command
- We need to pass our key that we registered with this EC2 instance when setting it up. More information here:
- We will make sure the security group our EC2 instance belongs to allows SSH traffic.
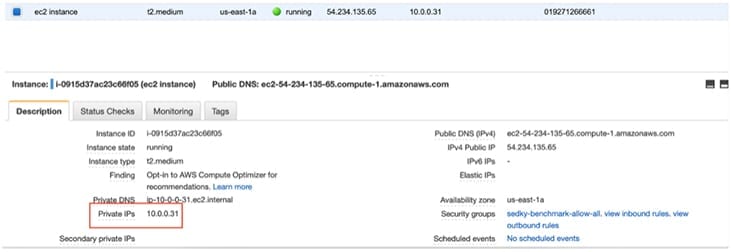
- We can get the public IP of the ec2 instance from the main dashboard.
ssh -i my_key.pem [email protected]
Once logged in we should see this message:
More info on AWS instances.
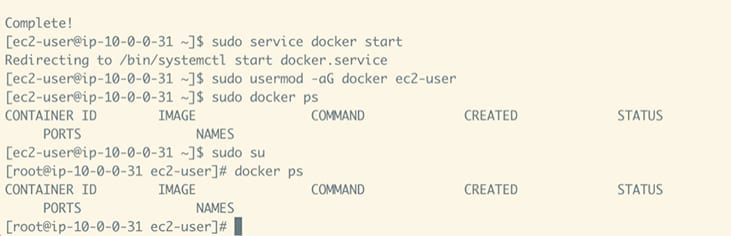
2. Install Docker on your EC2 instances
We can copy all these commands and paste them into our terminal to run all of them
sudo yum update -y
sudo yum install -y docker
sudo service docker start
sudo usermod -aG docker ec2-user
sudo docker ps
sudo su
Once all is finished, we should now be logged in as root and can perform a “docker ps”
3. And then run the upstream through Docker:
docker run
--rm
-itd
--name bench
--ulimit nofile=80000:80000
-p 8000:8000
mangomm/go-bench-suite
./go-bench-suite upstream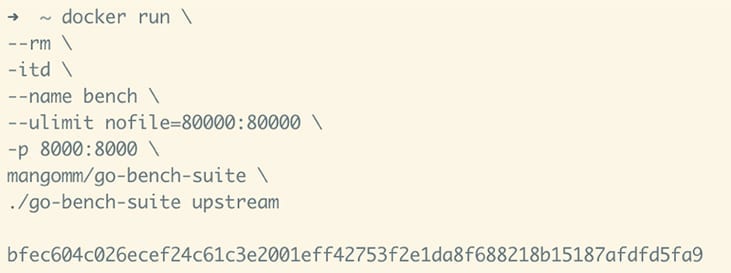
The upstream is now running in the background.
To explain the flags we ran in our docker command:
- The “ulimit” flag allows the load generator to open many more file handles, which is going to increase our maximum concurrent load
- The “p” flag tells Docker to map port 8000 on the host to port 8000 on the container, where our upstream is running.
We can test it by cURLing one of our endpoints:
curl localhost:8000/json/valid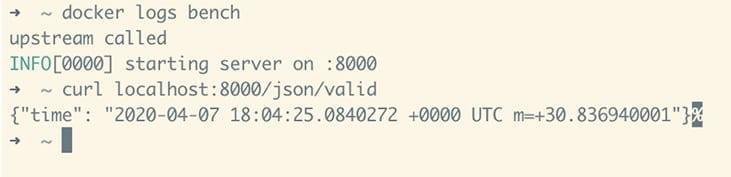
This will hit port 8000 on our EC2 host, which Docker has mapped to port 8000 on the container. The request will be routed to the server listening on port 8000 on the “/json/valid” endpoint. This API returns a valid JSON response payload. It will be essentially the same behaviour when another web server makes an API call to our Upstream running in the docker container:
4. Now we run the load generator
Repeat steps 1 & 2 on our load generator EC2 instance:
SSH into it
ssh -i key.pem ec2-user@public-ip-load-gen-instance
Install Docker
sudo yum update -y
sudo yum install -y docker
sudo service docker start
sudo usermod -aG docker ec2-user
sudo docker ps
sudo su
5. set the “UPSTREAM” variable to the API server running on our upstream instance.
Be sure to use the private IP of the EC2 instance. We can get our private IP from the EC2 dashboard.
export UPSTREAM=https://10.0.0.31:8000/json/valid
6. And we can now test it:
curl $UPSTREAM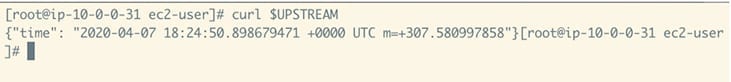
Our load generator instance can successfully make an API request to our Upstream server running on another EC2 instance and receive a JSON response payload indicating the current time.
We’re now ready to run our load generator against our mock upstream server
Load testing – Running hey against our upstream API.
Now that our AWS environment is set up, we need to run a mock upstream API. Here is what we did:
The “-z” flag tells Hey to run for 10 seconds
The “q” flag tells Hey to run 1500 requests per second per connection/worker. The default number of connections is 50.
1500 rps x 50 connections = 75,000 rps
Run Hey through Docker:
$ docker run --rm -it rcmorano/docker-hey -z 10s -q 1500 $UPSTREAM
Summary:
  Total:    10.0008 secs
  Slowest:    0.0051 secs
  Fastest:    0.0001 secs
  Average:    0.0003 secs
  Requests/sec:    74801.6146

  Total data:    52281507 bytes
  Size/request:    69 bytes

Response time histogram:
  0.000 [1]    |
  0.001 [741970]    |■■■■■■■■■■■■■■■■■■■■■■■■■■■■■■■■■■■■■■■■
  0.001 [2612]    |
  0.002 [3012]    |
  0.002 [434]    |
  0.003 [23]    |
  0.003 [11]    |
  0.004 [8]    |
  0.004 [2]    |
  0.005 [3]    |
  0.005 [2]    |


Latency distribution:
  10% in 0.0002 secs
  25% in 0.0002 secs
  50% in 0.0002 secs
  75% in 0.0003 secs
  90% in 0.0003 secs
  95% in 0.0003 secs
  99% in 0.0005 secs

Details (average, fastest, slowest):
  DNS+dialup:    0.0000 secs, 0.0001 secs, 0.0051 secs
  DNS-lookup:    0.0000 secs, 0.0000 secs, 0.0000 secs
  req write:    0.0000 secs, 0.0000 secs, 0.0028 secs
  resp wait:    0.0002 secs, 0.0001 secs, 0.0031 secs
  resp read:    0.0000 secs, 0.0000 secs, 0.0020 secs

Status code distribution:
  [200]    748078 responses
Quick sanity check #1: Interpreting the report
It’s important to understand how we are interpreting this report. Here are the stats we care about and why:
“Status code distribution”: This section will report on the responses aggregated by response codes. We are hoping to only ever see [200] responses here, indicating a successful API response. Otherwise, we have errors somewhere. Note that this number stops counting at 1 million responses due to a limitation in “Hey”, though the program will continue to generate load forever.
“Latency Distribution”: This number indicates how long an API request takes to go from being sent until a response is returned. Latency Distribution is important because it will allow us to see how much delay is introduced by adding our API gateway. We want to keep this number as low as possible. In general, a response of less than 30-50ms will make our app feel like a real-time, instantaneous application. More helpful reading around “real time perception”.
Out of all the numbers in latency distribution, the P99 latency metric holds the most importance the most to us. Generally speaking, P99 latency means that 99% of all results fall under the given value. In the context of our load testing, this means that for our P99 latency value of 0.5 ms, all but 1% of API requests experience a faster (lower) latency than 0.5 ms, or 0.0005 seconds
Testing for the P99 latency is important because it is a metric that will illustrate what the majority of users will experience while using our API’s. We don’t care as much for our best or slowest response, rather we want to focus on the responses that will be most indicative of the overall user experience we are trying to build.
“Requests/sec”: This is how much throughput we are receiving. It is indicative of how much load our server and our API gateway can handle. Think of a request as a single user making one request, or a single user making many simultaneous requests. We want this number to be as high as possible because the more requests we are capable of handling, the more users we can support! Think of our goal as something similar to that of a company like Netflix, where any one API can be used by hundreds of thousands or millions of users at the same time.
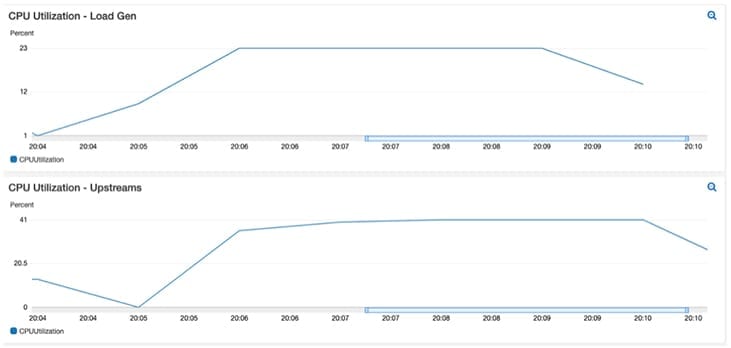
Now that our test has run its course, we can show that our “ecommerce front-end” app “Hey” successfully ran 74,801 requests per second while keeping P99 latency at 0.5 ms.
(One other important observation to note is that the CPU utilisation was stable during testing, indicating that we have chosen a good instance sizing for our requirements.)
For consistency, I ran the test a few more times to get an average 99% percentile value.
Benchmark summary before gateway
75,000 Requests per second for 5 minutes.
| RUN # | 99% Latency | Throughput |
| 1 | 0.4 ms | 74,961 req / sec |
| 2 | 0.4 ms | 74,904 req / sec |
| 3 | 0.4 ms | 74,900 req / sec |
| Average of 3 runs | 0.4 ms | 74,921 req / sec |
At this point, our baseline for comparing our future Gateway performance is complete.
Introduction of the Tyk gateway into the test:
Now that our mock APIs and mock front-end application is in place, we can add the Tyk Gateway into the mix. We have also decided to introduce Tyk Gateway features that will enable us to monitor, manage, and analyse all API traffic.
Authentication
Our platform does not work unless we can protect our APIs from unauthenticated use. A common solution is to implement OAuth 2.0 for our front-end web applications. However, for the purposes of keeping things quick and easy, for now we will use simple auth tokens in our PoC.
An auth token will allow our API request to be validated by Tyk once authentication is activated on the API.
Rate limiting
There are a few reasons to enable rate limiting. In the future, we could monetise our APIs, and therefore would need to introduce tiered policies which include higher rate limit access for which we could structure a tiered cost system to monetise. Another reason would be to prevent our API from blowing up by accepting too many connections & requests than it is capable of handling.
We can activate rate limiting through Tyk, and give our authentication tokens each a unique rate limit that will be enforced by Tyk.
Analytics
Fun with numbers! We want Tyk to gather analytics for us, so that we can monitor our infrastructure, as well as provide the information to our business analytics teams.
Now that we have decided what gateway features are important to us, we need to go ahead and install Tyk into our POC environment. Here is our new architecture for our PoC:
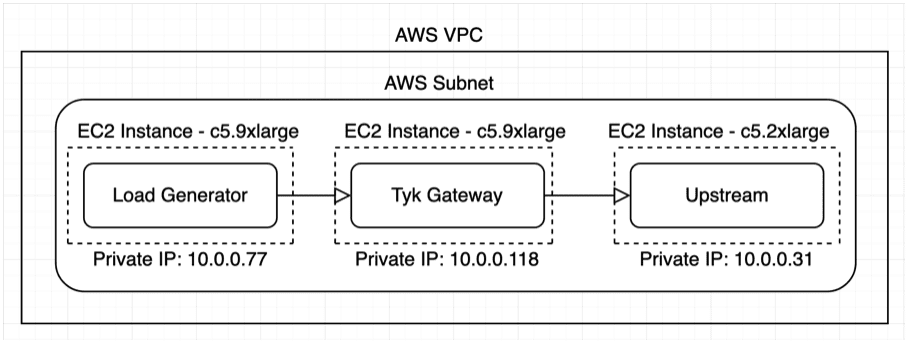
First, let’s spin up a third EC2 instance on a c5.9xlarge, for the gateway.
The instructions to run Tyk are simple and although we will recap them, here is the link to find the official Tyk documentation.
1. Install Docker on the vm
sudo yum update -y
sudo yum install -y docker
sudo service docker start
sudo usermod -aG docker ec2-user
sudo docker ps
sudo su
2. Create the Tyk gateway configuration file
Create a file called “tyk.standalone.conf” in “/home/ec2-user”, and paste the contents of “step1 tyk.standalone.conf”
You can copy the file in many ways. Here is one:
curl --silent https://gist.githubusercontent.com/sedkis/8ec32c111dcc407119a6c88fc868458b/raw/df97f6267dcb62f638a9a8b0c5515910e29df2f3/step1%2520tyk.standalone.conf | cat > tyk.standalone.conf
3. Create directory called “apps”
mkdir apps
4. Create a file called “api_test.json” and paste the contents of “step1 api_test.json”
Use these instructions or create the file another way:
curl --silent https://gist.githubusercontent.com/sedkis/8ec32c111dcc407119a6c88fc868458b/raw/df97f6267dcb62f638a9a8b0c5515910e29df2f3/step1%2520api_test.json | cat > apps/api_test.json5. Bootstrap Tyk in Docke
First we run Redis, which Tyk Gateway requires as an in-memory store.
docker network create tyk
docker pull redis:4.0-alpine
docker run -itd --name redis --network tyk -p 127.0.0.1:6379:6379 redis:4.0-alpine
6. Create env variable mapping to the private IP of our upstream EC2 instance
export UPSTREAM_HOST=10.0.0.31
7. Run Tyk
docker pull tykio/tyk-gateway:latest
docker run -d
--name tyk_gateway
--network tyk
--ulimit nofile=80000:80000
--add-host=UPSTREAM_HOST:$UPSTREAM_HOST
 --log-opt max-size=10m --log-opt max-file=5
-e GOGC=1600
-p 8080:8080
-v $(pwd)/tyk.standalone.conf:/opt/tyk-gateway/tyk.conf
-v $(pwd)/apps:/opt/tyk-gateway/apps
tykio/tyk-gateway:latest
Let’s explain the flags we passed while running the container:
“ulimit” – Make more file handles available. More ulimit reading here
“–add-host” – We’re adding a hostname entry to the docker container so it knows where the upstream server lives. This is evident in the api definition under “/apps/api_test.json” under “target”
“GOGC” – Change the default behaviour of the GO garbage collector in order to get more performance. Here is an article where Tyk’s very own Ahmet Soormally covers this in more detail.
“Log-opt max-size” – Setting a max size of the log file. The Gateway can print a lot of error messages depending on our testing.
“-v” – We mount the “tyk.standalone.conf” file and the “apps” directory from our host into the container. All API definitions created in “apps” will be picked up by our container. The tyk conf file will explain to Tyk how it should run.
8. Finally, check that the Tyk Gateway is running by hitting the health check endpoint:
$ curl localhost:8080/hello
Hello Tiki
9. Double check that our reverse proxy definition is working by querying the listen path on the Tyk Gateway, and receiving a response from our upstream endpoint
curl localhost:8080/apitest/json/validResponse
{"time": "2020-04-06 20:00:38.661919975 +0000 UTC m=+20526.911315903"}This will reverse proxy traffic through the “/apitest” listen path to the “/json/valid” endpoint on our upstream.
Quick sanity check #2: Status check
What we’ve done is setup Tyk to run in headless mode, and to pull API proxy configurations from file. The single API proxy definition we have defined is running unauthenticated without rate limiting. At this stage, Tyk is a simple reverse proxy for this upstream, listening on the endpoint “/apitest”.
Now the fun starts: Let’s run our load generator against Tyk
Now, we can go back to our load gen vm to kickoff our testing with all components set up and running.
1. Create an env variable that maps to the private IP of the EC2 instance where Tyk is running. This is found in EC2
export TYKGW=https://10.0.0.249:8080/apitest/json/valid
2. Run the load generator against Tyk using this command:
(After 5 minutes, Hey will spit out a report of our load test to the terminal.)
$ docker run --rm -it rcmorano/docker-hey -z 5m -q 1500 $TYKGW
Results
Summary:
  Total:    300.0006 secs
  Slowest:    0.0357 secs
  Fastest:    0.0003 secs
  Average:    0.0125 secs
  Requests/sec:    71556.7835

  Total data:    1500311252 bytes
  Size/request:    1500 bytes

Response time histogram:
  0.000 [1]    |
  0.004 [998919]    |■■■■■■■■■■■■■■■■■■■■■■■■■■■■■■■■■■■■■■■■
  0.007 [116]    |
  0.011 [57]    |
  0.014 [53]    |
  0.018 [21]    |
  0.022 [12]    |
  0.025 [68]    |
  0.029 [51]    |
  0.032 [33]    |
  0.036 [669]    |


Latency distribution:
  10% in 0.0004 secs
  25% in 0.0005 secs
  50% in 0.0005 secs
  75% in 0.0006 secs
  90% in 0.0007 secs
  95% in 0.0007 secs
  99% in 0.0010 secs

Details (average, fastest, slowest):
  DNS+dialup:    0.0000 secs, 0.0003 secs, 0.0357 secs
  DNS-lookup:    0.0000 secs, 0.0000 secs, 0.0000 secs
  req write:    0.0002 secs, 0.0000 secs, 0.0254 secs
  resp wait:    0.0109 secs, 0.0003 secs, 0.0357 secs
  resp read:    0.0005 secs, 0.0000 secs, 0.0253 secs

Status code distribution:
  [200]    1000000 responses
Quick sanity check #3: What numbers do we care about?
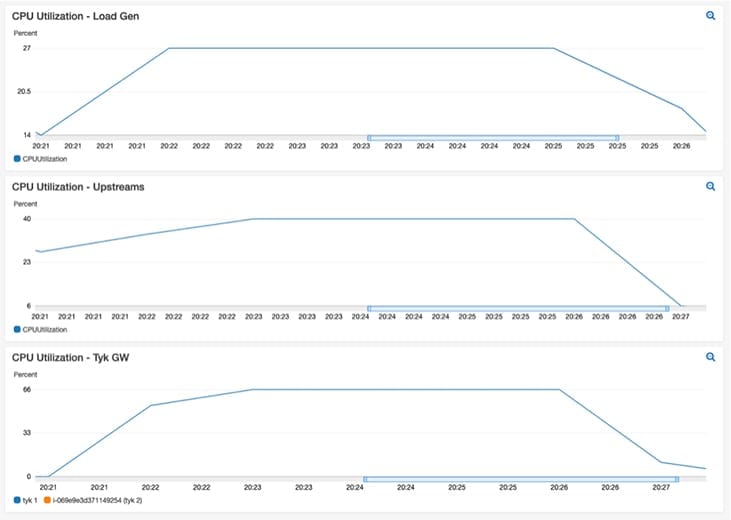
The two main numbers we were interested in were Requests Per Second (RPS) and Latency distribution of 99%. As we can see from the RPS results, Tyk was able to reverse proxy over 70K RPS while adding only sub-millisecond latency. To be clear, Tyk added only 0.6 ms to the 99th percentile latency, for a total of 1ms, while reverse proxying a whopping 71,556 requests per second.
We achieved this RPS while only using 65% CPU with steady utilisation:
Benchmark summary results – Transparent proxy
75,000 Requests per second for 5 minutes
| RUN # | 99% Latency | Throughput |
| 1 | 1.0 ms | 71,556 req / sec |
| 2 | 1.0 ms | 71,535 req / sec |
| 3 | 1.0 ms | 71,547 req / sec |
| Average of 3 runs | 1.0 ms | 71,546 req / sec |
| Delta of first test | 0.6 ms | 4.5% loss in throughput |
Our first test showed Tyk as a simple reverse proxy, which produced some fantastic numbers, however, as we stated before, we want more features out of our gateway. Here is the testing with the features turned on:
This time with all features turned on
1. SSH into the Tyk Gateway instance
2. Create a new file under “apps/auth_api.json” and copy the contents from “step2 auth_api.json”
Use these instructions or create the file another way:
curl --silent https://gist.githubusercontent.com/sedkis/8ec32c111dcc407119a6c88fc868458b/raw/df97f62Notice that compared to the last API definition, we’ve removed the “keyless” flag and added an authentication bit. And finally, we set “disable_rate_limit” to false. The endpoint on the Tyk Gateway for this new api reverse proxy definition is “/auth_api_test”.
3. Modify our “tyk.standalone.conf” and set “enable_analytics” to true.
This enables the gathering of analytics by Tyk. Tyk will store the analytics temporarily in Redis. If we want to move them into a persistent data store, such as DataDog, Logz.io, ElasticSearch, Grafana, Prometheus, or the like, we would use Tyk Pump.
You can use “nano” or “vi” to modify the file, or simply delete it and copy this one in if it is easier.
4. Restart the Gateway container to apply our changes
docker restart tyk_gatewayCan now check that the gateway is running successfully via “docker logs tyk_gateway”
Should get an “API Reload complete!” log.
5. Create auth token through Gateway REST API
Our upstream API is now protected by the Tyk Gateway and requires an authentication token to be accessed, so let’s create one through the Tyk Gateway’s REST API:
curl localhost:8080/tyk/keys/create
 --header "x-tyk-authorization:352d20ee67be67f6340b4c0605b044b7"
--data '{
    "access_rights": {
        "2": {
            "allowed_urls": [],
            "api_id": "2",
            "api_name": "Tyk Auth API",
            "limit": null,
            "versions": [
                "Default"
            ]
        }
    },
    "allowance": 100000,
    "expires": 0,
    "org_id": "default",
    "per": 1,
    "quota_max": -1,
    "quota_remaining": -1,
    "quota_renewal_rate": -1,
    "quota_renews": 1568655187,
    "rate": 100000,
    "throttle_interval": -1,
    "throttle_retry_limit": -1
}'
Response:
{"key":"default1f753e0e69154aae827b1afd6c80a8e6","status":"ok","action":"added","key_hash":"49cb96ec"}We successfully created an authentication token using the Gateway REST API, as evident in the “key” field in the response payload above.
6. Go back to the Hey load gen instance and create an environment variable mapping the auth token “key” from step #5 to a header
export HEADER="Authorization:default1f753e0e69154aae827b1afd6c80a8e6"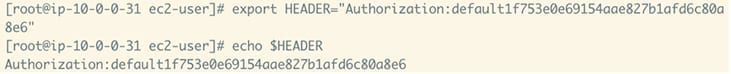
7. Do the same for our new API reverse proxy endpoint
export TYKGWAUTH=https://10.0.0.249:8080/auth_api_test/json/valid
8. Run Hey against our protected endpoint
And now, we can see the finish line in sight.
The “header” flag below will add our auth token as a header to every API request in a way that the Tyk Gateway will expect it.
docker run --rm -it rcmorano/docker-hey -z 5m -H $HEADER $TYKGWAUTHResponse
Summary:
...
Requests/sec:    69133.2131
...
Latency distribution:
99% in 0.0011 secs
...
Benchmark summary – Full load (rate limit, authentication, analytics)
75,000 Requests per second for 5 minutes
| RUN # | 99% Latency | Throughput |
| 1 | 1.1 ms | 69,133 req / sec |
| 2 | 1.2 ms | 69,083 req / sec |
| 3 | 1.2 ms | 69,278 req / sec |
| Average of 3 runs | 1.17 ms | 69,165 req / sec |
Final sanity check!
To summarise, we have set up a test environment in AWS, added an Upstream and Load Generator, created a baseline for results comparisons, run Tyk as a simple reverse proxy, and run Tyk with all features enabled.
We have proven our ability to sustain a very high level of RPS and have laid the foundation to achieving hundreds of thousands of requests per second via multiple deployment methods, on multiple infrastructures, with best practices for redundancy and global scalability.
Thank you for reading. Please subscribe to our mailing list to get an update when part three of this blog series gets released where we will be performance tuning Tyk on Kubernetes. Also, head on over to our community or get in touch with us for any questions, or share your own benchmarks with us.
Thanks,
Sedky