Planning for Production
Last updated:
So you want to deploy Tyk to production?
There’s a few things worth noting that can ensure high performance of your Tyk Gateway nodes. Here are some of the basic things we do for load testing to make sure machines don’t run out of resources.
Performance Expectations
Our performance testing plan focused on replicating the setup of our customers, and tried not to optimize for “benchmarks”: so no supercomputers and no sub-millisecond inner DC latency. Instead, we tested on a super-low performance 2 CPU Linode machine, with 50ms latency between Tyk and upstream. For testing, we used Tyk Gateway in Multi-Cloud mode, with default config. Test runner was using [Locust][2] framework and [Boomer][3] for load generation.
With the optimizations outlined below, and using our distributed rate limiter, Tyk can easily handle ~3,000 requests per second with analytics, key authentication, and quota checks enabled.
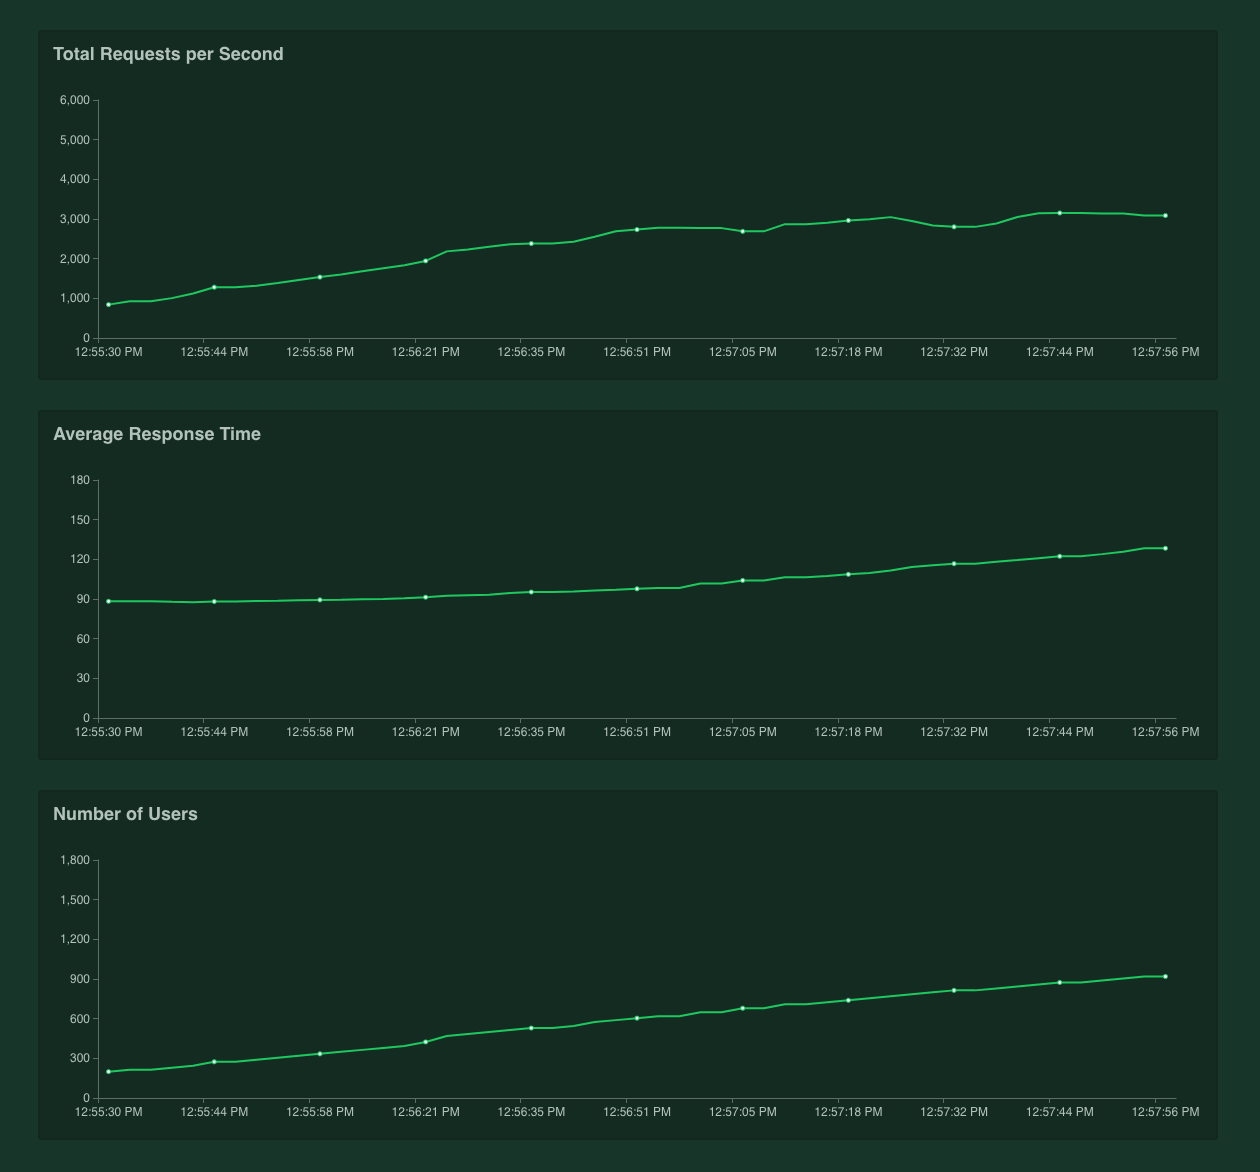
In the test below, Tyk v2.7 evaluates each request through its access control list, rate limiter, quota evaluator, and analytics recorder across a single test token and still retains a latency firmly under 70 milliseconds:

Performance changes based on use case
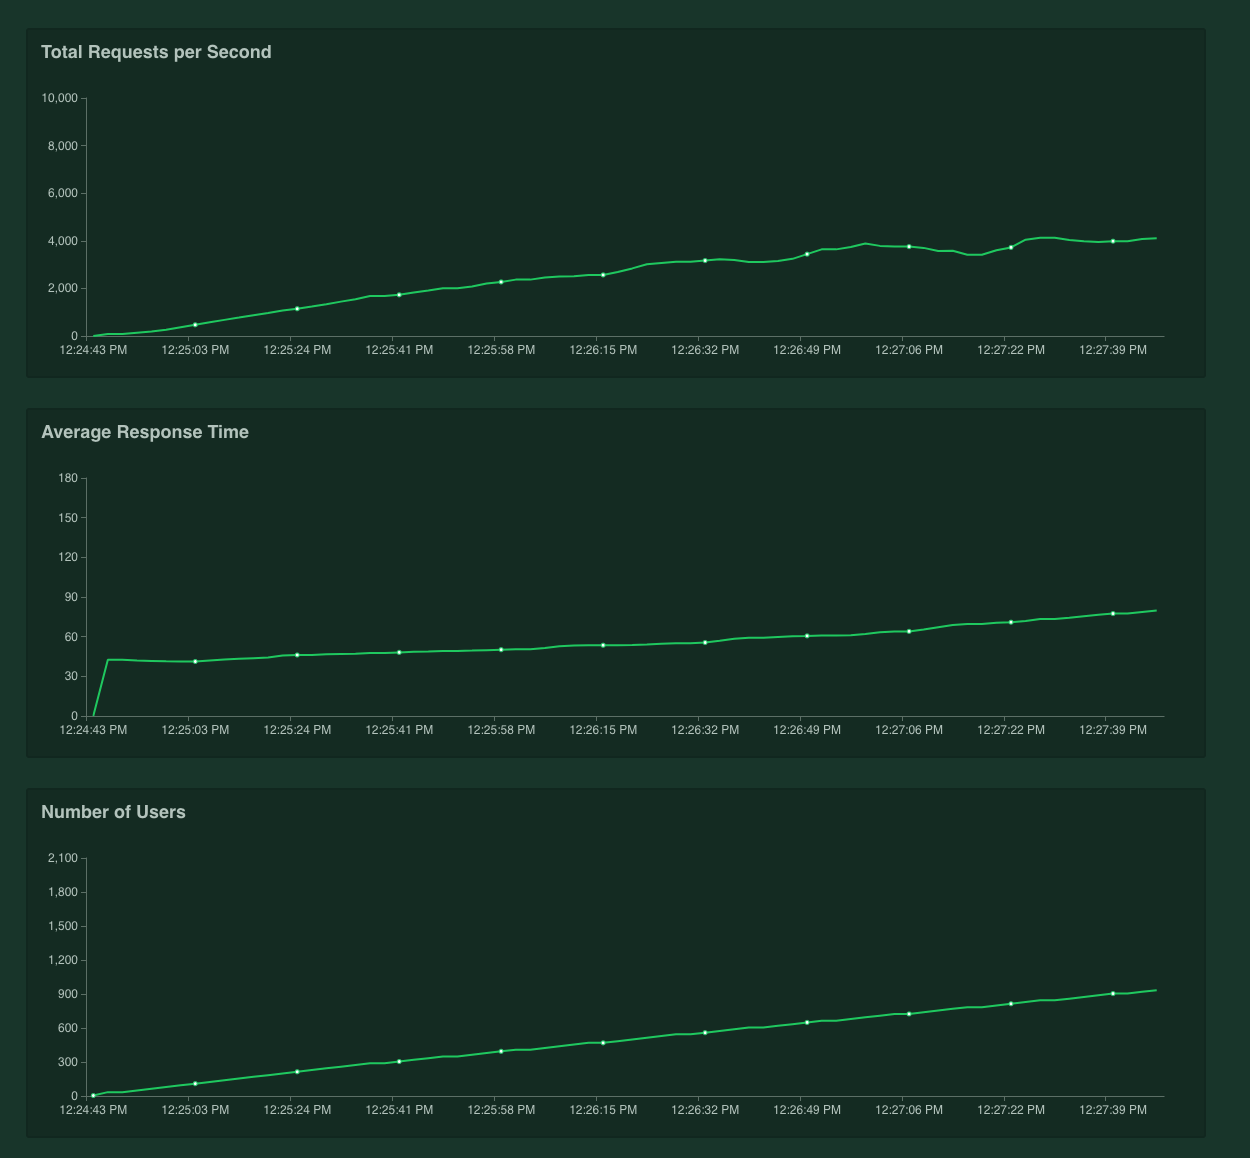
A popular use case for Tyk that we’ve seen crop up is as an interstitial API Gateway for microservices that are making service-to-service calls. Now, with these APIs, rate limiting and quotas are not usually needed: only authentication and analytics. If we run the same tests again with rate limits disabled, and quotas disabled, then we see a different performance graph:

Here we have pushed the test to 3,000 requests per second, and we can see that Tyk copes just fine. With only a few spikes past the 100ms line, we can clearly see solid performance right up to 3,000 requests per second with acceptable latency.
Vanilla Tyk
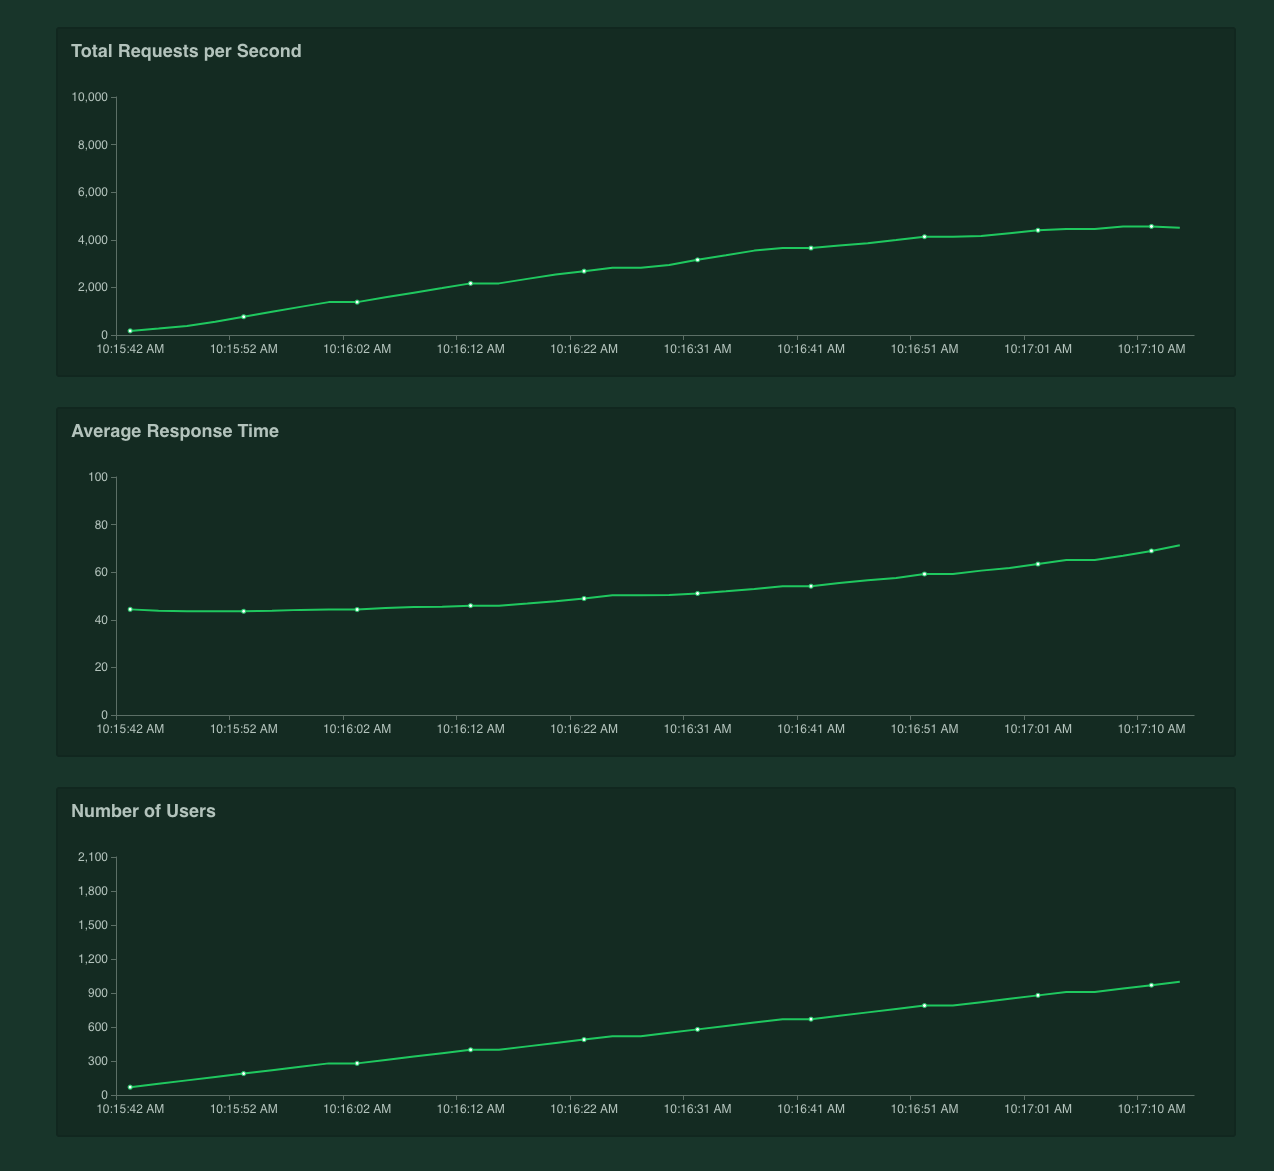
If you were to just test Tyk as a pass-through auth proxy, we can see that 4k RPS (requests per second) is easily handled:

This configuration has analytics recording disabled, but we are still authenticating the inbound request. As you can see, we easily handle the 4k RPS mark and we can go further with more optimization.
Change all the shared secrets
Ensure that these are changed before deploying to production. The main secrets to consider are:
tyk.conf:
secretnode_secret
tyk_analytics.conf:
admin_secretshared_node_secrettyp_api_config.secret
GW secret and DB tyk_api_config.secret must match
GW node_secret and DB shared_node_secret must match
Use the public/private key message security!
Tyk makes use of public-key message verification for messages that are sent from the Dashboard to the Gateways, these messages can include:
- Zeroconfig Dashboard auto-discovery details
- Cluster reload messages
- Cluster configuration getters/setters for individual Gateways in a cluster
These keys are also used for plugin security, so it is important to use them if you are deploying code to your Gateway. The public key that ships with your Gateways is used to verify the manifest and files that come with any plugin bundle that gets downloaded by the bundle downloader.
Change your Control Port
To secure your Tyk installation, you can configure the following settings in your tyk.conf:
control_api_hostname - Set the hostname to which you want to bind the REST API.
control_api_port - This allows you to run the Gateway Control API on a separate port, and protect it behind a firewall if needed.
If you change these values, you need to update the equivalent fields in the dashboard conf file tyk_analytics.conf: tyk_api_config.Host and tyk_api_config.Port
Connecting multiple gateways to a single dashboard
Please note that, for a Self-Managed installation, the number of gateway nodes you may register with your dashboard concurrently will be subject to the terms of your license.
Each gateway node must be configured in the same way, with the exception being if you want to shard your gateways. Each gateway node in the cluster will need connectivity to the same Redis server & persistent database.
Other Dashboard Security Considerations
In addition to changing the default secrets (see Change all the shared secrets) if you change the Control API port (see Change your Control Port), you also need to change the connection string settings in your tyk_analytics.conf file.
Ensure you are matching only the URL paths that you want to match
We recommend that you configure Tyk Gateway to use exact URL path matching and to enforce strict route matching to avoid accidentally invoking your unsecured /health endpoint when a request is made to /customer/{customer_id}/account/health…
Unless you want to make use of Tyk’s flexible listen path and endpoint path matching modes and understand the need to configure patterns carefully, you should enable TYK_GW_HTTPSERVEROPTIONS_ENABLESTRICTROUTES, TYK_GW_HTTPSERVEROPTIONS_ENABLEPATHPREFIXMATCHING and TYK_GW_HTTPSERVEROPTIONS_ENABLEPATHSUFFIXMATCHING.
Health checks are expensive
To keep real-time health-check data and make it available to the Health-check API, Tyk needs to record information for every request, in a rolling window - this is an expensive operation and can limit throughput - you have two options: switch it off, or get a box with more cores.
Selecting the appropriate log level
Tyk provides multiple log levels: error, warn, info, debug. Setting higher log levels consumes more computing resources and would have an impact on the Tyk component. Tyk installations default to log level info unless modified by config files or environment variables.
It is recommended to set to debug only for the duration of troubleshooting as it adds heavier resource overheads. In high performance use cases for Tyk Gateway, consider setting a log level lower than info to improve overall throughput.
Use the optimization settings
The below settings will ensure connections are effectively re-used, removes a transaction from the middleware run that enforces org-level rules, enables the new rate limiter (by disabling sentinel rate limiter) and sets Tyk up to use an in-memory cache for session-state data to save a round-trip to Redis for some other transactions.
Most of the changes below should be already in your tyk.conf by default:
"close_connections": false,
"proxy_close_connections": false,
"enforce_org_quotas": false,
"enforce_org_data_detail_logging": false,
"experimental_process_org_off_thread": true,
"enable_sentinel_rate_limiter": false,
"local_session_cache": {
  "disable_cached_session_state": false
},
"max_idle_connections_per_host": 500
In Tyk v2.7 we optimized the connection pool between Tyk and your Upstream. In previous releases max_idle_connections_per_host option, was capped at 100. From v2.7 you have been able to set it to any value.
max_idle_connections_per_host limits the number of keep-alive connections between clients and Tyk. If you set this value too low, then Tyk will not re-use connections and you will have to open a lot of new connections to your upstream.
If you set this value too high, you may encounter issues when slow clients occupy your connection and you may reach OS limits.
You can calculate the right value using a straightforward formula:
If the latency between Tyk and your Upstream is around 50ms, then a single connection can handle 1s / 50ms = 20 requests. So if you plan to handle 2000 requests per second using Tyk, the size of your connection pool should be at least 2000 / 20 = 100. For example, on low-latency environments (like 5ms), a connection pool of 100 connections will be enough for 20k RPS.
Protect Redis from overgrowing
Please read carefully through this doc to make an aware decision about the expiration of your keys in Redis, after which they will be removed from Redis. If you don’t set the lifetime, a zero default means that keys will stay in Redis until you manually delete them, which is no issue if you have a process outside Tyk Gateway to handle it. If you don’t - and especially in scenarios that your flow creates many keys or access tokens for every user or even per call - your Redis can quickly get cluttered with obsolete tokens and eventually affect the performance of the Tyk Gateway.
Analytics Optimizations
If using a Redis cluster under high load it is recommended that analytics are distributed among the Redis shards. This can be configured by setting the analytics_config.enable_multiple_analytics_keys parameter to true. Furthermore, analytics can also be disabled for an API using the do_not_track configuration parameter. Alternatively, tracking for analytics can be disabled for selected endpoints using the do not track endpoint plugin.
Protobuf Serialisation
In Tyk Gateway, using protobuf serialisation, instead of msgpack can increase performance for sending and processing analytics.
Note: protobuf is not currently supported in MDCB deployment.
If using Tyk Cloud platform under high load, it is also recommended that analytics are stored within a local region. This means that a local Tyk Pump instance can send the analytics to a localised data sink, such as PostgreSQL or MongoDB (no need for the hybrid pump). This can reduce traffic costs since your analytics would not be sent across regions.
Use the right hardware
Tyk is CPU-bound: you will get exponentially better performance the more cores you throw at Tyk - it’s that simple. Tyk will automatically spread itself across all cores to handle traffic, but if expensive operations like health-checks are enabled, then those can cause keyspace contention, so again, while it helps, health-checks do throttle throughput.
Resource limits
Make sure your host operating system has resource limits set to handle an appropriate number of connections.
You can increase the maximum number of files available to the kernel by modifying /etc/sysctl.conf.
fs.file-max=160000
Please note that a single file, with associated inode & dcache consumes approximately 1KB RAM. As such, setting fs.file-max=160000 will consume a maximum of 160MB ram.
The changes will apply after a system reboot, but if you do not wish to reboot quite yet, you can apply the change for the current session using echo 160000 > /proc/sys/fs/file-max.
File Handles / File Descriptors
Now we need to configure the file handles available to your Tyk services.
systemd
Override your systemd unit files for each of the Tyk services using systemctl edit {service_name}.
- Gateway
systemctl edit tyk-gateway.service - Dashboard
systemctl edit tyk-dashboard.service - Pump
systemctl edit tyk-pump.service - Multi Data-Center Bridge
systemctl edit tyk-sink.service
You may then add LimitNOFILE=80000 to the [Service] directive as follows:
[Service]
LimitNOFILE=80000
After making these changes, you’ll need to restart your service, for example:
systemctl restart tyk-gateway.service
Docker
You may set ulimits in a container using the --ulimit option. See Docker documentation for detail on setting ulimits
docker run --ulimit nofile=80000:80000 \
  -it --name tyk-gateway \
  tykio/tyk-gateway:latest
File modification at runtime
Understanding what files are created or modified by the Dashboard and Gateway during runtime can be important if you are running infrastructure orchestration systems such as Puppet, which may erroneously see such changes as problems that need correcting.
- Both the Gateway and Dashboard will create a default configuration file if one is not found.
- Dashboard will write the license into the configuration file if you add it via the UI.
- From Tyk v2.3 onwards it has been possible for a Dashboard to remotely change the config of a Gateway. This will cause the Gateway’s configuration file to update.
Evaluate Performance Benchmarks
An API Gateway serves as the single point of entry into your ecosystem, introducing an extra hop in the process. Because of this, performance is critical. Tyk was built with speed in mind from day one, which is why it’s written in Go, a language known for its efficiency and performance.
Resources to Explore Tyk’s Performance:
-
Tyk Performance Benchmarks
Discover how Tyk Gateway performs across:- The full Tyk feature set
- Multiple cloud environments
- CPU scalability
- Head-to-head comparisons with competitors
-
Performance Tuning Your Gateway
A step-by-step guide to fine-tuning your Gateway for maximum performance. -
Manual Performance Testing on AWS
Best practices for setting up and running manual performance tests on AWS to ensure your Gateway is optimized.