
As a client-facing engineer at Tyk, I’m often asked “How fast is Tyk’s API Gateway?”. My answer is always: “damn fast – and feature packed too!”. But how do you get the optimum performance from your Tyk installation? In this post we’ll be walking through step-by-step how you can get some insanely low latency and high throughput out of a tiny commodity server. We will get down to the nitty gritty and show you some actual numbers to help effectively tune and size your Tyk Gateway installation. I will be showing you how to:
- Increase throughput from ~5000 requests per second to ~6400 requests per second
- Reduce 95th %ile gateway latency by ~54% (9.2ms to 4.2ms)
- Reduce CPU consumption by ~40%
In order to achieve all of the above, we will be tweaking just a single environment variable: GOGC. We will be deploying Tyk Gateway, Redis Database, Upstream Server & Load Generator ALL to a single commodity 2-core DigitalOcean Droplet. In client production deployments, we have seen Tyk Gateways performing TLS termination, Authentication, Rate-Limiting & Quota checking plus analytics recording alongside Statsd instrumentation – with the Tyk Gateway introducing just 1.5ms of latency at a sustained mission critical 60k transactions per second. This performance blog is not supposed to be scientifically accurate – if you want to do that, feel free to re-create in a more sanitised environment and let me know your results over on the Tyk Community. Does that sound like fun? Let’s get benching!
But first, how not to deploy Tyk
When you view showcase WordPress themes they are almost always gorilla-slow: that is, very large and with assets that are megabytes in size when the browser downloads. In real life, you will never use every single asset that the theme provides, you will likely minify and apply a few tweaks, only enabling what you need for the production site. With this in mind, I’ve seen a couple of benchmarks of Tyk in the wild, and it is instantly clear that the deployment option chosen was a quick-start installation.
While this is perfect for a few key use-cases (see next paragraph), it’s important to remember that, much like a WordPress theme, the easiest & fastest way to deploy Tyk is never going to be optimally configured. The installation I refer to is the Tyk Pro Docker Demo, which is an all-in-one installation of the professional edition of Tyk. It is great at showing off features & functionality of Tyk as an enterprise API Management Platform, which can be deployed pretty much anywhere docker is available, but the amount of resource contention involved when benchmarking against this docker-compose micro-service architecture should not be surprising. By design, Tyk is deployed as a collection of cloud-native micro-services, all working harmoniously together. Possibly the only micro-services architecture API management solution in the wild to manage your micro-services. As such, taking an out-of-the-box docker-compose to benchmark it without taking the time to understand how each component interacts with each other will almost certainly result in sub-optimal and inconsistent results. See our performance benchmarks or learn about API management.
Sizing & Configuration
This short section will provide some insights on how to go about sizing Tyk & its dependencies. Tyk’s API Gateway is possibly the lightest and most performant solution in the industry, its only dependency being a small Redis Server. That’s right – there is no need for MongoDB, Cassandra, Postgres or any of these heavy, computationally & memory expensive databases for an Open Source installation of Tyk. In AWS, you could simply use ElastiCache, if GCP, you could use MemoryStore.
Redis
Redis requires enough ram to hold your tokens, temporary analytics and fast networking. A default Redis installation will persist to disk in a non-optimal fashion, in doing so, is likely to choke the Gateway with the default configurations. For simplicity, we would recommend disabling AOF to reduce disk space usage. SAVE locks the database, and as such, BGSAVE will allow snapshotting in a non-blocking fashion. In a real-world scenario, we recommend a Redis-cluster deployment, which will allow for linear performance improvements by sharding the data which is especially useful when you enable authentication, handle rate-limits and quotas. With Redis Cluster, you also get High Availability baked in with automatic failover. Introduction to Redis Cluster Tyk can easily speak with a Redis Cluster, or single Redis instance. For the purposes of this article, and to illustrate my point, we are simply deploying a single default configuration Redis master node on the same tiny Digital Ocean droplet as the gateway.
Tyk Open Source API Gateway
Tyk’s open source API gateway requires CPU, a small amount of RAM and fast networking. The Gateway is multi-threaded, and as such, will by default, under load, consume all the CPU made available to it by the host operating system. We would always recommend compute optimised nodes if deploying to a cloud provider like DO, Linode, AWS, Azure or GCP. Cloud providers usually provide a good balance of RAM to CPU, and RAM should not really be a concern for Tyk to perform optimally, unless you intend to also run RAM heavy applications on the same node. Once Tyk Gateways start consuming 60-70% CPU, we would recommend a scaling event. In the event that a node fails or is taken out for maintenance, then the remaining nodes in the cluster should have enough CPU remaining to handle the traffic from the failed node without suffering significant performance degradation.
Installation
We will deploy a commodity DigitalOcean server with 4GB RAM and 2 vCPUs for this benchmark. I will use a one-click-app with Docker deployed on Ubuntu 18.04 for speed of deployment. Going against everything I have said above, I will be deploying upstream, load server, Gateway and Redis all on the same box. This post is about how we can easily tune Tyk Gateway performance so the fact that all services are deployed on the same machine (resource contention) only proves that Tyk can go significantly faster if configured appropriately. Moving the target upstream and load generating servers to their own boxes, or ensuring appropriate resource limits if deploying inside Kubernetes for example.
Infrastructure / Application Setup
First, we install & startup NGinX which will be our baseline upstream server – you could use any performant upstream server you like really.
# install nginx
apt install nginx
systemctl start nginx
# Install Redis
apt install redis-server
systemctl start redis-server

# Install Tyk Gateway
apt install curl gnupg apt-transport-https
curl -L https://packagecloud.io/tyk/tyk-gateway/gpgkey | sudo apt-key add -

cat > /etc/apt/sources.list.d/tyk_tyk-gateway.list <<- SOURCES
deb https://packagecloud.io/app/tyk/tyk-gateway/search?dist=ubuntu trusty main
deb-src https://packagecloud.io/app/tyk/tyk-gateway/search?dist=ubuntu trusty main SOURCES
apt update
apt install tyk-gateway
systemctl start tyk-gateway

# check its up
curl -i localhost:8080/hello

HTTP/1.1 200 OK
Date: Sun, 03 Feb 2019 22:25:21 GMT
Content-Length: 10
Content-Type: text/plain; charset=utf-8

Hello Tiki
Gateway Proxy Configuration
# set env var to get ip address of eth1 easily
export privateip=$(ifconfig eth1 | grep "inet " | awk '{print $2}')

# configure a keyless API to override sample application
cat > /opt/tyk-gateway/apps/app_sample.json <<- EOF
{
    "name": "nginx",
    "api_id": "nginx",
    "org_id": "default",
    "definition": {
        "location": "",
        "key": ""
    },
    "use_keyless": true,
    "auth": {
        "auth_header_name": ""
    },
    "version_data": {
        "not_versioned": true,
        "versions": {
            "Default": {
                "name": "Default",
                "expires": "3000-01-02 15:04",
                "use_extended_paths": true,
                "extended_paths": {
                    "ignored": [],
                    "white_list": [],
                    "black_list": []
                }
            }
        }
    },
    "proxy": {
        "listen_path": "/nginx/",
        "target_url": "https://$privateip/",
        "strip_listen_path": true
    },
    "do_not_track": true
}
EOF

# reload Gateway configurations via it’s control API
curl -H "x-tyk-authorization: 352d20ee67be67f6340b4c0605b044b7" \ localhost:8080/tyk/reload/

# or just restart the service given that we are not in production
systemctl restart tyk-gateway

# test it
curl -i localhost:8080/nginx/
HTTP/1.1 200 OK
Content-Type: text/html
Date: Sun, 03 Feb 2019 22:38:53 GMT
Etag: W/"5c5747c8-264"
Last-Modified: Sun, 03 Feb 2019 19:58:00 GMT
Server: nginx/1.14.0 (Ubuntu)
X-Ratelimit-Limit: 0
X-Ratelimit-Remaining: 0
X-Ratelimit-Reset: 0
Content-Length: 612


--- SNIP ---
As you can see, this is an out-of-the-box Tyk installation.
Setting up benchmarking
In order to benchmark Tyk, we will use docker-hey https://hub.docker.com/r/rcmorano/docker-hey
# fix firewall rules to allow docker0 access to host machine
iptables -A INPUT -i docker0 -j ACCEPT
docker pull rcmorano/docker-hey
Baseline NginX Upstream # benchmark nginx directly to act as a baseline
docker run --rm -it rcmorano/docker-hey -z 30s https://$privateip/

Summary:
  Total: 30.0029 secs
  Slowest: 0.0305 secs
  Fastest: 0.0001 secs
  Average: 0.0029 secs
  Requests/sec: 17244.7455

Response time histogram:
  0.000 [1] |
  0.003 [303947] |■■■■■■■■■■■■■■■■■■■■■■■■■■■■■■■■■■■■■■■■
  0.006 [193680] |■■■■■■■■■■■■■■■■■■■■■■■■■
  0.009 [16511] |■■
  0.012 [2364] |
  0.015 [562] |
  0.018 [202] |
  0.021 [38] |
  0.024 [66] |
  0.027 [20] |
  0.031 [1] |

Latency distribution:
  10% in 0.0007 secs
  25% in 0.0016 secs
  50% in 0.0027 secs
  75% in 0.0040 secs
  90% in 0.0050 secs
  95% in 0.0058 secs
  99% in 0.0083 secs

Details (average, fastest, slowest):
  DNS+dialup: 0.0000 secs, 0.0001 secs, 0.0305 secs
  DNS-lookup: 0.0000 secs, 0.0000 secs, 0.0000 secs
  req write: 0.0000 secs, 0.0000 secs, 0.0225 secs
  resp wait: 0.0026 secs, 0.0000 secs, 0.0241 secs
  resp read: 0.0002 secs, 0.0000 secs, 0.0220 secs

Status code distribution:
  [200] 517392 responses
So, out of the box, NginX performs as follows – even though docker-hey is also consuming CPU and eating system resources.
| Slowest | 30.5ms |
| Average | 2.9ms |
| Median | 2.7ms |
| 95%ile | 5.8ms |
Baseline Tyk Reverse Proxy to NginX
So now that we have our baseline, we should see how Tyk out of the box performs as a transparent reverse proxy to NginX – even with some resource contention.
docker run --rm -it rcmorano/docker-hey -z 30s https://$privateip:8080/nginx/

Summary:
  Total: 30.0035 secs
  Slowest: 0.0768 secs
  Fastest: 0.0003 secs
  Average: 0.0099 secs
  Requests/sec: 5056.8813

Response time histogram:
  0.000 [1] |
  0.008 [67948] |■■■■■■■■■■■■■■■■■■■■■■■■■■■■■■■■■■■■■■■■
  0.016 [58333] |■■■■■■■■■■■■■■■■■■■■■■■■■■■■■■■■■■
  0.023 [22119] |■■■■■■■■■■■■■
  0.031 [2519] |■
  0.039 [544] |
  0.046 [198] |
  0.054 [33] |
  0.062 [18] |
  0.069 [6] |
  0.077 [5] |

Latency distribution:
  10% in 0.0034 secs
  25% in 0.0055 secs
  50% in 0.0087 secs
  75% in 0.0135 secs
  90% in 0.0177 secs
  95% in 0.0203 secs
  99% in 0.0268 secs

Details (average, fastest, slowest):
  DNS+dialup: 0.0000 secs, 0.0003 secs, 0.0768 secs
  DNS-lookup: 0.0000 secs, 0.0000 secs, 0.0000 secs
  req write: 0.0000 secs, 0.0000 secs, 0.0022 secs
  resp wait: 0.0098 secs, 0.0002 secs, 0.0768 secs
  resp read: 0.0000 secs, 0.0000 secs, 0.0054 secs

Status code distribution:
  [200] 151724 responses
| Baseline Latency | Latency (ms) | Introduced Latency (ms) | |
| Slowest | 30.5 | 76.8 | +46.3 |
| Average | 2.9 | 9.9 | +7 |
| Median | 2.7 | 8.7 | +6 |
| 95%ile | 5.8 | 20.3 | +14.5 |
Not bad – Tyk is able to handle 5000 rps out of the box despite the resource contention – this tiny machine is working very hard and all the CPU is being consumed. The problem we have here – is that our test is extremely aggressive – the average/median latency is acceptable, however there are some outliers which causes average latency to increase. The slowest request introduces 46ms latency which for me is unacceptable.
Resource Contention
Now in a real world scenario, you simply wouldn’t hammer the Gateway – the added latency for some of the requests is just not acceptable. Let’s throttle our rps a little. By default, docker-hey has 50 concurrent clients. The Gateway can handle 5k rps max in this setup. So by turning down the requests per second by just 5%, let’s see how latency improves, ensuring that requests come back in a timely and consistent fashion. We will set the rate limit per consumer to 95.
Rate limit per consumer = 5000/50 * 95% = 95
docker run --rm -it rcmorano/docker-hey -z 30s -q 95 https://$privateip:8080/nginx/

Summary:
  Total: 30.0138 secs
  Slowest: 0.0506 secs
  Fastest: 0.0002 secs
  Average: 0.0069 secs
  Requests/sec: 4713.9667

Response time histogram:
  0.000 [1] |
  0.005 [58984] |■■■■■■■■■■■■■■■■■■■■■■■■■■■■■■■■■■■■■■■■
  0.010 [57735] |■■■■■■■■■■■■■■■■■■■■■■■■■■■■■■■■■■■■■■■
  0.015 [18420] |■■■■■■■■■■■■
  0.020 [5468] |■■■■
  0.025 [740] |■
  0.030 [110] |
  0.036 [22] |
  0.041 [2] |
  0.046 [1] |
  0.051 [1] |

Latency distribution:
  10% in 0.0027 secs
  25% in 0.0040 secs
  50% in 0.0060 secs
  75% in 0.0090 secs
  90% in 0.0127 secs
  95% in 0.0150 secs
  99% in 0.0192 secs

Details (average, fastest, slowest):
  DNS+dialup: 0.0000 secs, 0.0002 secs, 0.0506 secs
  DNS-lookup: 0.0000 secs, 0.0000 secs, 0.0000 secs
  req write: 0.0000 secs, 0.0000 secs, 0.0032 secs
  resp wait: 0.0069 secs, 0.0002 secs, 0.0506 secs
  resp read: 0.0000 secs, 0.0000 secs, 0.0121 secs

Status code distribution:
  [200] 141484 responses
Whilst we lost just shy of 350 requests per second, look what we gained!
| Baseline Latency | Latency (ms) | Introduced Latency (ms) | |
| Slowest | 30.5 | 50.6 | +20.1 |
| Average | 2.9 | 6.9 | +4 |
| Median | 2.7 | 6.0 | +3.3 |
| 95%ile | 5.8 | 15.0 | +9.2 |
Latency is now at a much more acceptable level – by not overloading the CPU. Notice how we have still not actually done any tuning, but have still managed to reduce CPU consumption by more than 10%.
Advanced use cases only (research required)
Unlike various API management solutions, Tyk is written in pure Go. Go is a modern systems programming language, and is being actively developed by Google to solve Google-scale problems. Tyk does not rely on 3rd party software such as Nginx to do all the heavy lifting. Go provides both type safety and also offers a garbage collector.
The Go programming language has an enviably performant concurrent, tri-color, mark sweep garbage collector first proposed by Edsger W. Dijkstra in 1978. If you want the details, https://dl.acm.org/citation.cfm?id=359655. At a very high-level, stop-the-world GC pauses are now well below 10ms.
Despite the awesome GC, at such high throughput, compute is now being spent on scheduling the garbage collector, and collecting that garbage.
Before we go any further, note that the appropriate GOGC and GOMEMLIMIT values, which we discuss in a moment, are highly dependent on your specific use case. Tweaking them is worth investigating for advanced use cases – and one that requires research. The below is an example only – it will not match your ideal values.
GOGC doesn’t control the frequency of the garbage collection directly. It specifies the memory growth that triggers collection of unused memory objects. The default value is 100 which corresponds to 100% memory increase. For example if the gateway is currently using 150MiB of RAM the garbage collector will not be triggered by the GOGC value until the memory consumption reaches 300MiB. And even then it will only free unused memory, so if the gateway is using 200MiB of the 300 then at the end of the run 200MiB will be the new baseline and the garbage collector will not be triggered by GOGC again until memory consumption reaches 400MiB. Note that the garbage collector will run every 120 seconds regardless of the value of GOGC but that’s hard coded so we’re tweaking GOGC to control the garbage collection runs between those forced ones. This allows more CPU cycles to be used serving API requests.
This doubling of GOGC can cause OOM issues. For example if the baseline memory of the gateway instance is 3GiB and there is 5GiB available and GOGC is set to the default 100. Then GOGC will only trigger the garbage collector again at 6GiB which is too late and memory growth can still cause an OOM. The regular 120s run of the garbage collector might catch this, but if the growth happens too quickly it won’t.
To help with this problem the golang developers introduced GOMEMLIMIT in golang 1.19. Tyk 5.1 and later use this version of golang so they support GOMEMLIMIT.
The golang team have a wonderful interactive example of how the GOGC and GOMEMLIMIT variables work at https://tip.golang.org/doc/gc-guide#GOGC which is a great way to understand the process.
At the expense of a little extra RAM usage, we can tweak the scheduler so that it runs less often. You need to tweak this yourself, as the ideal value will require adjusting to meet your specific needs and scale.
In this example, I’m going to set the value of GOGC to 3200%, it’s ideal for this Load Test, but it WILL NOT match your ideal value. You should start with a smaller adjustment from default, assess the impact, then adjust again. I will also set GOMEMLIMIT=3GiB which is safely under the 4GiB that the system has and removes the danger of the gateway being OOM killed.
To change the scheduler, we set a system environment variable GOGC. To reiterate, you MUST play around with this figure for your specific use-case. Having a reasonable GOMEMLIMIT will remove the risk of being OOM killed but there is a trade off with having the garbage collector running little and often or only running very occasionally but having more work to do.
There will come a point where you don’t get noticeable gains. I doubled the GOGC value each test to find what the optimum figure was and that’s how I arrived at the 3200% figure for this example. I would NOT recommend using this number yourself, as it’s been arrived at by optimizing for this specific test and environment
Tuning Tyk’s Garbage Collector
systemctl edit tyk-gateway.service
# Add a [Service] directive and then add Environment="GOGC=YOURVALUEHERE" and Environment="GOMEMLIMIT=YOURVALUEHERE"
[Service]
Environment="GOGC=YOURVALUEHERE"
Environment="GOMEMLIMIT=YOURVALUEHERE"

# save, quit and restart the tyk-gateway service
systemctl restart tyk-gateway.service
Let’s re-run the benchmark
docker run --rm -it rcmorano/docker-hey -z 30s -q 95 https://$privateip:8080/nginx/

Summary:
  Total: 30.0065 secs
  Slowest: 0.0425 secs
  Fastest: 0.0003 secs
  Average: 0.0048 secs
  Requests/sec: 4739.7088

Response time histogram:
  0.000 [1] |
  0.004 [69149] |■■■■■■■■■■■■■■■■■■■■■■■■■■■■■■■■■■■■■■■■
  0.009 [69266] |■■■■■■■■■■■■■■■■■■■■■■■■■■■■■■■■■■■■■■■■
  0.013 [2489] |■
  0.017 [841] |
  0.021 [373] |
  0.026 [67] |
  0.030 [16] |
  0.034 [4] |
  0.038 [9] |
  0.043 [7] |

Latency distribution:
  10% in 0.0027 secs
  25% in 0.0035 secs
  50% in 0.0045 secs
  75% in 0.0056 secs
  90% in 0.0067 secs
  95% in 0.0077 secs
  99% in 0.0126 secs

Details (average, fastest, slowest):
  DNS+dialup: 0.0000 secs, 0.0003 secs, 0.0425 secs
  DNS-lookup: 0.0000 secs, 0.0000 secs, 0.0000 secs
  req write: 0.0000 secs, 0.0000 secs, 0.0045 secs
  resp wait: 0.0047 secs, 0.0002 secs, 0.0425 secs
  resp read: 0.0000 secs, 0.0000 secs, 0.0052 secs

Status code distribution:
  [200] 142222 responses
Holy cow – we just dropped from 82% CPU usage down to less than 60%! We are now using 26% less CPU than the previous test and about 40% less CPU than our first bench. Tyk is still handling the same RPS, but rather than waste compute on collecting garbage, the gateway is being able to proxy requests.
| Baseline Latency | Latency (ms) | Introduced Latency (ms) | |
| Slowest | 30.5 | 42.5 | +12 |
| Average | 2.9 | 4.8 | +1.9 |
| Median | 2.7 | 4.5 | +1.8 |
| 95%ile | 5.8 | 7.7 | +1.9 |
The slowest request is just 12ms slower than the slowest baseline request. Tyk is now adding sub 2ms 95%ile latency. 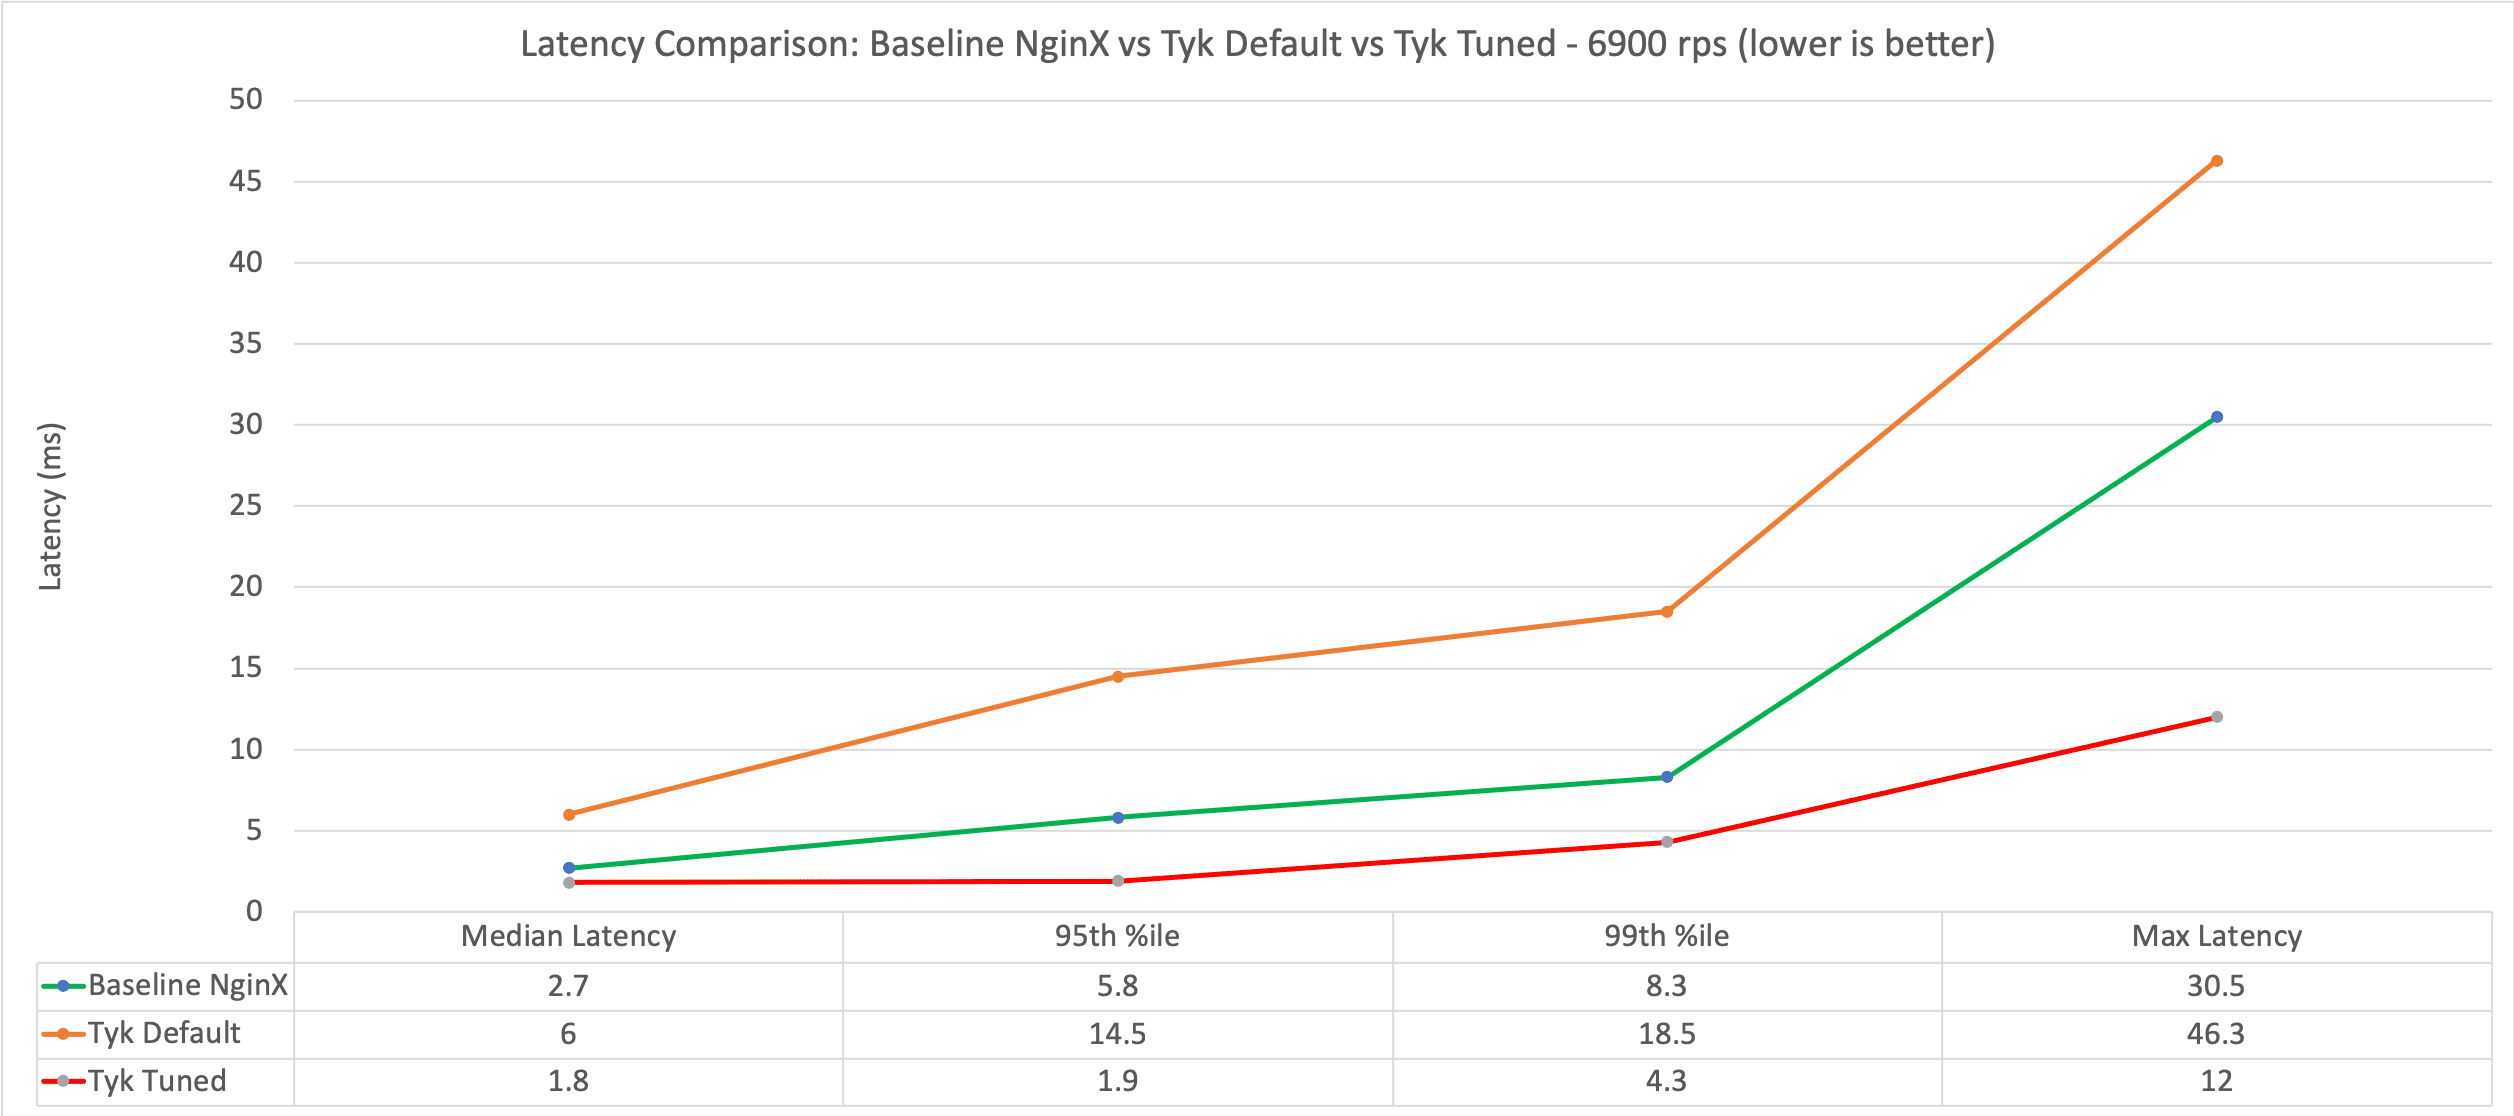 At 60-70% CPU usage we would recommend adding another Tyk to the cluster. But this is a benchmarking blog – so let’s up the RPS. Let’s try full speed again to see what Tyk can handle when maxing out.
docker run --rm -it rcmorano/docker-hey -z 30s https://$privateip:8080/nginx/

Summary:
  Total: 30.0050 secs
  Slowest: 0.0955 secs
  Fastest: 0.0003 secs
  Average: 0.0072 secs
  Requests/sec: 6897.5780

Response time histogram:
  0.000 [1] |
  0.010 [165543] |■■■■■■■■■■■■■■■■■■■■■■■■■■■■■■■■■■■■■■■■
  0.019 [38325] |■■■■■■■■■
  0.029 [2665] |■
  0.038 [332] |
  0.048 [75] |
  0.057 [6] |
  0.067 [8] |
  0.076 [2] |
  0.086 [3] |
  0.096 [2] |

Latency distribution:
  10% in 0.0030 secs
  25% in 0.0046 secs
  50% in 0.0066 secs
  75% in 0.0091 secs
  90% in 0.0120 secs
  95% in 0.0144 secs
  99% in 0.0212 secs

Details (average, fastest, slowest):
  DNS+dialup: 0.0000 secs, 0.0003 secs, 0.0955 secs
  DNS-lookup: 0.0000 secs, 0.0000 secs, 0.0000 secs
  req write: 0.0000 secs, 0.0000 secs, 0.0042 secs
  resp wait: 0.0072 secs, 0.0002 secs, 0.0955 secs
  resp read: 0.0000 secs, 0.0000 secs, 0.0059 secs

Status code distribution:
  [200] 206962 responses
  req write: 0.0000 secs, 0.0000 secs, 0.0078 secs
  resp wait: 0.0072 secs, 0.0002 secs, 0.0684 secs
  resp read: 0.0000 secs, 0.0000 secs, 0.0069 secs

Status code distribution:
  [200] 205300 responses
So the Gateway is now handling 6900 rps rather than the original 5000 rps (27% increase), and latency is still pretty good adding just 8.6ms at the 95th %ile – That’s a massive 40% improvement in latency from the out-of-the-box installation of Tyk.
| Baseline Latency | Tyk Latency (ms) | Introduced Latency (ms) | |
| Slowest | 30.5 | 95.5 | +65.5 |
| Average | 2.9 | 7.2 | +4.3 |
| Median | 2.7 | 6.6 | +3.9 |
| 95%ile | 5.8 | 14.4 | +8.6 |
By dialling back the throughput once again by about 5% so that we are not overloading the CPUs – we set q to 131 (6900/50*0.95).
docker run --rm -it rcmorano/docker-hey -z 30s -q 131 https://$privateip:8080/nginx/

Summary:
  Total: 30.0058 secs
  Slowest: 0.0473 secs
  Fastest: 0.0003 secs
  Average: 0.0052 secs
  Requests/sec: 6412.0916

Response time histogram:
  0.000 [1] |
  0.005 [105806] |■■■■■■■■■■■■■■■■■■■■■■■■■■■■■■■■■■■■■■■■
  0.010 [76053] |■■■■■■■■■■■■■■■■■■■■■■■■■■■■■
  0.014 [7891] |■■■
  0.019 [1834] |■
  0.024 [563] |
  0.028 [194] |
  0.033 [52] |
  0.038 [4] |
  0.043 [1] |
  0.047 [1] |

Latency distribution:
  10% in 0.0027 secs
  25% in 0.0036 secs
  50% in 0.0047 secs
  75% in 0.0060 secs
  90% in 0.0079 secs
  95% in 0.0100 secs
  99% in 0.0158 secs

Details (average, fastest, slowest):
  DNS+dialup: 0.0000 secs, 0.0003 secs, 0.0473 secs
  DNS-lookup: 0.0000 secs, 0.0000 secs, 0.0000 secs
  req write: 0.0000 secs, 0.0000 secs, 0.0026 secs
  resp wait: 0.0051 secs, 0.0002 secs, 0.0473 secs
  resp read: 0.0000 secs, 0.0000 secs, 0.0034 secs

Status code distribution:
  [200] 192400 responses
| Baseline Latency | Total Latency (ms) | Tyk Introduced Latency (ms) | |
| Slowest | 30.5 | 47.3 | +17 |
| Average | 2.9 | 5.2 | +2.3 |
| Median | 2.7 | 4.7 | +2.0 |
| 95%ile | 5.8 | 10.0 | +4.2 |
CPU is at a much healthier 80%, we are still handling 6400 requests per second (1400 rps more than original) and are introducing just 2.3ms average latency or 4.2ms latency at the 95th %ile. Therefore a 54% improvement on the default Tyk Installation.
Summary
It is important to remember that everything has been deployed on a 2-virtual-core commodity server with just 4GB of RAM. Because we still have significant resource contention from the upstream server, load server, Redis and the Gateway all deployed on the same box, there is no way of knowing the true performance of the gateway without splitting out the components onto their own machines, or dedicating compute to each component. Despite all of this, by tweaking a single environment variable, Tyk has been able to handle 6400 requests per second. 95% of requests come back within 10ms and subtracting Nginx’s baseline latency, Tyk has introduced just 4.2ms 95th %ile latency to the request. To top that, all the services combined are only consuming 80% CPU and less than 600Mb RAM. Further optimizations can be made to Tyk configurations to tune Tyk further in accordance with your specific use-case. Want to give it a go? We’d love to hear your results! Drop us a line via the Tyk Community to share your own benchmarks and help us continue to improve Tyk performance. Happy benching!