GraphQL is convenient for developers because it allows them to ask for exactly what they want and get the data they need without hassle. But running GraphQL in production can be incredibly challenging.
Pinpointing the exact source of a GraphQL error is like searching for a needle in a haystack. It requires sifting through layers of data fetching logic, resolver functions and upstream services, hoping to stumble upon the culprit.
My colleague Ahmet and I discussed this topic at KubeCon Amsterdam; you can watch the video “What Could Go Wrong with a GraphQL Query and Can OpenTelemetry Help?” if you want to learn more.
Error Handling in GraphQL – 200 is not OK
With REST APIs, you can monitor and detect errors by looking at the HTTP status code in the response to the API call. In GraphQL, errors are returned as part of the data response with a 200 HTTP status code, even in the case of partially successful queries.
This is helpful for developers on the front-end side as they can receive meaningful data alongside error information, allowing them to handle errors gracefully and display relevant content to users. This eliminates the need for multiple network calls or additional error-handling logic, streamlining the development process and enhancing the user experience.
But this approach can make monitoring and issue detection in production more challenging. Also, determining whether the client or the server causes an error can be more difficult than REST APIs. Since GraphQL responses can contain a mix of successful data and error information, distinguishing between client errors (such as invalid queries or incorrect data) and server errors (such as infrastructure issues or internal server errors) requires careful analysis of the error details provided.
Recording GraphQL error information in a distributed trace helps understand request flow, pinpoint errors, and optimise performance. It enables comprehensive troubleshooting, proactive monitoring, and faster issue resolution, improving the user experience and system reliability.
Let’s see how this works.
OpenTelemetry support for GraphQL
If your GraphQL server still needs to be instrumented with OpenTelemetry, you can use one of the libraries the OpenTelemetry community provides. The example from this blog post uses an Express GraphQL Server and the corresponding instrumentation library in Node.js.
Let’s take a look at a GraphQL request returning an error:
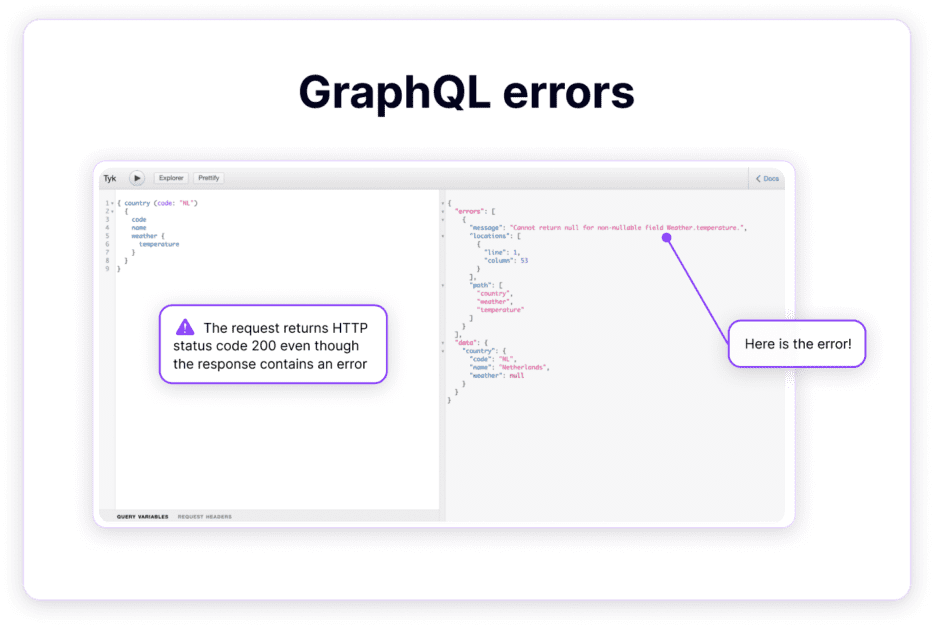
A request in the GraphQL playground returning an error with HTTP status code 200 even though the response contains an error.
Unfortunately, when using the GraphQL instrumentation library for node.js, GraphQL errors are not reported automatically. If you look at the distributed trace for that transaction, it doesn’t contain any information about that error.
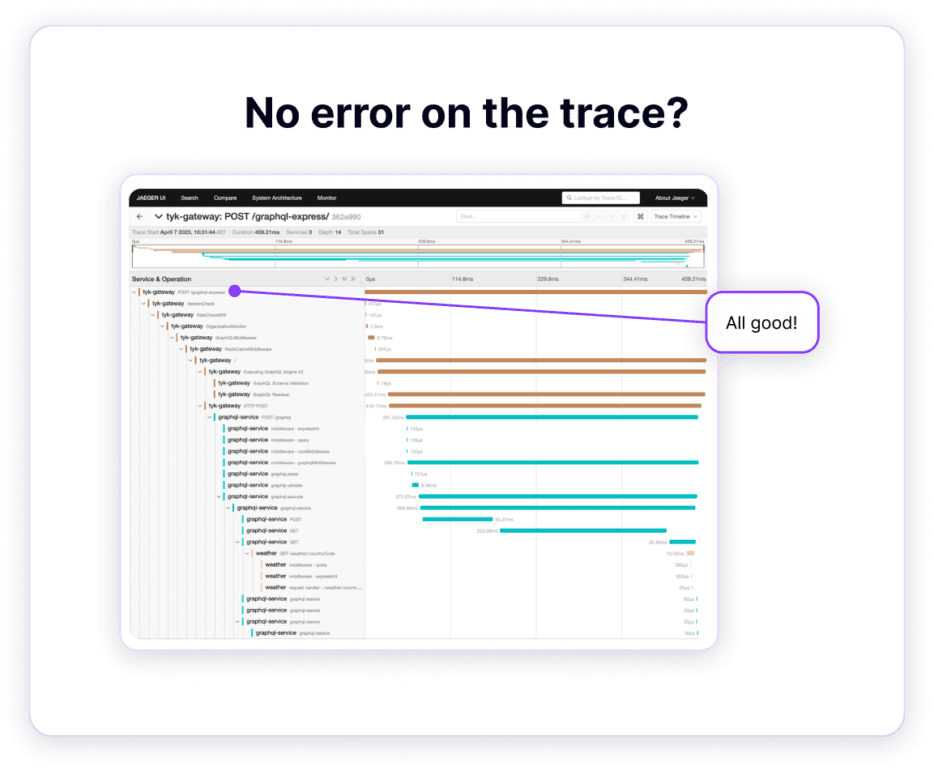
No error is recorded on the distributed trace.
Capture GraphQL errors on a distributed trace
What we can do is use manual instrumentation to report a span that contains the error details. Here is a code snippet that shows how to do with a straightforward Node.js Express GraphQL server:
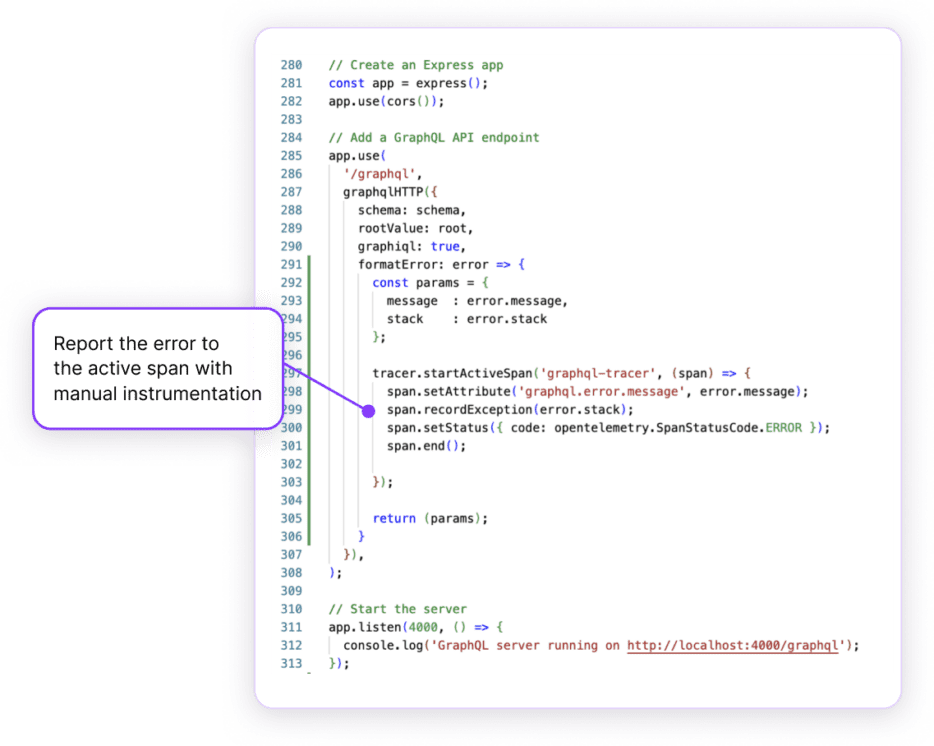
Adding custom instrumentation added to report GraphQL errors.
And this is the result:
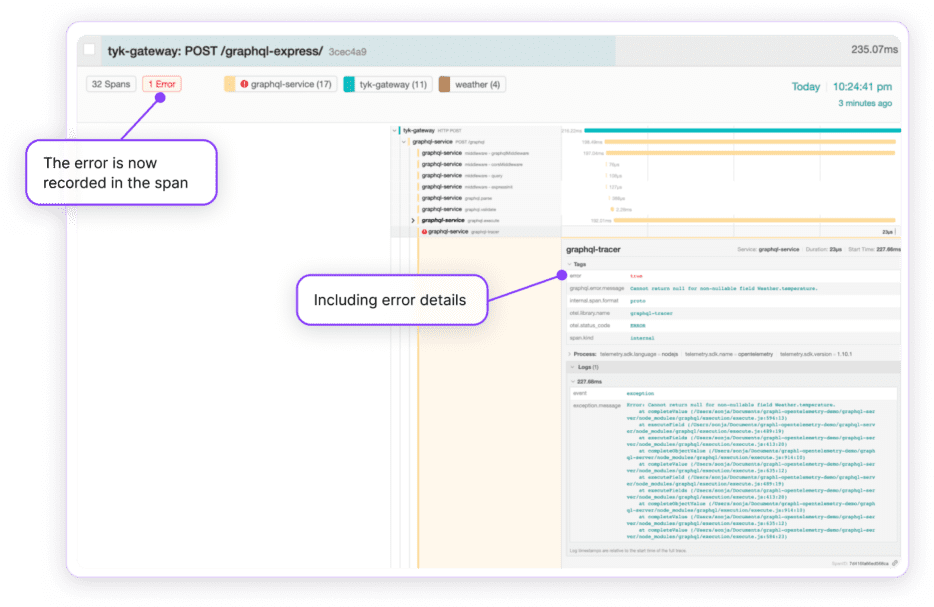
GraphQL errors are now reported on the distributed trace.
Recording GraphQL error information in a distributed trace helps to understand the complete flow of a GraphQL request and pinpoint the source of any errors that may occur – whether the issue is coming from a resolver or an upstream service. It is helpful when you know an error is happening and want to get all the information you need to troubleshoot it.
But how do you detect errors in the first place? Let’s use this data to generate RED metrics for your GraphQL server.
RED metrics for GraphQL using OpenTelemetry span metrics connector
The RED metrics is a method of monitoring microservices, which recommends that we monitor every service:
- Rate: the number of requests
- Errors: the number of those requests that are failing
- Duration: the amount of time those requests take
Lucky for us, the OpenTelemetry projects make it very easy to generate RED metrics from OpenTelemetry traces by configuring the span metrics connector on the OpenTelemetry collector.
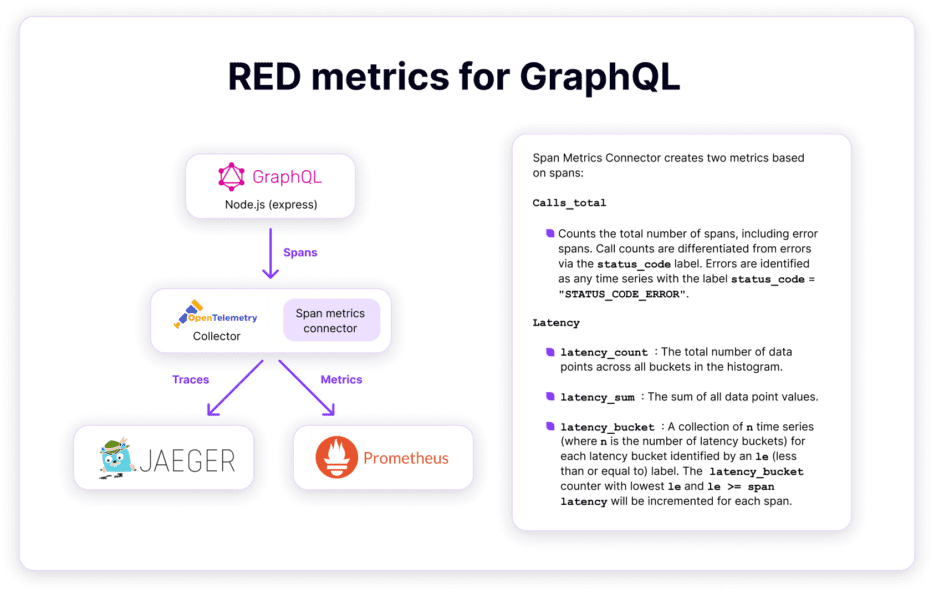
In this example, we used Prometheus to store those metrics, but you could send them to any other observability backend that supports metrics.
And here’s the result – we can now monitor our GraphQL errors to create alerts for any error peak or validate that our improvement to reduce the mistakes is paying off.

OpenTelemetry can help run GraphQL in production in many other use cases, making it truly cloud-native.
Are you interested in learning how to detect N+1 query issues? Or how OpenTelemetry could help you safely deprecate GraphQL fields?
Let us know your use case on the community forum, and keep an eye out for another blog post on this topic…