An API gateway can simplify operational concerns like observability by providing a single access point for requests to all web services in a system. As all requests flow through the API gateway, it presents a single place to add functionality like metrics gathering.
In my previous article, I showed how to export metrics captured by Tyk API Gateway to Prometheus and leverage them to report service-level objectives in Grafana. In this post, I want to discuss another aspect of observability: distributed tracing.
At Tyk, we have recently started our efforts to migrate from OpenTracing to OpenTelemetry. I shared our approach at the Kubernetes Community Days in Munich in October.
Here is a blog post to discuss what we have learned so far. I hope it will be helpful if you are, like us, at the beginning of your observability journey with OpenTelemetry.
Distributed tracing, OpenTracing, OpenTelemetry: what is it?
First, a bit of context
Distributed tracing is a technique to monitor and observe requests as they flow through your services. Here, you can see a diagram of an application with two front-end (mobile and web) using an API Gateway and three different services.
Distributed traces are typically displayed either as a service map or as a trace view.
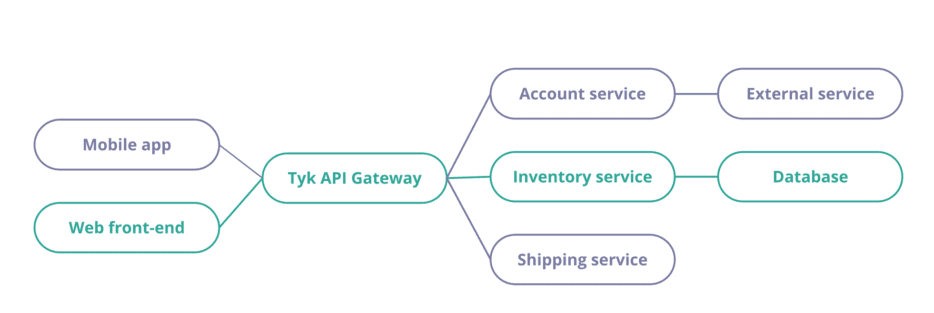
Service map, showing how to connect services.
Distributing tracing allows you to visualise service dependencies, performance, and any errors or unusual latency for each transaction. This is not only helpful for production monitoring but also for optimisation during the whole lifecycle of the application – from development, testing and production.
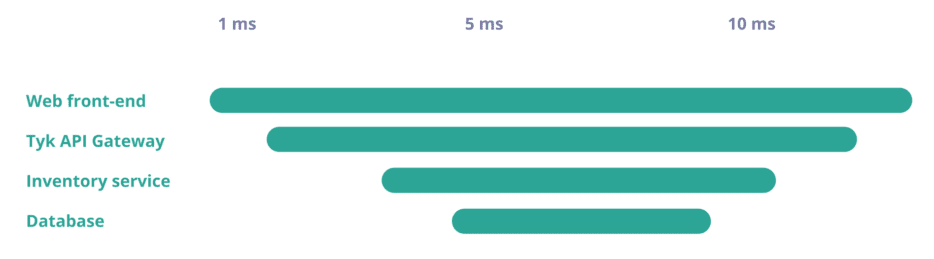
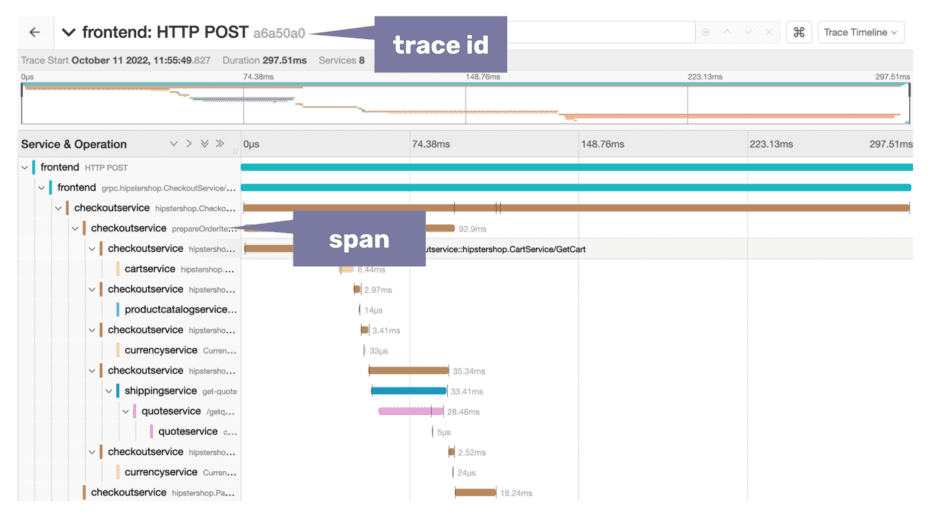
Trace view, showing the time spent in each service.
This is where OpenTracing and OpenTelemetry come into play. In the open source world, in the past, you would use OpenTracing to instrument your services. Nowadays, OpenTelemetry (an evolution of OpenTracing) is the new standard.
How does distributed tracing work?
To make distributed tracing work, you need to do two things:
- Instrument your environment to collect and export information like timings and details about errors for essential operations like an outgoing HTTP request.
- Make sure each service propagates a unique ID that uniquely identifies the trace. You can do this with an HTTP header.
The instrumentation of your service and the propagation of a unique trace id is done by the OpenTelemetry SDK. Your observability platform will receive all this data and combine the spans using the unique trace id.
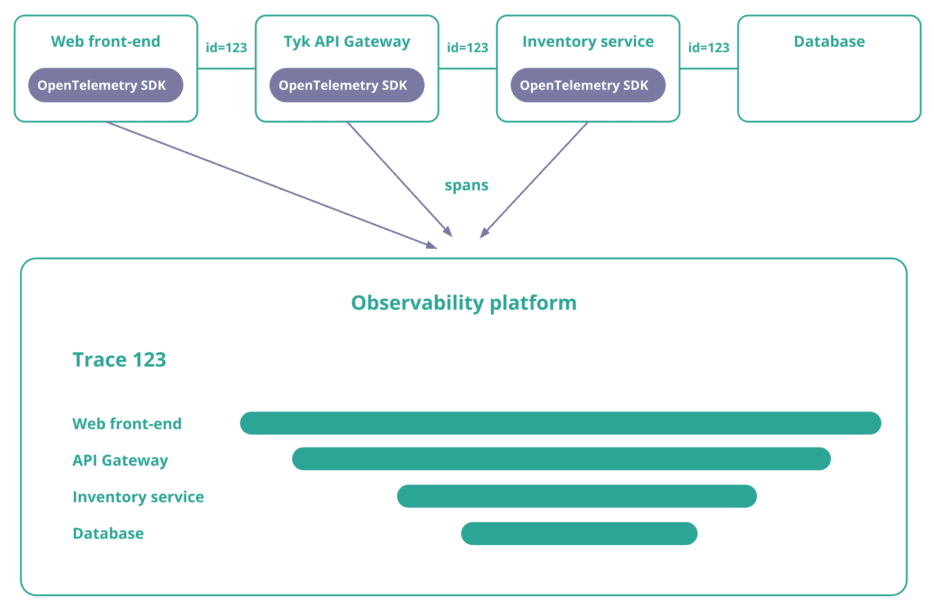
And this is how a distributed trace looks in an observability tool like Jaeger (screenshot from the OpenTelemetry demo).
Observability is a must-have feature of cloud-native software
At Tyk, we believe that observability is a must-have feature of any software. In modern cloud-native systems, every component contributing to your users’ end-to-end requests should be able to report telemetry data for monitoring, debugging, and optimisation purposes.
This is why we have built Tyk Pump, an open-source component that enables you to convert and transfer metrics and logs captured in Tyk API Gateway to the most popular observability tools.
For distributed tracing, we implemented OpenTracing a couple of years ago. Now that OpenTelemetry is getting mature and OpenTracing is deprecated, we want to migrate to OpenTelemetry.
As with any other feature that you add to your product, these are the critical points to consider:
Is it valuable for your users?
Over the past few months of working with our users, we have seen a pattern emerge. More companies are now implementing distributed tracing. And having more visibility into Tyk API Gateway will help them monitor and troubleshoot their APIs end-to-end.
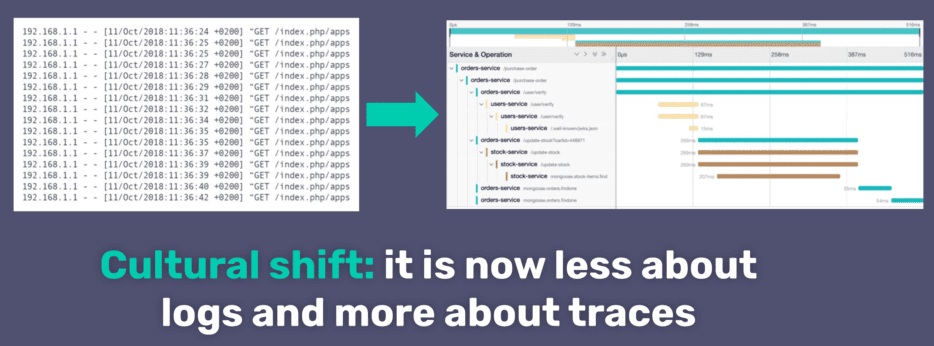
The cultural shift from log to traces.
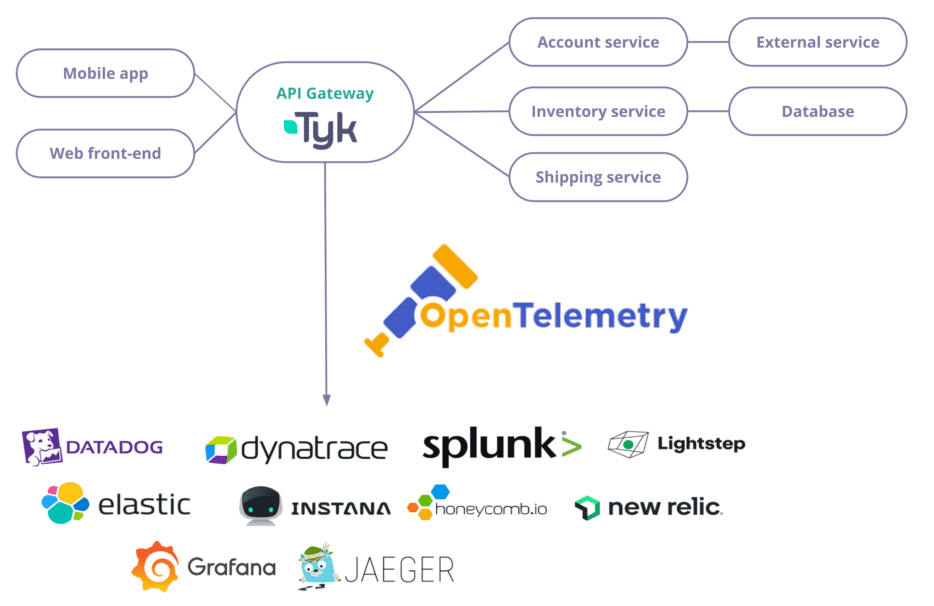
Observability inherently requires looking at the data from different views to answer additional questions for other users. In the CNCF End User Technology Radar for Observability, half of the companies use five or more observability tools, and a third of them have experience with 10+ tools.
This is why OpenTelemetry is vital for us (implement an open standard once, supported by all significant observability vendors and open source tools). It allows our users to best use the telemetry data generated by our API Gateway in their preferred tool.
Is OpenTelemetry ready yet?
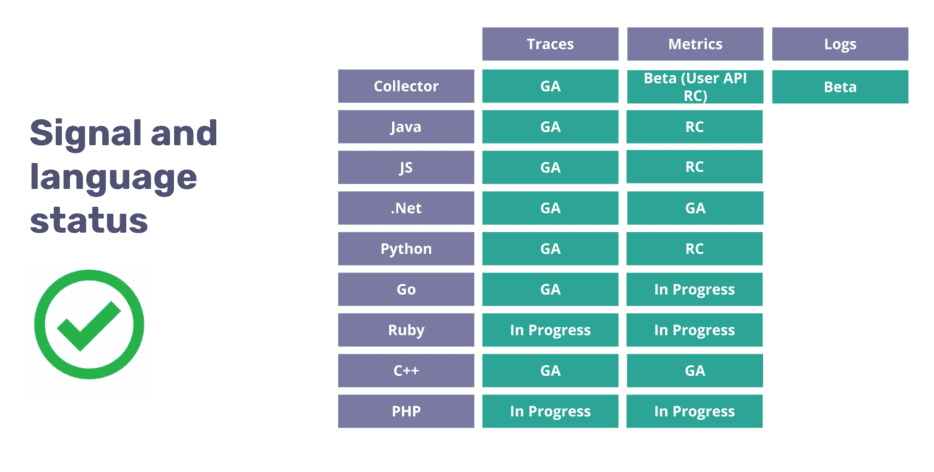
OpenTelemetry has many moving parts, all working together to help you instrument, generate, collect, and export telemetry data. Some of those components are language-specific, and others are language-agnostic. To understand if it is safe to use OpenTelemetry in production yet, you need to first check the specification status for the telemetry signal you want to implement. Here we can read that for tracing, the “specification is now completely stable and covered by long-term support”.
The next thing to check is a language SDK’s development status or maturity level. Our API Gateway is written in Go, and we can see on the Go SDK page that the trace signal is labelled as GA, whereas the metrics are still a work in progress.
Based on that, we learned that we can proceed with traces, but we probably need to wait to work on exporting our metrics and even longer to start thinking about logs. There is an even more detailed compliance matrix if you want to check exactly which functionality is available for your language.
How much effort will it take?
To understand how much effort it will take for our engineering team, we look at the different options to migrate from OpenTracing to OpenTelemetry:
- The first option is to use a bridge to replace the OpenTracing implementation (like a Jaeger client) with the OpenTelemetry SDK. It is available in all languages supported by OpenTracing. It is a good option if you are happy with your instrumentation and want to keep it the same.
- The second option is to keep your code and leverage the OpenTelemetry collector to translate the traces into the OpenTelemetry format. This is very similar to the first option, but you have to accept that with the OpenTelemetry collector, you will have to deploy and maintain an additional component.
- The third option is to start from scratch and rewrite the instrumentation. This is the most time-intensive option.
We looked at our current OpenTracing implementation and realised we needed to include a lot of helpful information and therefore decided to start from scratch.
Five questions to ask yourself before (re)instrumenting your service
This is where we are right now, working on instrumenting our API Gateway with OpenTelemetry. If you are a user of our open-source or commercial offering and want to provide feedback on this upcoming functionality, make sure to comment on our community post.
In the process, we came up with five questions that everybody should ask themselves before instrumenting their services:
1. Which context propagation should you implement?
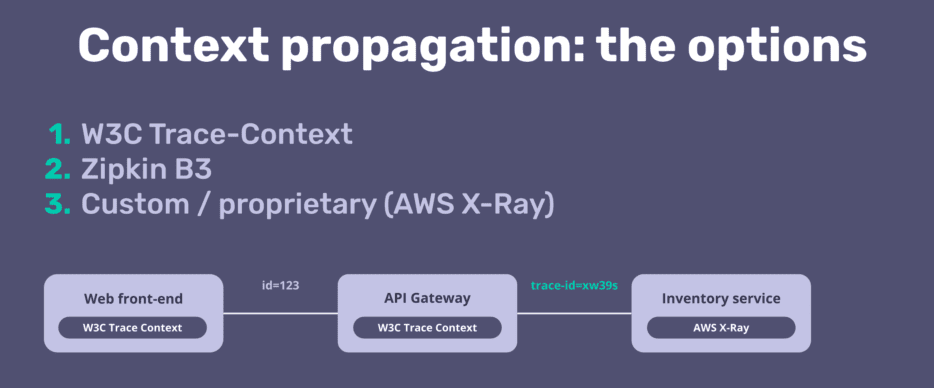
- Each service and component will export its spans (part of the trace) when using distributed tracing. A unique identifier (trace id) is needed to stitch those spans together to get the end-to-end distributed trace.
- In the past, each observability vendor and tool implemented its own format to express this trace id (B3, Jaeger native propagation). A couple of years ago, a new standard was created: W3C trace-context, which is the standard recommended by OpenTelemetry.
- Here is an excellent video to learn more about context propagation with OpenTelemetry.
- With our OpenTracing support in Tyk API Gateway, we supported B3 with Zipkin and Jaeger native propagation with Jaeger. We plan to use W3C Trace-Context going forward.
2. How much detail should you expose?
We want to expose as many details as needed for our users to troubleshoot their APIs. But it also comes with a performance cost in applications, a networking cost as you export the traces outside your network and a storage cost to store this data in your observability platform.
A good guideline is ensuring to instrument at least all incoming and outgoing calls. Some of our users want to get only those. In contrast, others want full details on what is happening inside the Gateway (timings for rate-limiting, authentication and any custom plugins).
In terms of attributes, we are thinking about recording attributes that can help explain a performance variation, such as attributes related to:
- The user (a customer id, a device type)
- Your software (the version, a feature flag)
- Data flow (response size, if the answer was cached)
- Infrastructure (on which host is your application deployed)
3. Are you exposing PII data?
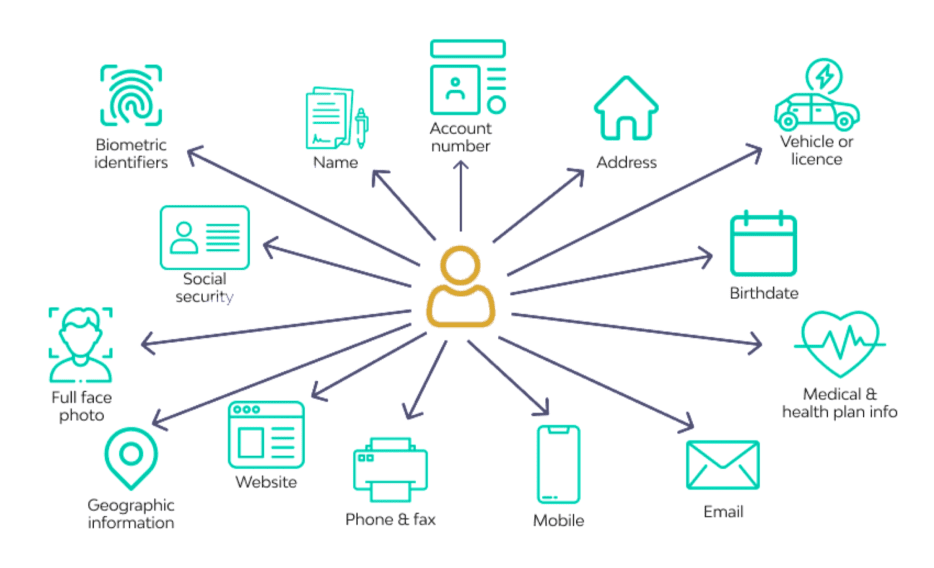
We must ensure that we are not exposing PII data.
Attributes, tags, events, logs, and even span names can potentially contain personally identifiable information (PII). Depending on local and federal regulations, this data will be protected by law, and we should carefully consider what data we add to the spans.
Oxeye’s research team discovered several scenarios where sensitive data was leaked through tracing and telemetry collection within cloud-native applications. They found one that belonged to a leading online payment services company among the many deployments.
A deeper investigation demonstrated that by leveraging the tracing and telemetry data, it was possible for a malicious user to bypass the authentication mechanism and login into the online payment service platform as other legitimate users, access their personal data and perform actions on their behalf. We don’t want something like this to happen with information collected and exported from our Gateway.
4. Which sampler to implement?
Sampling is a mechanism to reduce the number of samples of traces collected and sent to the backend. You can implement sampling at different stages of a trace collection which helps minimise networking and storage costs.
With head-based sampling, the earliest sampling happens before the trace. Or, it can happen later in the collector with a tail-based sampling. If you decide not to sample, you risk incurring hefty charges from your cloud provider.
- In a pre-production environment, it is recommended to use “alwayson” – never sample.
- In a production environment, it makes sense to start sampling depending on the load on your system.
- For our API Gateway, it means it should be configurable; we cannot make this decision for our users and their environment.
5. How much overhead will be added by the instrumentation?
The last question – and probably one that many of our users will ask us as soon as we release this new feature – how much overhead will this add? Understanding that impact is essential in choosing the right granularity for spans. Creating and finishing spans and adding can generate latency.
Performance is essential for us at Tyk, and as we process with OpenTelemetry support in Tyk Gateway, we will run our performance benchmark against it to make sure the overhead is minimal.
What’s next?
We take a look at what changes Open Telemetry will bring to API observability in the future in our webinar “Open Telemetry: the future of API observability”. Watch the recording now.