With the Prometheus custom metrics functionality we have just released in Tyk Pump 1.6, you can now expose more granular telemetry data for your APIs. This blog post will look at the telemetry data recorded by Tyk API Gateway and how to use them to set up SLIs and SLOs with Prometheus and Grafana.
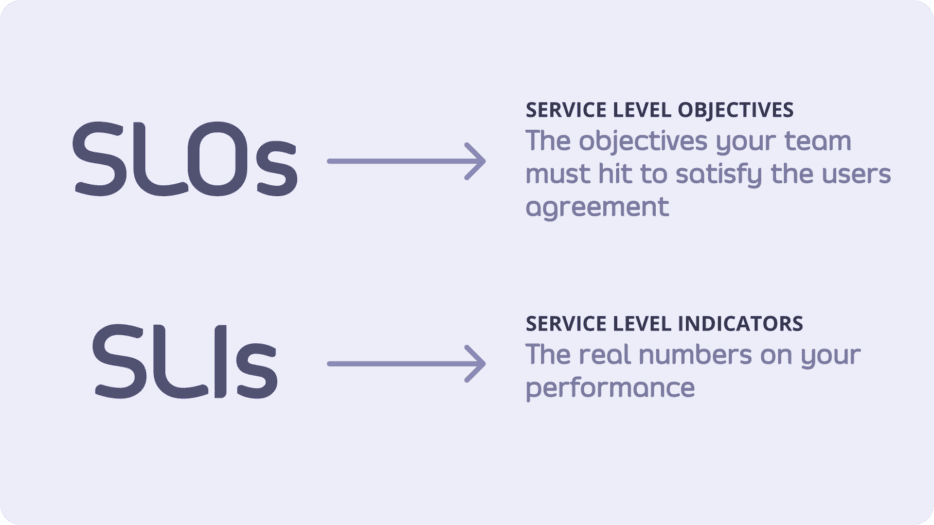
It’s not news that setting service level indicators (SLIs) and service level objectives (SLOs) have become an important part of site reliability engineering (SRE) practice. SLOs let you define, measure and deliver a given level of service to your users, whether they use an internal API or a public product.
But figuring out what to measure and how to measure it can get tricky, especially in today’s complex and distributed architectures.
Because they play a central role in microservice and service-oriented architecture (SOA), API Gateways are the perfect place to observe your service’s behaviours.
Setting up Tyk API Gateway, Tyk Pump, Prometheus and Grafana
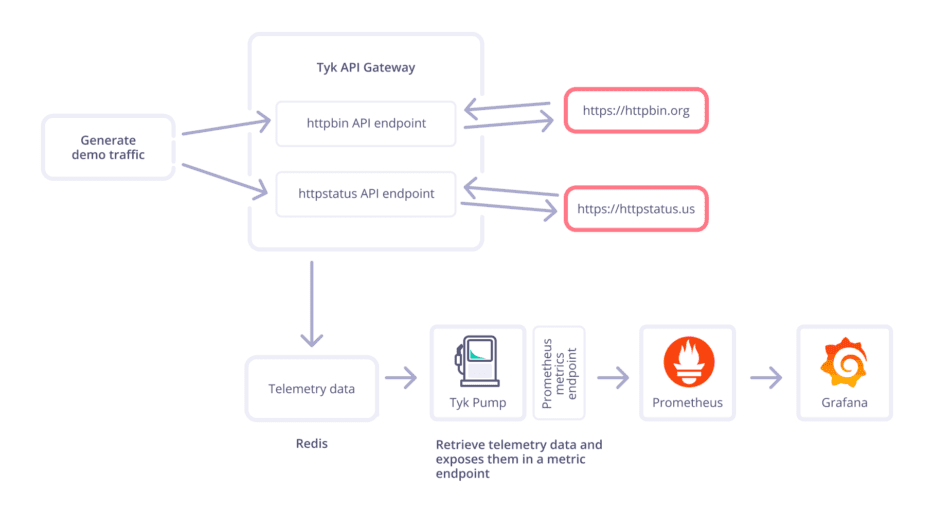
For this blog post, I’m using an open-source deployment of Tyk API Gateway with Tyk Pump. I have configured two API endpoints that redirect to external APIs.
The Tyk stack:
Tyk API Gateway is configured to expose two API endpoints:
- httpbin (see API definition)
- httpstatus (see API definition)
Tyk Pump is an open-source component fully supported by Tyk that enables you to convert and transfer built-in telemetry data to the most popular observability tools, including Prometheus.
- Tyk Pump is configured to expose a metric endpoint for Prometheus (see config) with two custom metrics called tyk_http_requests_total and tyk_http_latency.
- The options to customise your Prometheus metrics were added in Tyk Pump 1.6, released in June 2022.
The observability stack:
- Prometheus
- prometheus.yml is configured to scrape Tyk Pump’s metric endpoint automatically
- slos.rules.yml is used to calculate additional metrics needed for the remaining error budget
- Grafana
- prometheus_ds.yml is configured to connect Grafana automatically to Prometheus
- SLOs-for-APIs-managed-by-Tyk.json is the dashboard definition
- K6, an open-source load testing tool from Grafana, will use the load script load.js to generate demo traffic to the API endpoints.
If you are the kind of person that likes to try things out by themselves first, make sure to check out the demo project on GitHub.The whole set-up runs within seconds in docker.
Indicators in practice: what should you care about?
Service-level indicators (SLIs) refer to the actual metrics produced by services. These are the real numbers that indicate overall performance.
When it comes to SLIs for services and APIs, I like to follow Tom Wilkie’s RED method of monitoring microservices, which recommends that we monitor every service:
- Rate: the number of requests
- Errors: the number of those requests that are failing (returning a 5xx HTTP error code)
- Duration: the amount of time those requests take
“Everyone should understand the error rate, the request rate, and then some distribution of latency for those requests,” Tom explained. “You model this for every single service in your architecture, and this gives you a nice, consistent view of how your architecture is behaving. Giving this kind of consistency across services allows you to scale your operational team, and allows you to put people on call for code they didn’t write”, quote from Tom Wilkie.
Luckily, Tyk API Gateway automatically tracks all these metrics for the upstream services consumed by your APIs.
Let’s take a look at a couple of examples of Prometheus queries.
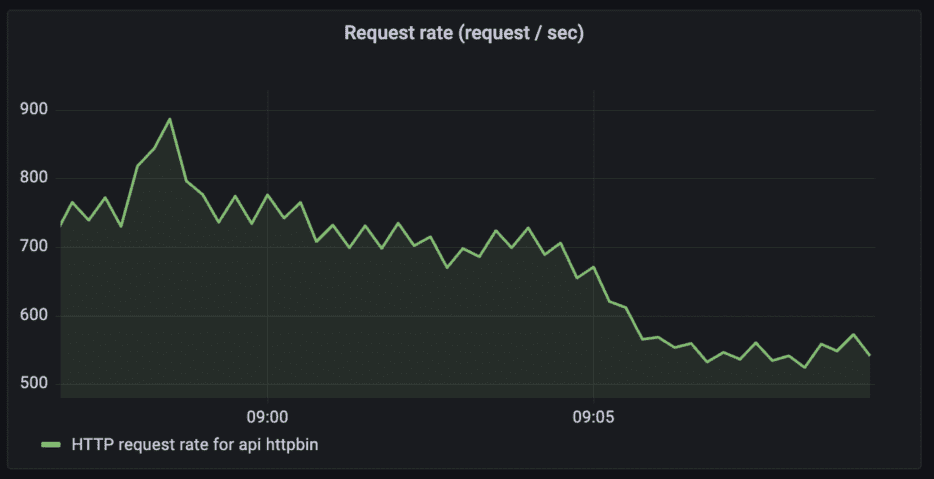
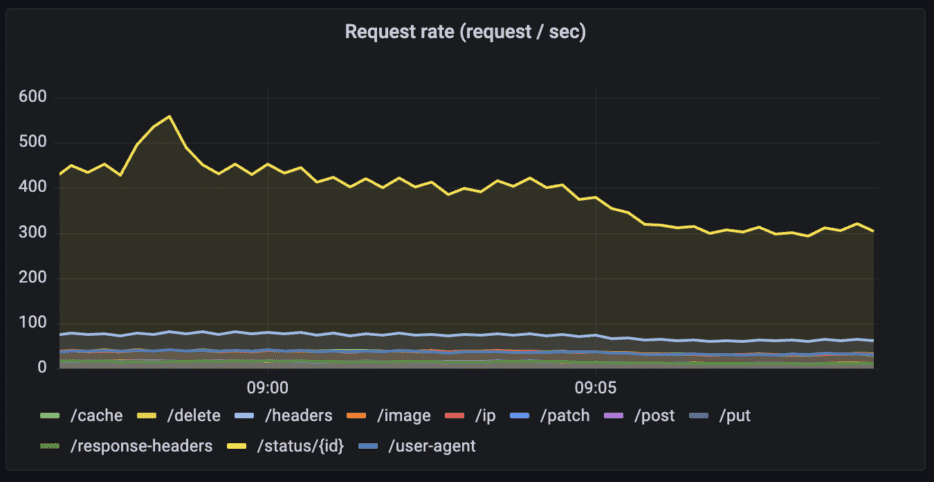
Request rates
The simple version would be to look at the request rates per API endpoint. But you could also go one step further and track the request rates per path, per HTTP method or even per API key.
HTTP request rates for the API “httpbin”
Query: sum (rate(tyk_http_requests_total{api_name="httpbin"}[1m]))
HTTP request rates for the API “httpbin” per path
Query: sum (rate(tyk_http_requests_total{api_name="httpbin"}[1m])) by (path)
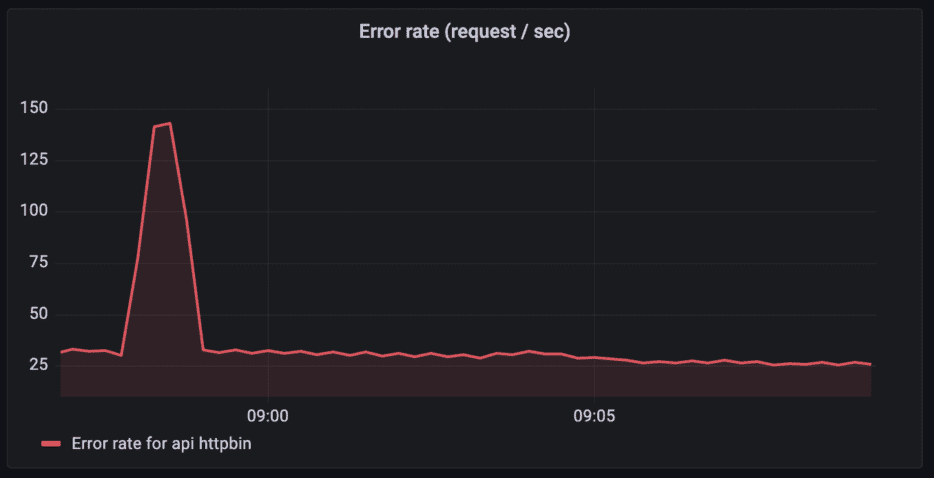
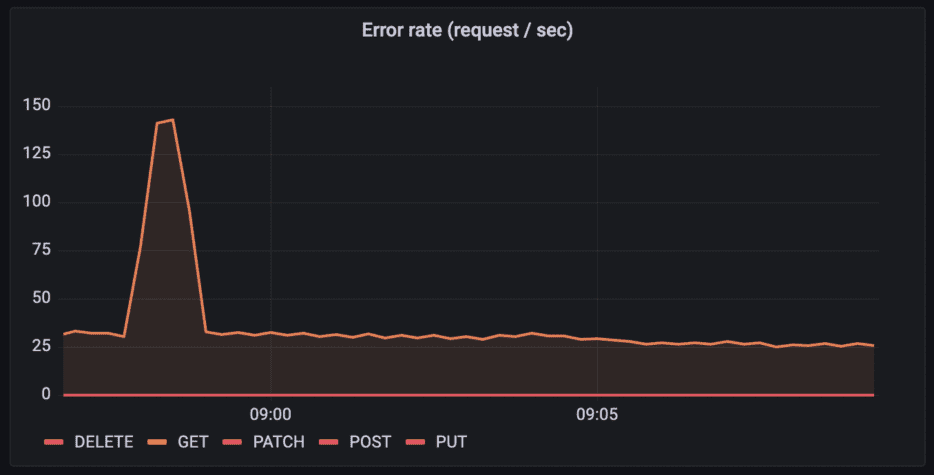
Error rate
For the error rate, we only look at the requests that returned an error (any HTTP status in 500–599 is considered an error). Like with the request rate, we can either look at it per API or track it per path, HTTP method, or API key.
Error rates for the API “httpbin”
Query: sum (rate(tyk_http_requests_total{api_name="httpbin",response_code=~"5[0-9]{2}"}[1m]))
HTTP request rates for the API “httpbin” per HTTP method
Query: sum (rate(tyk_http_requests_total{api_name="httpbin"}[1m])) by (path)
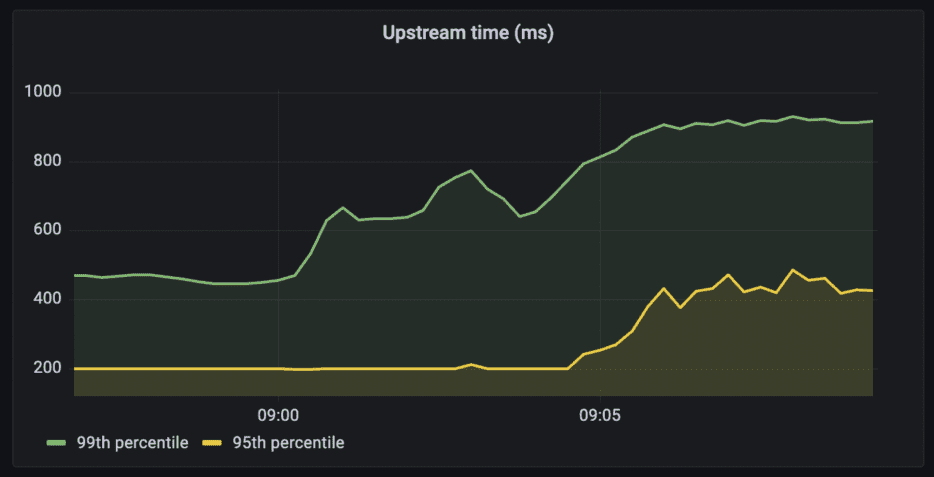
Duration
99th and 95th percentile of upstream time for the httpbin API
Query: histogram_quantile(0.99, sum(rate(tyk_http_latency_bucket{api_name=~"httpbin"}[1m])) by (le,api_name))
Setting SLOs and error budgets on successful HTTP requests
Now that we can track the indicators we care about, it’s time to define our SLOs.
To calculate the SLO and the displayed error budget remaining, I’m using the following definition:
- SLI: the proportion of successful HTTP requests, as measured from Tyk API Gateway.
- Any HTTP status other than 500–599 is considered successful.
- Count of http_requests which do not have a 5XX status code divided by the count of all http_requests
- SLO: 95% successful requests
I’m using a rule in Prometheus (slos.rules.yml) to offload the calculation of the SLI and the error budget. The remaining error budget for the 10-minute interval is 100% minus the percentage of errors per API.
| – record: job:slo_errors_per_request:ratio_rate10m | |
| expr: sum by (job,api_name) (rate(task:http_response_error_count[10m])) / sum by (job,api_name) (rate(task:http_response_total_count[10m])) | |
| – record: job:error_budget:remaining | |
| expr: (1 – job:slo_errors_per_request:ratio_rate10m) * 100 |
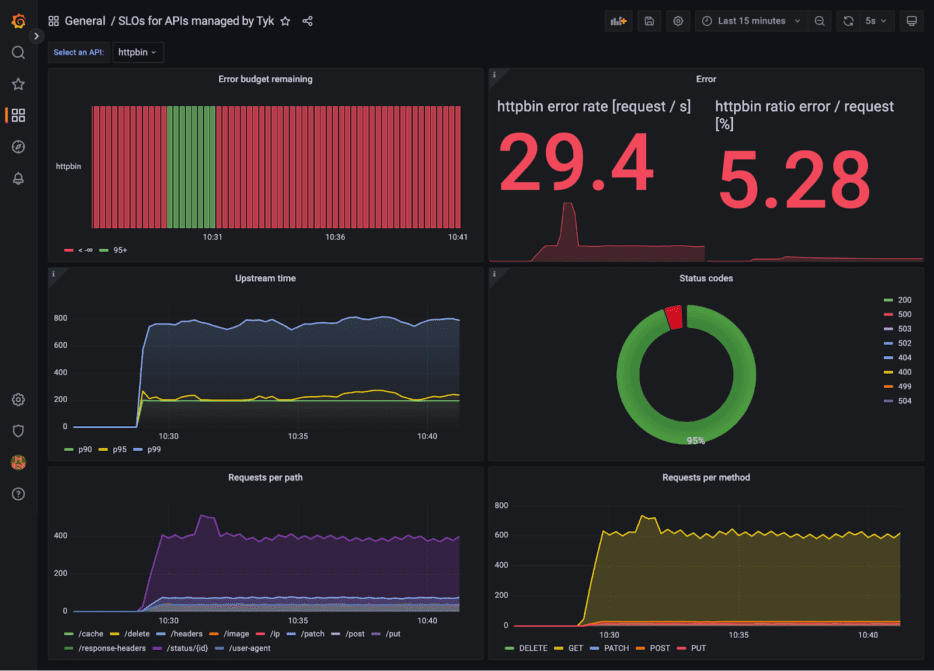
Putting it all together in Grafana
The result is a Grafana dashboard (SLOs-for-APIs-managed-by-Tyk.json) that I can use to monitor my upstream requests. Oops, time to fix those erroneous HTTP requests!
Try it out today
The whole demo is available on GitHub and runs within minutes.
I’m curious – do you use Prometheus and Grafana? How do you monitor your APIs and their upstream services? Do you use SLOs, SLIs and other best practices from the SRE world?
I’m looking forward to your feedback and questions on our community thread.