Businesses depend on APIs to connect systems and deliver high-quality user experiences. As APIs evolve, so do the demands placed upon them. Achieving optimal performance requires constant vigilance and efficient troubleshooting techniques.
Telemetry data generated at the API gateway level enables developers to capture critical data to monitor and troubleshoot their APIs. With observability tools like Grafana and Jaeger, distributed traces can help businesses optimise their performance and make informed decisions.
This article offers a comprehensive walkthrough for building an observability dashboard to monitor APIs using OpenTelemetry, Prometheus and Grafana and using Jaeger for troubleshooting.
Here’s what we’ll cover:
- Exporting distributed traces from Tyk Gateway
- Setting up the telemetry pipeline in the OpenTelemetry collector
- Building a Grafana dashboard to visualise key API metrics
- Troubleshooting API issues with Jaeger.
By the end, you’ll understand how to gain visibility into your complex API ecosystems’ performance, reliability and behaviour.
If you’re eager to dive right in, the entire stack can be started within minutes with Docker Compose via this GitHub project link: https://github.com/TykTechnologies/demo-api-observability-opentelemetry.
So, if you’re ready to take your API monitoring to the next level, let’s get started!
Exporting distributed traces from Tyk Gateway
To enable OpenTelemetry instrumentation in Tyk Gateway, configure the following environment variables:
- TYK_GW_OPENTELEMETRY_ENABLED=true

- TYK_GW_OPENTELEMETRY_EXPORTER=grpc

- TYK_GW_OPENTELEMETRY_ENDPOINT=otel-collector:4317
Every API call will generate spans (part of a distributed trace) and export them to a local OpenTelemetry Collector via port 4317 using the gRPC protocol. Refer to the complete Docker Compose file for implementation details.
Enabling detailed tracing at the API level (optional): Once OpenTelemetry is enabled at the gateway level, you can activate detailed tracing for specific APIs. This can be achieved by modifying the respective API definition and adjusting the detailed_tracing option to either true or false. By default, this setting is false.
Within my sample project, I’ve configured detailed tracing for every API definition:
"detailed_tracing": true,
You can explore Tyk Gateway’s OpenTelemetry suppoGateway’s Tyk documentation for further information.
Setting up the Telemetry pipeline in the OpenTelemetry collector
The OpenTelemetry collector is a component that enables you to define how to receive, process and export telemetry data. It also allows your services to offload data quickly, and the collector can take care of additional handling like retries, batching, encryption or even sensitive data filtering.
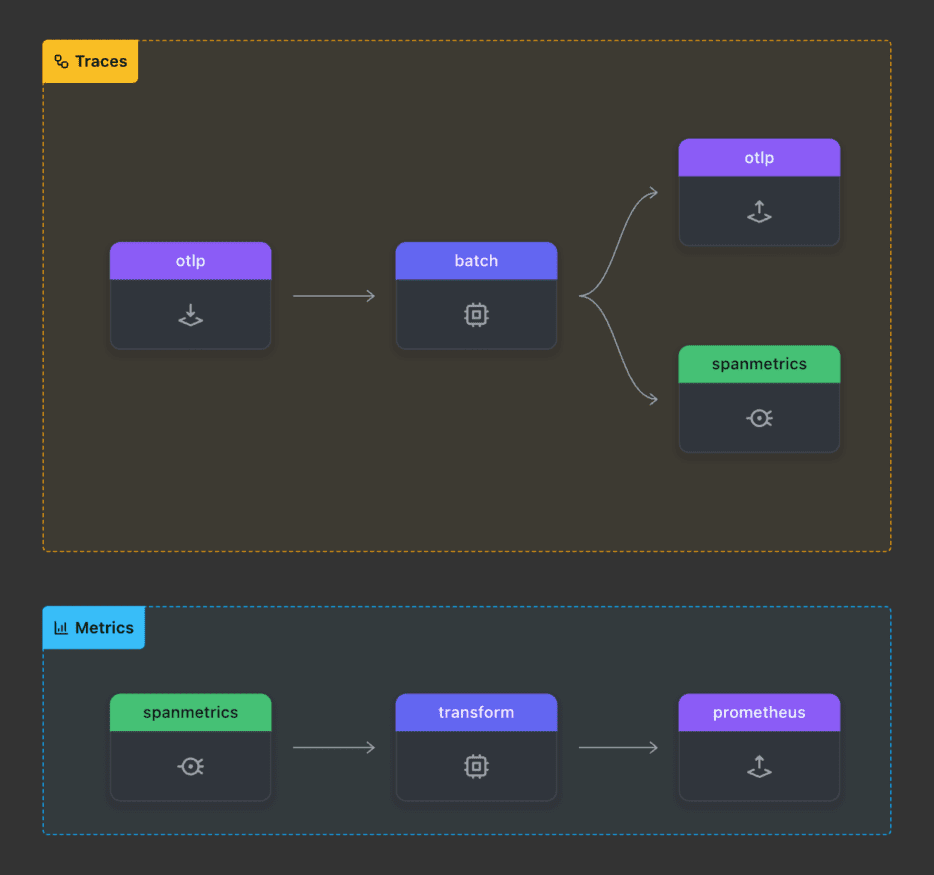
In this example, I’m setting two pipelines:
- Export spans to Jaeger
- Generate RED metrics (request, error and duration) from span data using the SpanMetrics Connector and expose them as a Prometheus metrics endpoint.
Here is the pipeline in a visual way, generated with OTelBin:
Check out the full yaml configuration for the OpenTelemetry collector here. Here are the essential parts of the SpanMetrics Processor:
connectors:

 spanmetrics:

   histogram:

     explicit:

       buckets: [100us, 1ms, 2ms, 6ms, 10ms, 100ms, 250ms]

   dimensions:

     - name: http.method

     - name: http.status_code
In this configuration:
- Request counts are calculated based on the number of spans observed per unique dimensions, encompassing errors. Duration is computed from the time difference between the spans’ start and end times, appropriately placed within the duration histogram’s time bucket for each unique set of dimensions.
- Each metric incorporates standard dimensions shared across all spans, including service.name, span.name, span.kind, and status.code.
- Additionally, we’ve introduced a few specific dimensions tailored to Tyk (tyk.api.name and tyk.gw.id), along with other dimensions like http.method, http.status_code, and service.version (the version of Tyk Gateway).
It’s important to note that augmenting the number of labels on metrics might result in high cardinality metrics, which requires careful management. You can learn more about managing high cardinality metrics in Prometheus and Kubernetes by referring to this resource: Managing high cardinality metrics in Prometheus and Kubernetes.
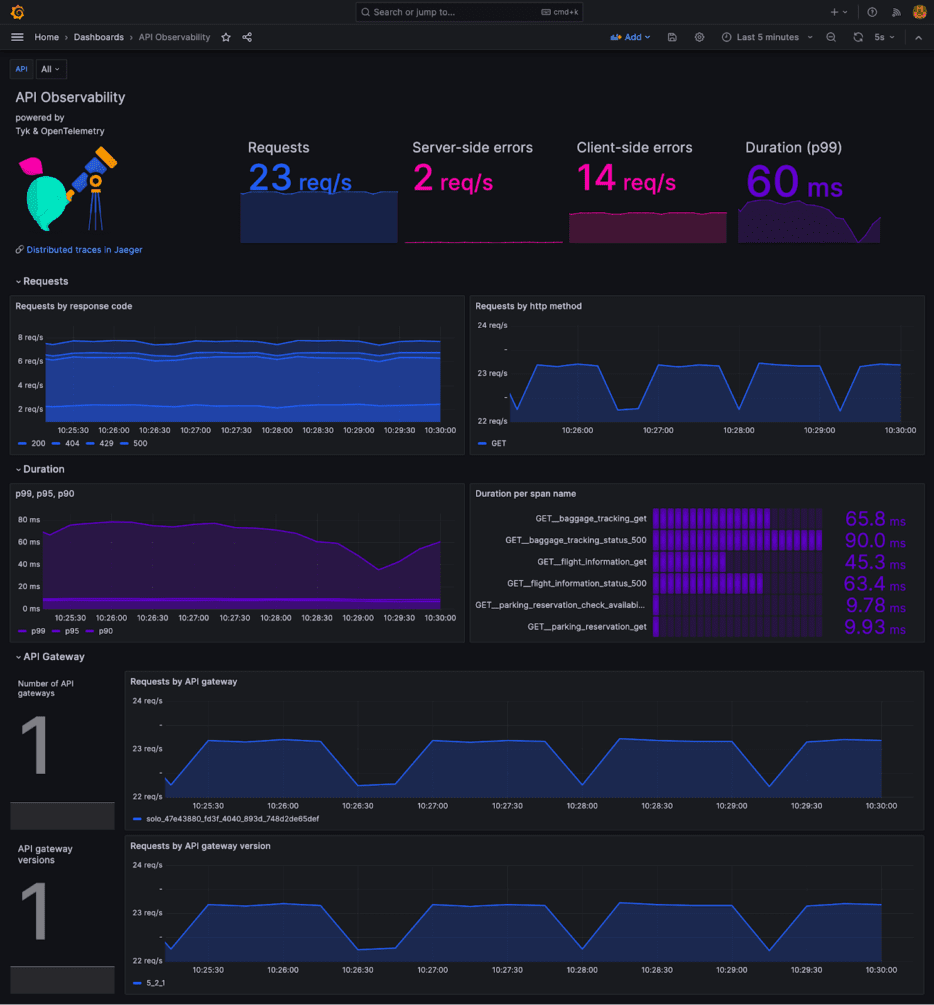
Building a Grafana dashboard to visualise key API metrics
This dashboard will help to detect latency spikes, errors and abnormal behaviours.
To start, configure Prometheus to scrape the Prometheus metrics endpoint from the OpenTelemetry Collector. Here’s is the configuration from prometheus.yaml:
global:

  scrape_interval:     5s

  evaluation_interval: 15s

scrape_configs:

- job_name: tyk-gateway

  static_configs:

  - targets:

    - 'otel-collector:9464'

- job_name: otel-collector

  static_configs:

  - targets:

    - 'otel-collector:8888'
Next, set up Prometheus as a data source for Grafana by configuring prometheus_ds.yml:
datasources:

- name: Prometheus

  access: proxy

  type: prometheus

  url: https://prometheus:9090

  isDefault: true
Now, let’s dive into the creative process of designing your Grafana Dashboard. There’s a plethora of helpful content available that can assist in crafting a comprehensive dashboard, such as Grafana documentation or this blog post on creating beautiful dashboards.
One incredibly valuable aspect for me was the ability to create variables for different APIs. This capability enabled me to filter data specific to one API or all APIs. You can explore the Grafana documentation on adding variables for APIs.
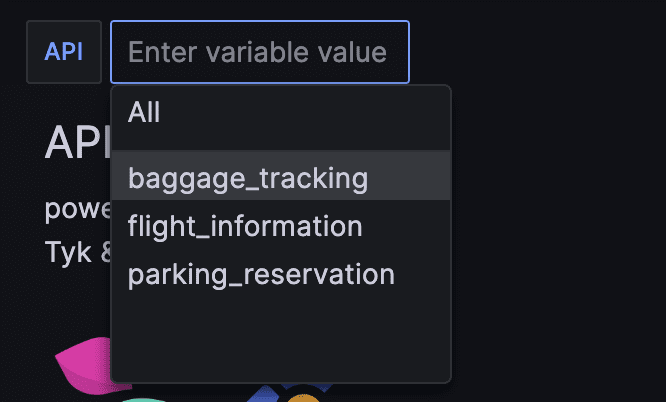
I’ve created a sample Dashboard that you can reuse and adapt to your needs (see API-observability.json):
You can use Alerting in Grafana to be alerted in case of latency spikes, errors and abnormal behaviours. Should an issue arise, troubleshooting with Jaeger can significantly assist in isolating and resolving API-related problems.
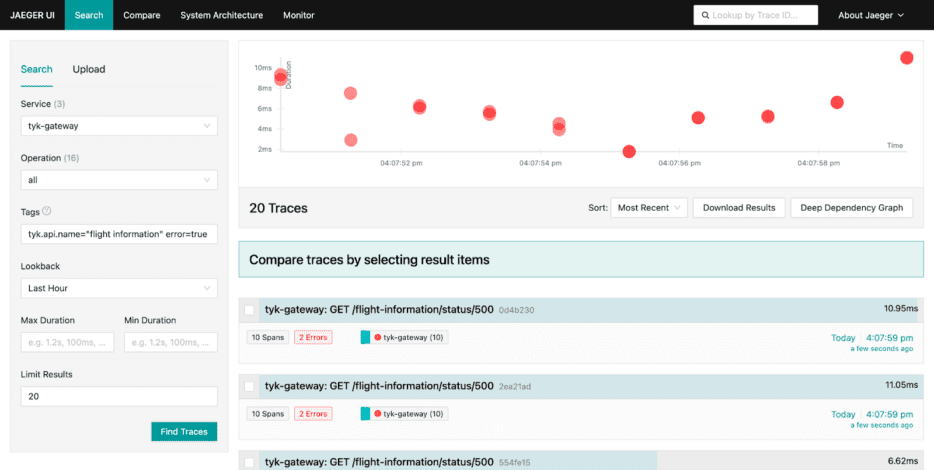
Troubleshooting API issues with Jaeger
Troubleshooting API issues with Jaeger is a straightforward process. Within Jaeger, filtering traces produced by Tyk Gateway (Service: tyk-gateway) becomes simple using specific tags. For instance, using tags like tyk.api.name=” flight information” and error=true allows you to isolate and examine all traces related to the ‘flight information’ API that encountered errors:
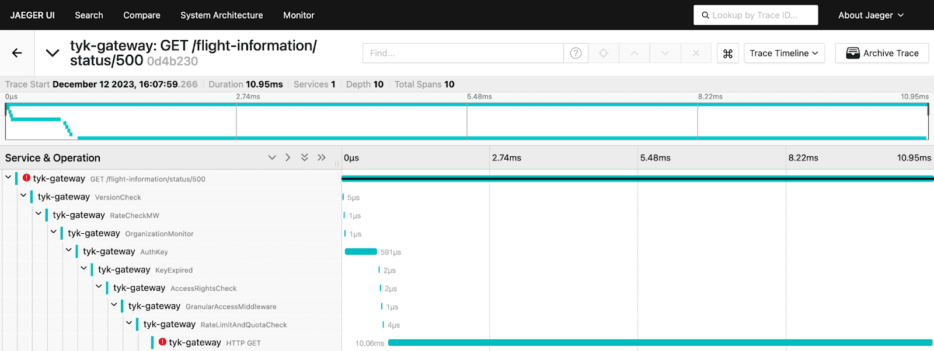
Upon clicking on one of these traces, it becomes evident that there’s an issue with the upstream service. The detailed trace provides essential information necessary for promptly identifying and addressing the problem:
The future of API performance
With Tyk, OpenTelemetry, Grafana, and Jaeger working together, developers can stay ahead of the curve and drive improvements in efficiency and reliability.
By embracing these technologies, companies can better navigate the ever-evolving world of APIs, ultimately leading to happier customers and better bottom lines. Get started with Tyk and OpenTelemetry today to keep your APIs observable and your users happy!