OpenTelemetry resources are invaluable in adding context to your telemetry data. They help you troubleshoot and triage faster, as Dash0 Product Manager Michele Mancioppi recently explained in conversation with Tyk.
We’ve compiled some of Michele’s key insights below, to walk you through what OTel resources are and how you can start benefiting from them.
Read on to learn:
- The importance of semantic conventions in giving your telemetry meaning
- How to add context to your metadata – and why
- The different levels at which you can add context to your telemetry
- The three main ways to add and manipulate resource attributes
You can read our top takeaways below or watch the full webinar via the link above.
The problem of telemetry without context
Telemetry, without context, is just data. To give that data meaning, and derive value from it, you need to step back and work out what you need to know. That means diving into:
- Semantics – understanding what traces, metrics and logs are
- Context – knowing where your data is coming from, which systems it describes and its relationship with other telemetry data (this last point is one we’ll address another day – we’re focusing below on which systems your data describes, where it’s run, by whom and why)
- Accuracy – being certain your data is accurate
- Inference – understanding what your data means so that you know when it shows problems and when it doesn’t
Understanding system context
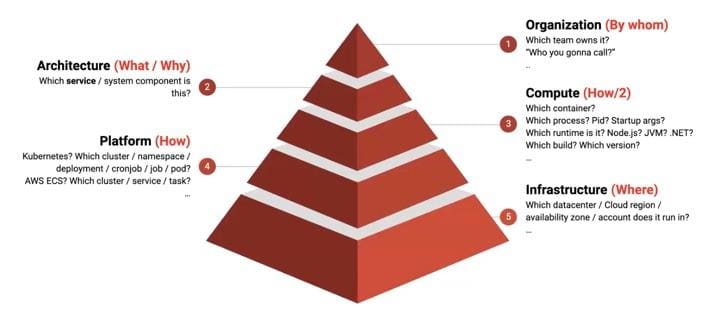
Thinking about system context starts with the where: where is the data – on which cloud, which account, which region, which datacenter?
Next comes the how: is it running on Kubernetes, on AWS ECS, on a naked virtual machine? Taking that further means thinking about the compute aspect. Is it a containerized process, a managed service… what is the process ID, which runtime is it in and which version of the runtime?
Questions then need to focus on the what/why, with a look at the architecture: which logical component is it? Perhaps the frontend of your checkout service. Perhaps something else entirely.
Finally, understanding context means thinking about the who: which team runs the component, who’s responsible for it not going down and who are you going to call when there’s a problem.
The challenge of metadata drift
Delving into system context is not without its challenges. One of these stems from people, as the larger an organisation grows, the more challenging it becomes for teams to understand each other in a way that ensures everything works properly and consistently.
This brings us onto the subject of metadata drift…
You likely use different collection methods for your metrics, logs, traces and spans. Maybe you’ve got some coming from OpenTelemetry and others from Prometheus endpoints exposed by your Kubernetes cluster or by managed services such as AWS S3. Maybe you’re importing data from CloudWatch. For your logs, may you have Fluentd running on your Kubernetes cluster, which is sending a completely different set of metadata to the backend. Added to this is the fact that, even for the simplest things, there’s always the risk of using different names for the same concept and creating labels and formatting values differently.
This can be a very serious problem, because organizations often store different types of signals in different, unrelated databases. When you’re troubleshooting and triaging, you seldom get to the bottom of things by looking at just one type of data. You may start with traces and end up looking at logs, for example.
Investigations tend to be both dynamic and multi-faceted, so if you don’t have common metadata, particularly in relation to which system its coming from, then effectively all you have in common are timestamps. And that’s assuming timestamps are all in the same time zone and you don’t have any clock skews! Hardly the ideal basis for finding out which logs match which spiking metrics. (Top tip: ensure your timestamps are always in UTC, no matter where they are!)
Trying to search data across different databases without a common metadata language for filtering isn’t fun. It can add considerable amounts of time to how long it takes you to understand what and where an issue is. Thankfully, there is an answer…
Hello, OpenTelemetry!
OpenTelemetry (OTel) is now the de factor standard for distributed tracing. It is the second largest CNCF Foundation project (after Kubernetes), born of the merging of the OpenTracing and OpenCensus observability projects.
OTel is achieving good interoperability with Prometheus and most log agents can send data to an OpenTelemetry backend.
One of many helpful OTel features is its semantic conventions. These provide a shared dictionary of names that you can use to describe your systems, with conventions covering traces, metrics and logs. There are also resource semantic conventions, which cover the common ground between these.
OTel’s semantic conventions map to four of the five context layers we considered above, as shown here:
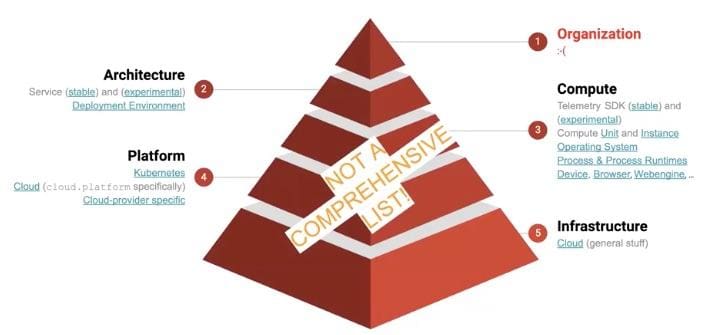
What OpenTelemetry doesn’t have is semantic conventions to describe how the components are spread across your organization. However, you can reuse what you’re already doing for this – for example, with your AWS tags in terms of cost center and team.
Understanding OpenTelemetry resources
You can use these semantic conventions to add context to OpenTelemetry instrumented applications. This is where resources come in.
What is an OTel resource? It is a set of key value pairs that are describing the system that is providing you with telemetry. According to the OpenTelemetry website:
“A resource represents the entity producing telemetry as resource attributes. For example, a process producing telemetry that is running in a container on Kubernetes has a process name, a pod name, a namespace, and possibly a deployment name. All four of these attributes can be included in the resource.”
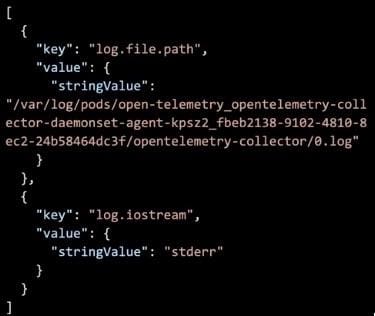
In a log record, OpenTelemetry resources will look something like this:
Metadata in OpenTelemetry is at multiple levels, so you can have metadata at the level of:
- Spans and events on the spans – kind of like logs directly associated with a span
- Span links – pointers to spans in another trace – very handy for messaging applications
- Metric data points – where, for example, you could specify the unit of measurement
- Log records – for example, if a log was emitted over a standard error or standard output, or from which file it originated
- Scopes – related to things you can find in terms of instrumentation and traces (highly technical)
- Resources – probably the best way to have metadata about your system
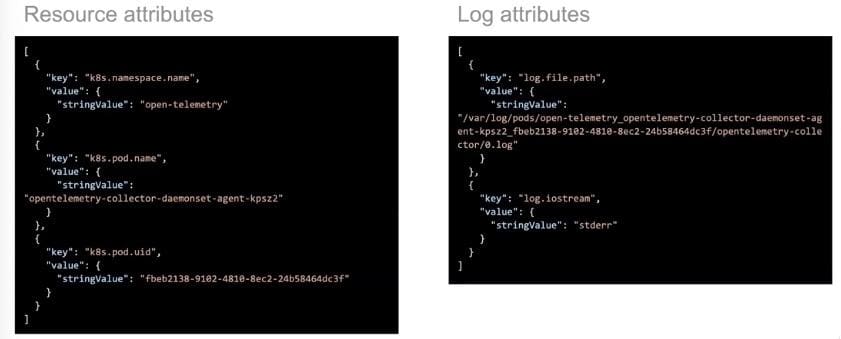
The context that resources provide can clearly be seen when we compare them to log records:
How to improve resource metadata in your telemetry
There are three main ways in which you can add and manipulate resource attributes.
First, you have the data being collected by your instrumented application. Here you can use manual hard coding in your application initialization or a concept called a resource detector.
Secondly, you can configure additional resource attributes and other settings in the process environment (and soon by configuration file format).
Your third option is to use the OpenTelemetry Collector to add and remove phases, improve, standardize and normalize your resource metadata in flight. This is a great help if you can’t modify an application or the data you need isn’t feasible in that application.
These methods are not mutually exclusive, so you can mix and match to suit your purposes.
OpenTelemetry resource detectors and hard coding
When you want to embed resource attributes, to have them in the telemetry your application produces, you can either code it (effectively creating it with a variety) or use resource detectors. These enable you to customize for the kind of environment you expect your application to run in. This is the best way to make sure you have as much metadata as possible in terms of resources.
If you work with a version of OTel that a vendor has customized, they are likely to have done a lot of the initialization of resource detectors for you.
Configuring additional resource attributes via environment variables
You can use environment variables to configure additional resource attributes. There’s a great example of this in the OTel Demo Helm chart, where you can see how the deployment is sending fundamental attributes like service name and namespace.
Manipulating telemetry metadata in transit
Using the OpenTelemetry Collector is probably the most powerful method of improving your resource metadata.
Your application sends telemetry to the collector. The collector takes the telemetry, patches it, samples it, aggregates it, modifies it and sends it downstream to your observability backend. That’s where you can enrich, normalize and improve your resource attributes.
You can use a range of processors to manipulate your resource attributes. Examples include the k8attributesprocessor, attributesprocessor, transformprocessor, resourcedetectionprocessor and schemaprocessor. As an example of what you can achieve, the k8attributesprocessor looks for the Kubernetes pod ID, then uses that to correlate with what’s coming from that pod. This means you can add metadata about the namespace, deployment, replica set and more.
There’s a lot you can do manually, too. You can drop metadata directly in the processor, for example, or sample some of it. Powerful stuff.
Also helpful is the continued evolution of semantic conventions. The Elastic Common Schema, for example, which is a set of semantic conventions created by Elastic, is providing additional standardization. As semantic conventions evolve, some attributes change over time. The OpenTelemetry Collector can translate data from older formats into new ones, delivering the resource attribute consistency you need without you having to modify the code of your deployed applications.
Potential challenges
While there are many powerful benefits to using OTel resources, bear in mind that not all tools are equally good at dealing with a lot of metadata in an application. You’ll also need to think about storage costs and querying costs, particularly if the database you have isn’t columnar or your index sync isn’t capable of looking up.
There’s some overhead in terms of transmission to consider, too. That said, the way that data is formatted with the OTel protocol, you effectively usually have an attribute set only once, rather than for every span or log. As such, the overhead should be comparatively little.
You’ll also need to think about this from a security perspective. If you have user IDs or account IDs in the path of an HTTP API, the span representing the fact that you’re saving a specific request may contain attributes – it may contain data about which user is doing that. You may see that data in custom HTTP headers, too. Logs are the worst offender for this.
Making the case for automation
There is a strong argument in favor of automating the collection of telemetry and of centralizing the management and normalization of metadata. Doing so comes with a cost, as engineers suddenly need to be experts in observability and know how to create spans that look good, as well as the business logic of their applications. Yet there is also much to gain, as heaving automation in the collection of telemetry can make it much simpler to have consistent metadata. That’s because the same agent or instrumentation is going to produce similar and comparable metadata, irrespective of which team has deployed.
Conclusions
The better the metadata related to your telemetry, the more useful that telemetry is. Remember, without context, telemetry is just data. You need to know where that data is coming from and which systems it is about. That’s why OpenTelemetry resources are so important.
OTel semantic conventions, meanwhile, introduce standardization that combats inconsistencies, while resource detectors and the OpenTelemetry Collector can help even more.
While we’re deep in the topic of what you can achieve with OpenTelemetry and how, why not take a look at how to integrate OTel with Tyk Gateway?