How often do you automatically check your service, system or site? If the question makes you vaguely uneasy, then this article is for you! Nočnica Mellifera, Senior Developer Advocate at Checkly, has been talking to Tyk about how often you should check your site and how to do so.
We’ve rounded up key insights below that can help you level up your checking approach. In this blog, you will learn:
- How the cost of downtime weighs up against the cost of monitoring
- Why it’s crucial to build checks into your SLA
- How to calculate the right cadence for your checks and defend your SLA
You can watch the full webinar video via the link above to see Nočnica’s presentation or read on for our top takeaways.
How often should you automatically check your site?
We all send pings to our sites and services from time to time, but how often do you automatically check things? Over the past few months, Nočnica has been chatting to industry folk about what tools they’re using for monitoring and why, what cadences they set and more. The responses have revealed some pretty interesting information…
Diagnosing downtime
What’s the first thing you do when there’s a hint that your site or service might be down? People approach this in a range of ways, from diving into the application logs to going and checking the site directly – and everything in between (including a wide range of automated tools and services). This is the first section of time to resolution and the fact that everyone approaches it differently shows that there isn’t a perfect answer to knowing whether or not a service is available.
There are three important ideas to bear in mind when thinking about downtime:
- Uptime matters. At the simplest level, when you’re not up, you can’t make money.
- How you find out matters. If it’s your users who usually alert you to downtime, you’re developing a reputation for unreliability.
- Users won’t keep downtime a secret. Many users will report your downtime on Twitter before opening a ticket – or even instead of it.
The costs of downtime versus the costs of monitoring
Downtime has a cost but so does chasing the goal of zero downtime. Yes, zero downtime would be lovely, of course it would. But chasing that as your goal is a slippery slope to slower delivery of changes – or even to no changes at all. It’s a fast-track route to stifling innovation and never addressing performance problems, scalability problems or anything else. It’s a failure state.
Yet downtime can be costly. Very costly. So how do you balance that against the cost of monitoring? And should you set the tools you use to monitor your service, and to check if it’s up or down, to the absolute max?
Let’s consider the costs. Say you have a basic, uncomplicated, 16-page website selling novelty shoes that’s available in four regions and you decide to check it every four minutes. Now, these checks are just the first stage of identifying and resolving a problem. So, it could be four whole minutes before you realize something is wrong.
Even with that four-minute checking cadence, you’re looking at 709,120 pings per month. Based on the Datadog rate of $12 per 1,000 pings, that’s going to cost you $8,509. That’s quite a price for checking a basic site.
Facing costs like this, you’ll likely be asking how long you are happy to wait before you know your site is down. Ten minutes? 20? 30? It’s a question of balancing your monitoring costs against the cost of downtime, which is something you have to consider in relation to automated monitoring.
As well as figuring out the right cadence with which to monitor your site, it’s important to thaink about which tools to use. There are some very simple, automated monitors out there that can deliver pretty good results – little node apps, for example, that just go ahead and reach out automatically. But those tools come with their own costs in terms of maintenance and running, even though what they do is more limited.
Then there’s geo-monitoring to consider. If you frequently experience failures in just one geographic area, you need to spread out your tests to account for that. But you’ll still need to monitor all regions, because you can generally expect that things will happen that will take your site or service down in a single region. Perhaps parallel checks might suit you better than round robin checks, if you frequently experience single geo problems.
If you choose to set up monitoring an API, which sends a simple curl request, you can expect to bring down your costs. Let’s say you have 32 endpoints, four different inputs for each and four regions. Checking every two minutes will mean 11,059,200 pings per month. At the Datadog rate of $5 per 10,000 API checks, $5,529. Still quite the price to monitor a basic API.
The point is that this kind of relatively uncomplicated monitoring – just loading the page, checking for 200 and checking a couple of values – still comes with a cost. And it doesn’t take account of the fact that 200 is not always ok.
Building checks into your service level agreements
In defining your service level agreement (SLA), you need to think about how long you can afford your site or service to be down. There are plenty of site reliability engineer (SRE) luminaries who have a lot to say on this subject, from Hazel Weakly to DORA.
In terms of negotiating an SLA for your organization, the target cadence for your monitoring should be part of the conversation around what is and isn’t possible. Targets will differ across contractual versus more dynamic SLAs where you can set different cadences for different components of your services. For example, if you provide a music streaming service, and you have a social feed letting users know what their friends are listening to, you might be happy for that component to have a lower SLA.
While it’s important not to get stuck in a ‘zero downtime’ way of thinking, many organizations are drawn to maximum frequency when it comes to checking their sites and services. And there’s nothing wrong with that. After all, if you’ve got multiple enterprise partners, you’re probably going to want to know that a 200 OK comes back every minute or so. But you also need to think about more in-depth checks and the cadence for those.
How to check your site
When it comes to checking your sites and services, it’s time to think about heartbeats versus synthetics versus end-to-end testing.
Back in the day, synthetic checks were called ‘pingers’ and were an oft-overlooked part of monitoring. In those days, a basic monitor just checked for a 200 status, and a more advanced one could do string matching. Clever SREs configured their pingers to match text that loaded last on a page, giving them some insight into how the site was performing.
If you’re new to testing, let us just put in a quick plug for Playwright. It’s free, open source – which Tyk loves – and a powerful contender in the industry right now. Playwright has grown alongside demand for increasingly complex requirements to simulate actions with a service. Whether you want to do things like clicking on a log-in button, logging into a site, receiving a response back, checking something is present in the response, parsing it with regex or node-based parsing to find components and more, Playwright can help. Its level of sophistication means that it can certainly stand in for end-to-end tests, with well-written scripts with good locators remaining stable for years and finding pretty deep system problems.
It’s fair to say that the line between testing and monitoring has blurred a little. The in-depth checks you can run every minute or few minutes with tools such as Playwright and Checkly will certainly be familiar to those in testing land as monitoring.
Visual regression testing is a good example of this blurring. Do you only need to run visual regression tests when releasing new code? Not anymore. Consider how many third-party dependencies we now have. Your marketing team can drop arbitrary code into the header of your page at any time, for example. So, it makes a lot of sense to be checking every 15 or 20 minutes that nothing has changed visually.
Calculating the right cadence
Calculating the right cadence is all about SLA math. You’ll need to know your SLA compliance, meant time to resolution and your average number of incidents per month.
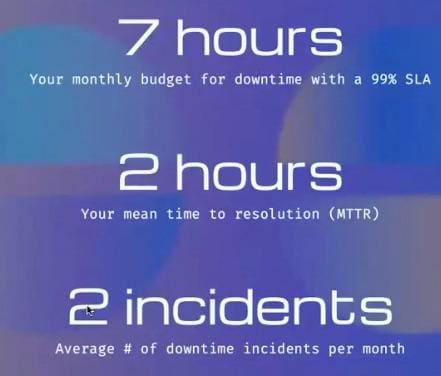
Let’s say you have a monthly downtime budget of seven hours with a 99% SLA and a mean time to resolution (MTTR) of two hours, with an average of two incidents per month. That means you’ve got 90 minutes to detect each incident – that’s the longest downtime can go undetected. As such, 90 minutes is probably a good cadence for running a really in-depth set of checks, to confirm that the service is completely working.
Tweak the example a little and you’ll see how quickly the cadence needs to change. Let’s say you have four incidents per month, with the same monthly budget of seven hours for downtime and an MTTR of two hours.
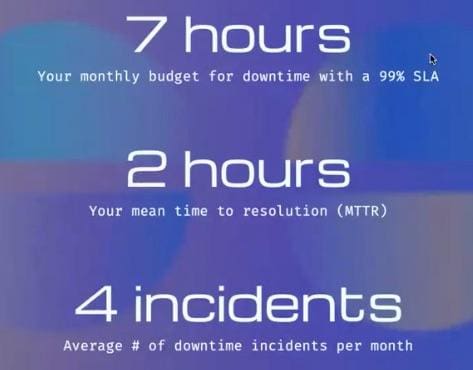
In this new scenario, you now have just 15 minutes to detect each incident – and that’s from the problem occurring, to the problem being detected by the test service to a human being becoming aware of it. As such, 15 minutes might not be your pinger rate. You might need to go a little above that, particularly if you’re using a round robin system of notifications and it might take a while for things to be acknowledged (though you could potentially factor that into your MTTR calculation).
What if the costs are too high once you’ve calculated your cadence? This bit of wisdom from user u/chckno on Reddit sums it up nicely:
“If that calculation results in an unreasonably high cost, you’ll need to do something else, like build a more economical way to get a health signal, improve MTTR (e.g. maybe you need to be able to deploy rollbacks faster) or renegotiate the SLA.”
Remember, if you check at a rate that doesn’t defend your SLA, you’re planning to fail; you need to monitor at the right rate to find problems before you violate the SLA.
Further reading
Now you’re ready to calculate the perfect cadence for checking your site or service, how about switching your attention to improving your telemetry data for better observability? Our recent blog post reveals all you need to know.