
Performance gets brought up a lot in GraphQL. Developers want to know how Tyk fares up in performance against Apollo.
We set out to answer that question, and thus, an open source repository was born. We’re going to use it in this article to do generic Tyk vs Apollo testing, but there are other performance tests in there that we can run OOTB.
This article is simply following the above repo and presenting the information in an easy-to-read manner, but of course, feel free to run the above repo yourself.
Want help?
- Reach out to us and we’d be happy to help with your PoC.
- Or, read more about Tyk’s Universal Data Graph, and why we think it’s going to change the world of APIs.
The business use case
Imagine we’re building a Twitter profile page, and we have 3 back-end REST services that provide the data to complete this page.
The backend APIs are implemented as REST APIs & endpoints:
- Users
This API provides data about a particular user.
- Posts
This API provides posts belonging to a user, given a user ID
- Comments
This API provides comments belonging to posts, given a post ID
The traditional approach is to build a UI that consumes these 3 APIs. Instead, we’re going to take advantage of GraphQL and combine these into a single GraphQL API for our front-end application.
Then, we can send a single GraphQL API which retrieves ALL the information we need to populate the user’s landing page, containing the user’s information, all the posts they’ve written, and all the comments that belong to each post.
The setup
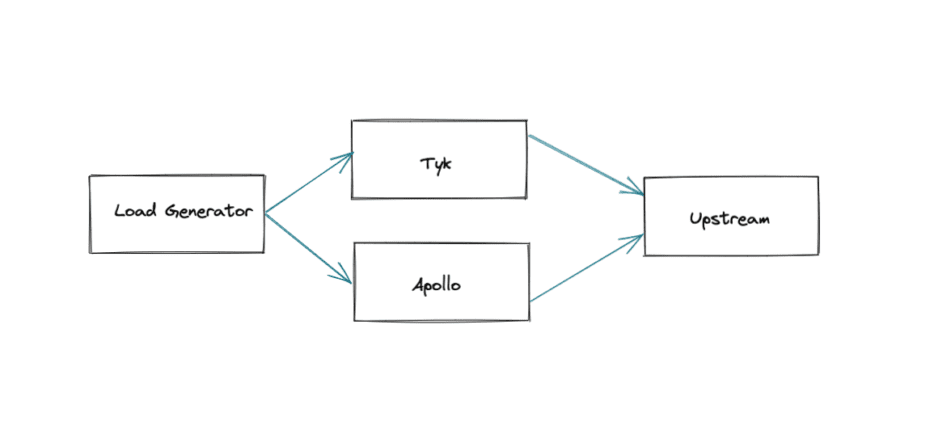
Following the repo linked above, we will use Ansible to install & deploy software across 4 EC2 machines.
$ sudo ansible-playbook playbook.yml -t install -t standup
In this article we’re using c4.2xlarge machines.
Now, we’re ready to run the “test” playbook to generate load against Tyk and Apollo.
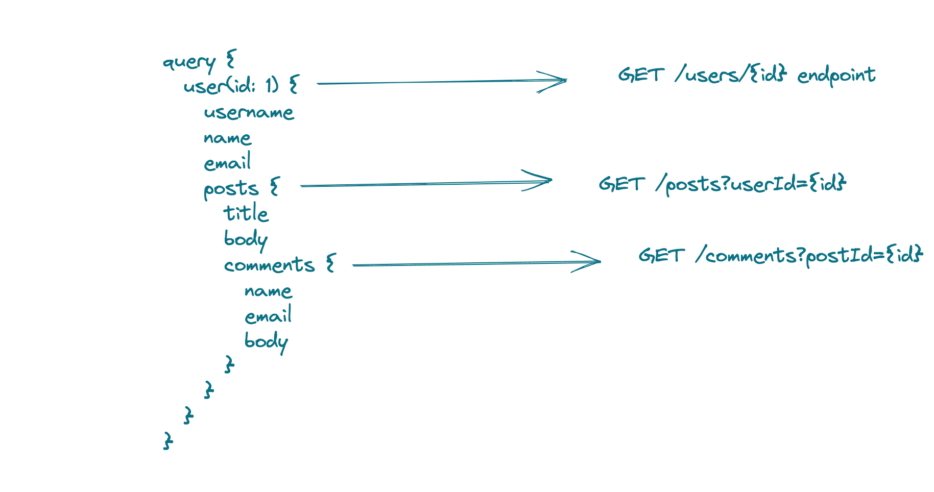
In the tests.yml file, we can see the various queries that the load generator will send:
query_type: STITCH

query_depth: 2

limit_cores: False

enable_auth: False

enable_analytics: False

enable_quota: False

enable_rate_limiting: False

graphql_query:

 0: "query { user(id: 1) { username name email }}"

 1: "query { user(id: 1) { username name email posts { title body }}}"

 2: "query { user(id: 1) { username name email posts { title body comments { name email body }}}}"
We can see there are 3 queries of various depths. Each depth adds a new REST resource from which our GraphQL server will use to gather data.
All 3 of the REST resources are deployed onto a single “upstream” host.
Tyk Implementation
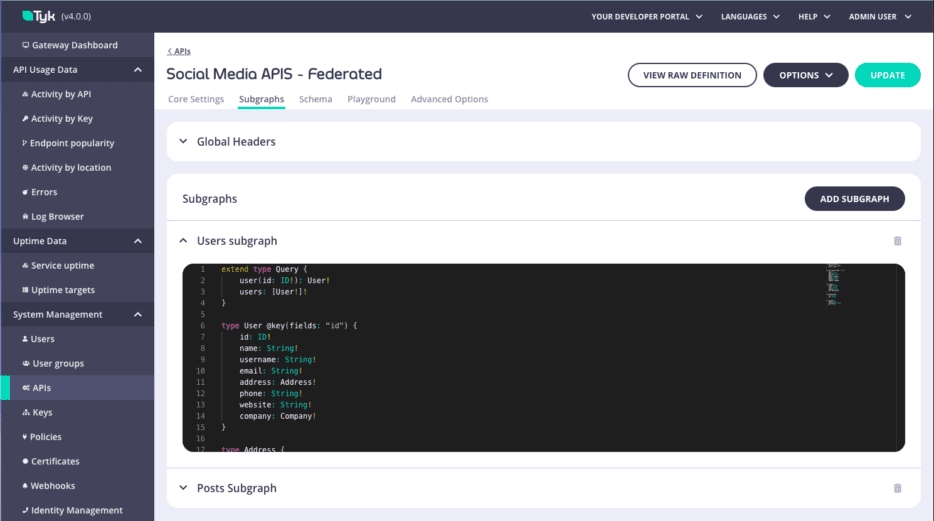
We’re going to use Tyk’s Universal Data Graph product to combine the 3 REST APIs into a single GraphQL API. Tyk uses a no-code approach, which you can read about here.
Here’s the API definition that contains this logic. Essentially, we define each of the upstream APIs in JSON.
In a licensed Tyk install, we can use the Dashboard UI to generate a supergraph easily:
Apollo Implementation
Apollo’s implementation requires us to create resolvers and implement how to fetch the data:
{% if query_type == 'STITCH' %}

class SocialMediaAPI extends RESTDataSource {

 constructor() {

   super()

   this.baseURL = "https://{{ upstream_host }}:{{ upstream.service.port }}/"

 }


 // Fetch user infomation.

 async getUser(id) {

   return await this.get(`users/${id}`)

 }


 // Fetch posts infomation.

 async getPosts(id) {

   return await this.get(`users/${id}/posts`)

 }


 // Fetch comments infomation.

 async getComments(id) {

   return await this.get(`posts/${id}/comments`)

 }

}


const resolvers = {

 Query: {

   user: async (parent, { id }, { dataSources }) =>

     dataSources.api.getUser(id),

 },

 User: {

   posts: async (parent, args, { dataSources }) =>

     dataSources.api.getPosts(parent.id),

 },

 Post: {

   comments: async (parent, args, { dataSources }) =>

     dataSources.api.getComments(parent.id),

 }

}
Results
We can now send the same query to both Tyk and Apollo, from the same load generator, to the same upstream services, in order to compare the two implementations evenly.
Query Depth 0
At query depth 0, we are sending a GraphQL query to simple return details from the User service.
$ sudo ansible-playbook playbook.yml -t test -e ‘{“query_type”: “STITCH”, “query_depth”: 0}’
The benchmarking output will be the two files in the “benchmarks” folder. The load generator we use, open source “Z”, provides various statistics such as the RPS and the P99.
If you didn’t run the tests yourself, here’s what I got:
Apollo
Summary:

Total: 10.0117 secs

Slowest: 0.1171 secs

Fastest: 0.0040 secs

Average: 0.0128 secs

Requests/sec: 3913.6340


Total data: 3487198 bytes

Size/request: 89 bytes

Response time histogram:

0.004 [1] |

0.015 [30601] |■■■■■■■■■■■■■■■■■■■■■■■■■■■■■■■■■■■■■■■■

0.027 [7018] |■■■■■■■■■

0.038 [1153] |■■

0.049 [233] |

0.061 [105] |

0.072 [46] |

0.083 [20] |

0.095 [1] |

0.106 [2] |

0.117 [2] |


Latency distribution:

10% in 0.0073 secs

25% in 0.0090 secs

50% in 0.0108 secs

75% in 0.0142 secs

90% in 0.0205 secs

95% in 0.0250 secs

99% in 0.0383 secs

Details (average, fastest, slowest):

DNS+dialup: 0.0000 secs, 0.0040 secs, 0.1171 secs

DNS-lookup: 0.0000 secs, 0.0000 secs, 0.0000 secs

req write: 0.0000 secs, 0.0000 secs, 0.0012 secs

resp wait: 0.0127 secs, 0.0026 secs, 0.1171 secs

resp read: 0.0000 secs, 0.0000 secs, 0.0008 secs

Status code distribution:

  [200] 39182 responses
Tyk
Summary:

Total: 10.0035 secs

Slowest: 0.0389 secs

Fastest: 0.0008 secs

Average: 0.0044 secs

Requests/sec: 11320.8229


Total data: 9965824 bytes

Size/request: 88 bytes


Response time histogram:

0.001 [1] |

0.005 [72401] |■■■■■■■■■■■■■■■■■■■■■■■■■■■■■■■■■■■■■■■■

0.008 [31983] |■■■■■■■■■■■■■■■■■■

0.012 [6908] |■■■■

0.016 [1515] |■

0.020 [354] |

0.024 [66] |

0.027 [8] |

0.031 [6] |

0.035 [3] |

0.039 [3] |

Latency distribution:

10% in 0.0018 secs

25% in 0.0025 secs

50% in 0.0038 secs

75% in 0.0056 secs

90% in 0.0078 secs

95% in 0.0096 secs

99% in 0.0137 secs

Details (average, fastest, slowest):

DNS+dialup: 0.0000 secs, 0.0008 secs, 0.0389 secs

DNS-lookup: 0.0000 secs, 0.0000 secs, 0.0000 secs

req write: 0.0000 secs, 0.0000 secs, 0.0011 secs

resp wait: 0.0043 secs, 0.0008 secs, 0.0389 secs

resp read: 0.0000 secs, 0.0000 secs, 0.0016 secs

Status code distribution:

  [200] 113248 responses
Really, results
Tyk processed 11,320 requests per second (RPS), versus Apollo’s 3,913 RPS. The GraphQL query, hardware, and upstream services were identical. What accounts for the large discrepancy? Tyk’s GraphQL implementation uses a very powerful open source Golang library. Apollo’s implementation is written in Nodejs. There’s a reason Kubernetes and Docker were also written in Golang.
In order for us to test it at a deeper level, i.e. consuming more REST services, we can change the value we pass to the “query_depth” field in the Ansible script:
$ tyk-ansible-performance-testing git:(main) ✗ sudo ansible-playbook playbook.yml -t test -e ‘{“query_type”: “STITCH”, “query_depth”: 1}’
Let’s skip ahead a little bit:
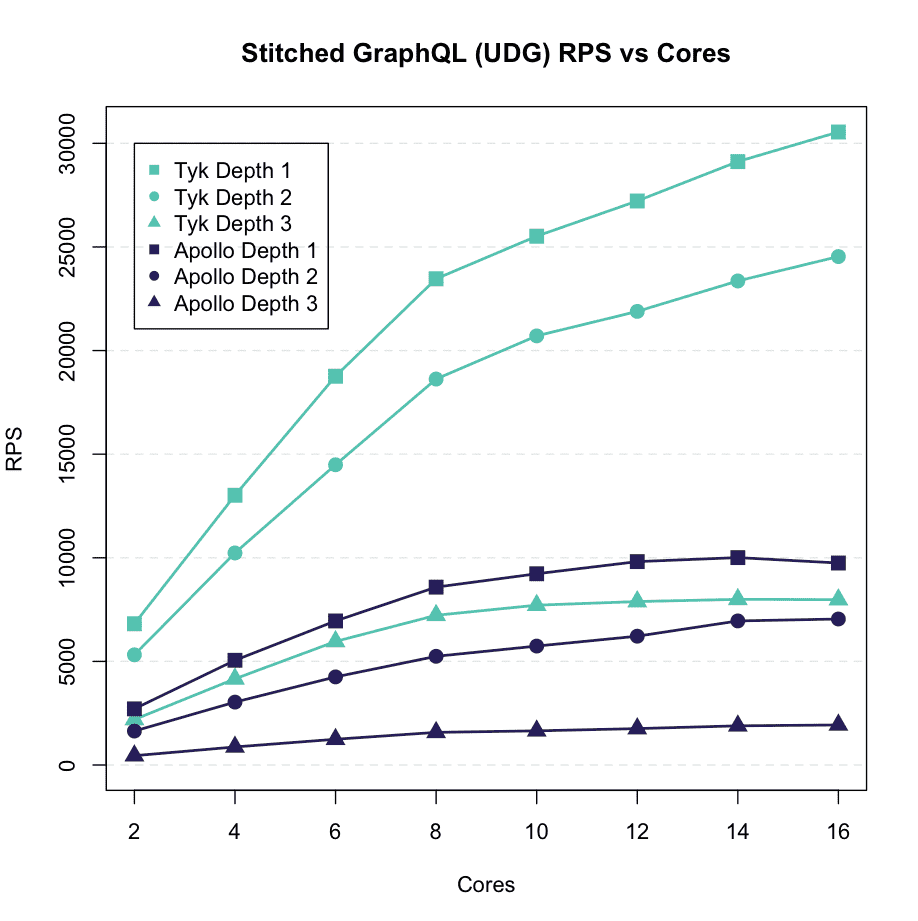
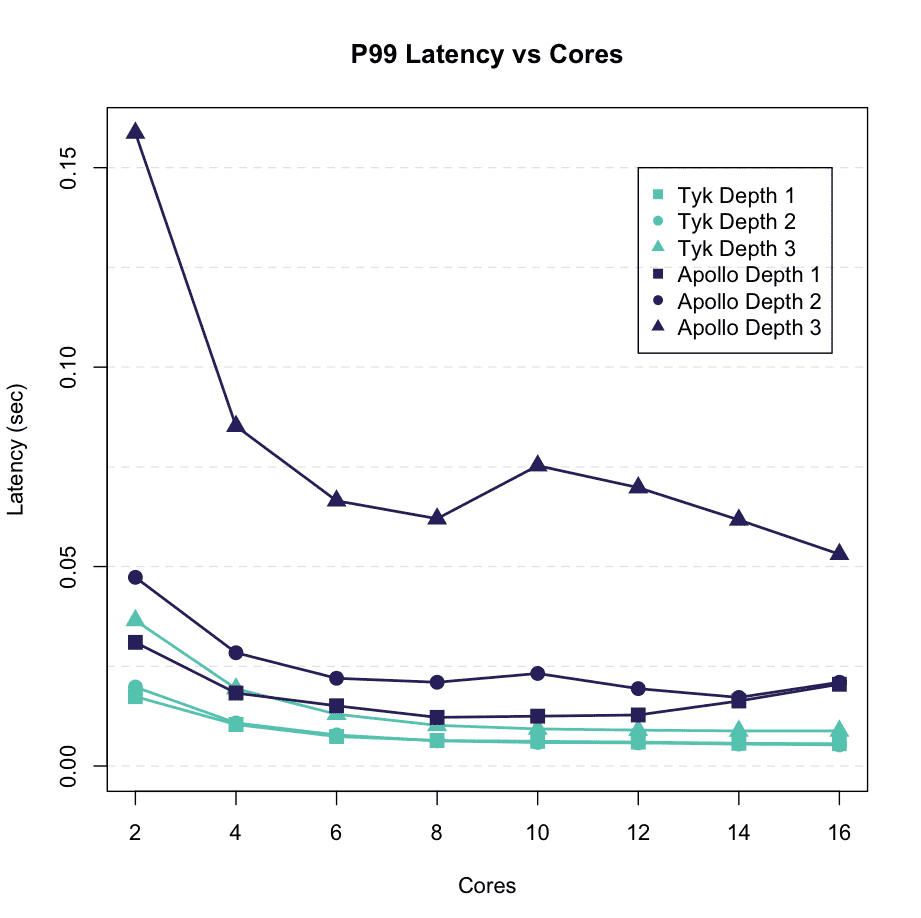
We can evenly compare Tyk vs Apollo’s GraphQL server performance, given that all external factors are identical.
Tyk being a full lifecycle API Management (FLAPIM) platform can perform authentication with IAM, gather API analytics, and much more.
Want to see more?
- Reach out to us and schedule a demo, we’d love to help you with your PoC.
- Read more about Tyk’s Universal Data Graph, and why we think it’s going to change the world of APIs.
- See our performance benchmarks.