In most businesses, it’s not enough just to know that you’ve created a successful API product. You also need to report on that API in a way that demonstrates its impact. Doing so can deliver a range of benefits, from clarity on your API product’s role in the overall business to insights into changes you could make to drive further value and revenue.
Why is API impact reporting important?
Without clear API impact reporting, you can’t truly understand the value that your API delivers to your business. As such, putting reporting processes in place is essential to obtaining a clear picture of your API’s contribution to your business income streams and objectives.
In addition to showing the value your API delivers to the business, reporting on its impact can help check revenue or other key metrics of your API product are on track against the expectations that you outlined when you first created a business case for it. Not only that but showcasing the successful impact of your product is a great help when it comes to justifying ongoing investment in your API team.
How do you report on your API’s impact?
It is easy to put processes in place for API impact reporting. There are three key steps to doing so.
Step 1: Define your key metrics
Remember those goals you outlined when you originally created the business case for your API? Now is the time to see how well your product is delivering against them. This will include reporting on a range of measures, including:
- Number of active users
- Churn rate
- Average revenue per user
- Total revenue that your API is generating
Remember that impact measurement is about product quality and value, as well as revenue, so you can also report on metrics that demonstrate the API’s performance, customer satisfaction rating and so on. You don’t need to reinvent the wheel here – your usual API performance monitoring should provide you with a solid basis on which to build your impact reporting.
That said, for the indirect monetisation use case, things are trickier. For instance, it’s quite difficult to measure the increase in retention rate for customers using APIs versus those who don’t use them. In that case, you will most likely need to apply a bit of data analysis. For instance, you can perform cohort analysis for customers who have never used the APIs of your product versus customers who started using the API within the first month. To do this, you can select customers from the same user segment – size, industry, average revenue per paying user (ARPPU), etc. – who started using your service at the same time and compare how they perform in terms of retention.
In the below example, the analysis reveals that customers who use APIs have higher long-term retention (10 percentage points higher) and much greater short-term retention (15 percentage points higher). From a financial perspective, that means you will receive 10% more revenue in the long run (under the assumption that ARPPU for both types of users is the same).
There is one caveat: you will need to prove that this is causation and not correlation. Normally, you can use qualitative data combined with user surveys to prove that.
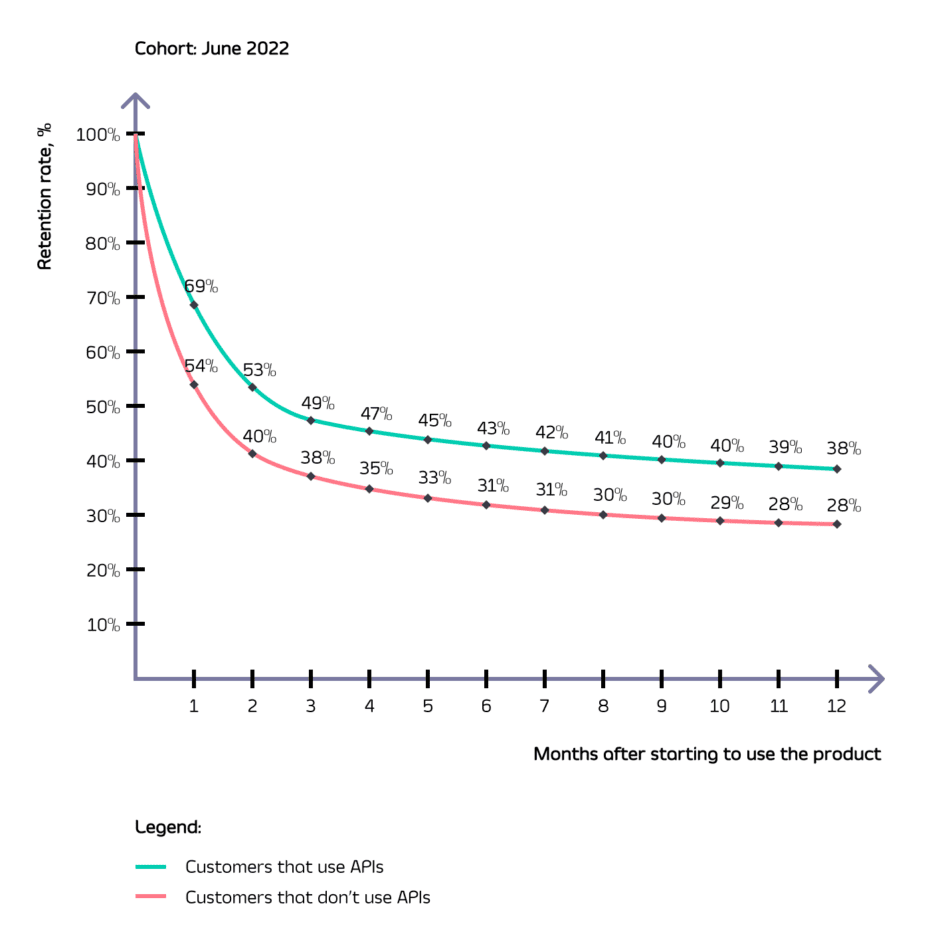
Source: Figma
Another approach is to examine what happened with your customers after they started using APIs. You need to look for differences in their key customer metrics after they started using your APIs, such as retention rate, average spend, number of support tickets created, etc. Once again, you can reveal this by comparing two user groups where the only difference is that one of them is using APIs.
In the example below, the green user group that started using APIs demonstrates a much higher retention rate (18 percentage points higher) after three months of using the product, resulting in a respective revenue uplift (again, under the assumption that ARPPU for both user groups is the same). Compared to the previous example, it is highly unlikely that the difference in retention rate and the fact that the green group switched to APIs is just a correlation.
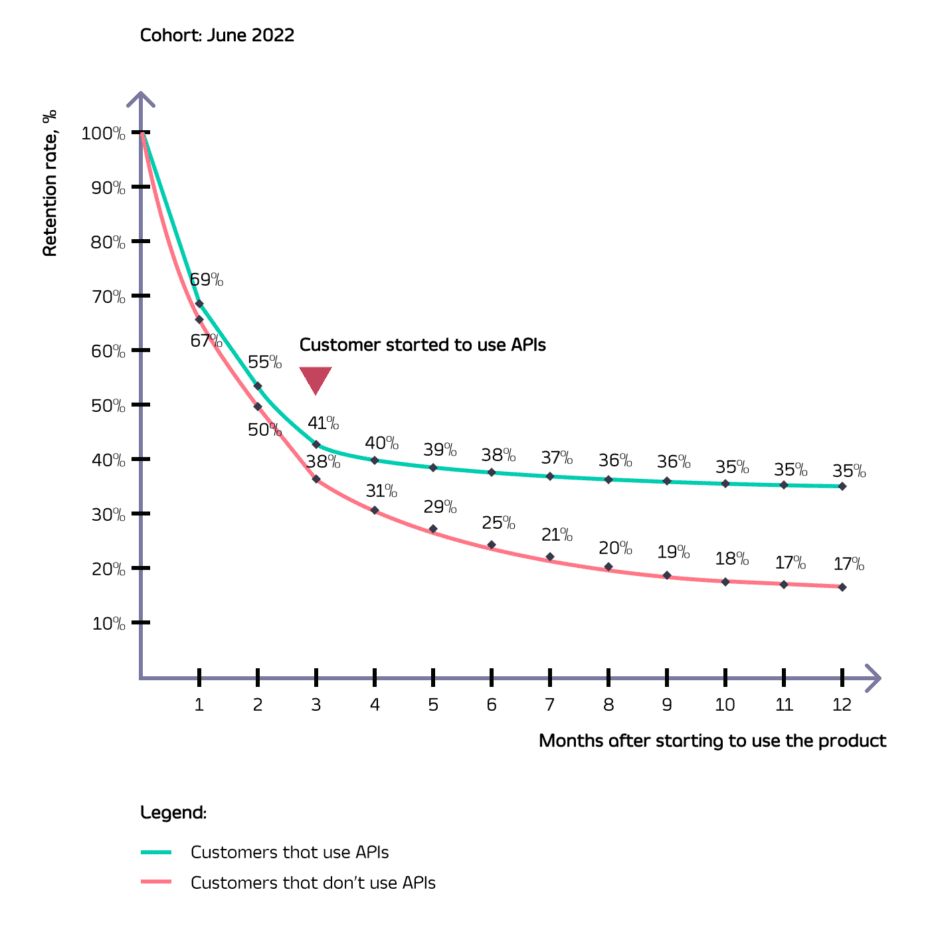
Source: Figma
Once you have confirmed the basic hypothesis, you can extend your dashboard by attributing changes in the key metrics to revenue or other metrics that are important to your business.
Step 2: Arm yourself with the right tools
Next, it’s time to consider which tools you will need to use to report on your chosen metrics. The analytics provided by your API management platform can be a great help here. For diving deeper into the numbers, you can also export your data (such as by using Tyk Pump) to an analytics tool that will let you dissect your figures in whichever ways you need.
Some elements of your reporting will also be drawn from other sources. Measuring customer satisfaction, for example, will involve putting a survey process in place to capture and quantify customer feedback.
Step 3: Implement robust data-based analysis
When demonstrating the impact of your API, you can implement both snapshot reports and trend-based analysis of your data. Doing so means that you can report on both the current state of your API and its value over time.
Reporting on longer-term data is an excellent way to identify trends, some of which may ultimately lead to changes to your API product, so that it delivers even greater value and revenue in future. As such, your API impact reporting can itself feed into your API having a greater impact on your business.
How to communicate your API product’s impact
At the heart of any good reporting process is the way in which you present the data. Visual reports that you can update every month or quarter are a great way to provide your boss or board with easy-to-digest figures.
It’s worth putting a bit of thought into the language you use for your reporting. You might live and breathe APIs but it’s likely your boss or board doesn’t. As such, don’t take a deep dive into the realms of tech talk when it comes to explaining your API’s impact. Keep things clear and simple to ensure your message gets across.
Talk to Tyk
Putting these reporting processes in place will provide you with a detailed understanding of your API product’s impact on the business, in terms of both value and revenue. It can also help the business understand better where that API product fits into overall business performance. All of which feeds just the kind of informed decision-making that can underpin robust business growth.
Tyk can help with all of this, so why not chat with our team about how you can use our API management solution to report on the impact of your APIs? You can also check out our post on five ways to monitor the performance of your APIs for more insights around how to see what’s really going on with your products.