Let’s talk about troubleshooting APIs. Carlos Villanúa Fernández, Tyk’s Presales Solutions Architect, recently demoed how easy it is to use API observability to troubleshoot APIs within minutes. We’ve captured the essence of his wisdom below.
In this blog, you will learn:
- How to use observability to gauge whether your users are happy
- Why traces are so essential for understanding what went wrong and where
- How the information you gather underpins your ability not just to troubleshoot fast but also to make proactive business decisions to remove user pain points
You can watch Carlos’ full demo via the link above, or read on for the top takeaways.
Troubleshooting APIs
A lot of different things can happen when you’re trying to access to an API: errors and delays resulting in all manner of 400 and 500 messages. For users, this is a big pain. Thankfully, there’s usually a bunch of heroes (aka engineers) beavering away in the backend trying to fix things, thinking on how various services connect to one another and all the different bottlenecks.
Observability is the solution here. It’s about having enough data to make meaningful decisions to fix whatever is broken and to see clearly how things are working.
Observability in action
Let’s look at a trace, which is essentially the story of a request:
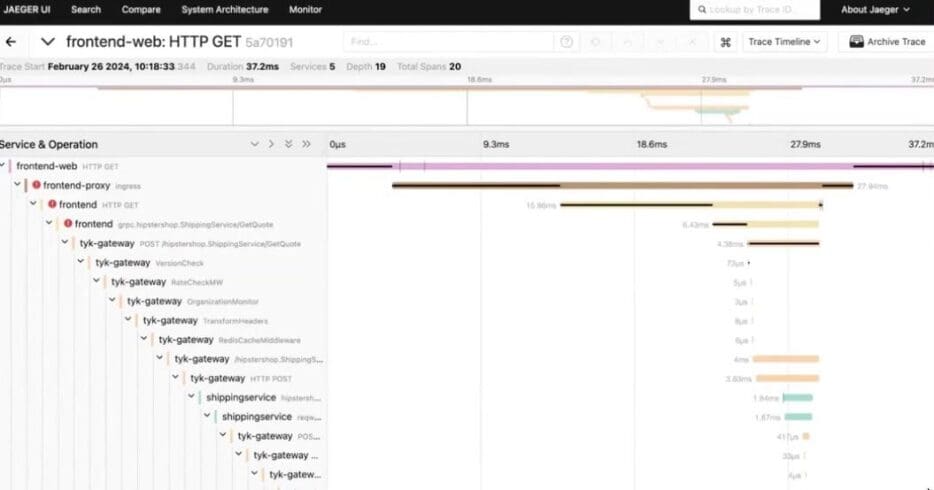
The trace shows you what is happening with the request, all the way from accessing a website and the frontend proxy, through the gateway to other services (such as shipping). It also shows how long each element took.
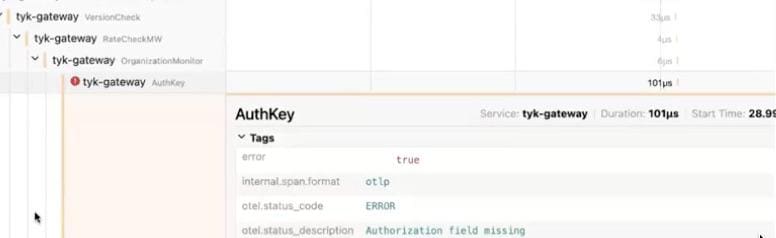
Items with red symbols show an error, which you can click into to see detailed information on where the error is happening and what’s occurring. As an example, below you can see that the authorization field is missing, thus preventing access to data:
Using observability to troubleshoot
Let’s consider a fairly simple system that you might need to troubleshoot. It could look something like this:
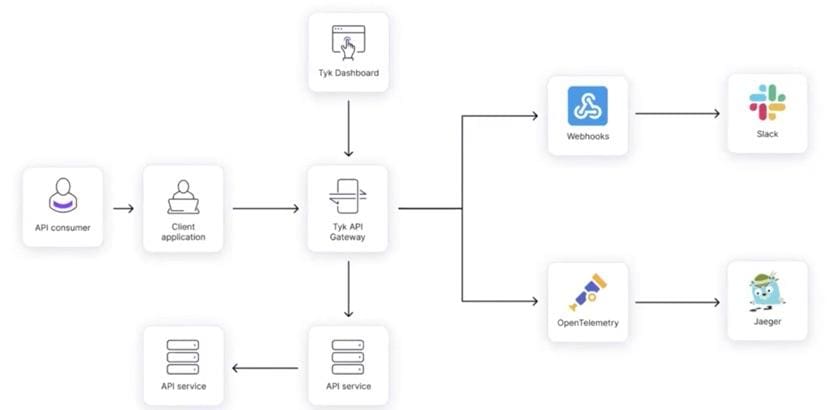
When an error occurs, you need to understand where it’s happening before you can fix it. When you have an API service, which could be calling another API service (that you might not even know), this can get interesting.
This is where an API gateway can help you understand what is happening in your requests. It can compile all the information you need, tell you which resources you can access and set the rules regarding how you access those resources, for example through quotas and rate limits.
You can send the information from the gateway to other tools and teams – to site reliability engineers (SREs), platform engineers or anyone else who’s troubleshooting. In the case of Tyk API Gateway, which is OpenTelemetry (OTel) enabled, you can send the data to different OTel compatible tools, such as Jaeger. Alternatively, you could use webhooks to send data to a message system for real-time troubleshooting alerts.
The point here is not which tools or mechanisms you use but the fact you need to have the right data when troubleshooting with them. If, for example, a user has exceeded their quota, you need that information before you know to go ahead and reset their quota. The right information is what will unlock your ability to solve problems.
Looking at your traces provides you with this information. You can see the story of all your requests, including any errors that occurred. In addition to troubleshooting, this provides you with the ability to filter errors to understand how many users are experiencing the same issue. This kind of analysis can then inform future decisions. Continuing the exceeded quota example from above, if you found this was an issue for a lot of users, you could perhaps make changes to your usage plans. Doing so could improve your users’ experience as a direct result of your observability data.
Being able to see the different errors in your traces means you have the knowledge you need to take different actions. If a service has stopped, for example, you can see this and can go directly to the service to restore it, rather than poking about in your API gateway.
Your traces can also show you useful information such as how long it is taking users to access an API. If requests are taking more than two or three seconds, you know there’s an issue for you to fix – and the traces will show you precisely where the delay occurred, meaning you know where to fix it.
Taking observability to the next level
We’ve used simple examples above, but you can also use observability for more complex troubleshooting.
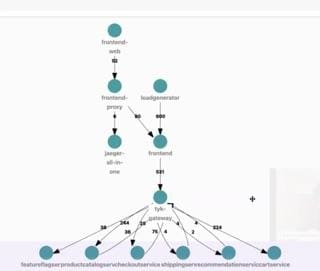
Let’s say you have a website with all sorts of services running so that users can browse, see pricing details, add items to their cart, edit or empty their cart, arrange shipping, make payments and so on. All of these services are interconnected in order to deliver a seamless user experience.
Now, when you look at your traces in Jaeger (or whatever your preferred tool may be), you’ll be able to see errors relating to multiple spans and services. What’s helpful is that you can still see the story of each request as it travels from the frontend through the gateway to the various services, including from one service to another. Again, the traces can show you what went wrong and where.
(Side note: Jaeger can paint you a very cool architecture diagram of how the front end connects to proxies and services, which can be handy for seeing how your flows are going and what’s happening in your systems.)
Should you trace all calls?
Tracing provides you with powerful troubleshooting capabilities, but should you enable it for all calls? Probably not, as doing so could be expensive in terms of data/hosting. If you have something in production that’s working well, tracing less than a hundred percent could be a smart move – though that will depend entirely on your understanding of how your environment is working.
Do you have traces running in pre-prod? Which of your services are most critical? Questions like these should help guide your decisions around where you should have tracing and where you are less likely to need it. You could also explore error-based tracing, where you report errors and perhaps ten percent of other traces. There’s definitely a balance to be struck based on your specific business situation.
Conclusion
Using traces in this way enables you to observe what is happening in your systems. That information gives you a way to gauge how happy your users are: if there are no errors, your users are happy!
An API gateway helps immensely, as it means you don’t have to have everything instrumented before you can get started with observability. You don’t need to change the code and logic from your legacy or other systems – simply use an OpenTelemetry enabled gateway (such as Tyk) and you can start logging errors immediately. Without the gateway in place, you would need to implement the logic of access, rate limiting quotas and so on in each individual service.
Why not discover for yourself how easy it is to start using Tyk API Gateway to help you troubleshoot API issues fast? You can sign up for a free trial to get started right now or chat to our team for further details.