CICD - Automating Your Plugin Builds
It’s very important to automate the deployment of your infrastructure. Ideally, you store your configurations and code in version control, and then through a trigger, have the ability to deploy everything automatically into higher environments. With custom plugins, this is no different. To illustrate this, we can look at the GitHub Actions of the example repo. We see that upon every pull request, a section of steps are taken to “Build, Bundle, Release Go Plugin”. Let’s break down the workflow file:Compiling the Plugin
We can see the first few steps replicate our first task, bootstrapping the environment and compiling the plugin into a binary format.go-build command.
Bundle The Plugin
The next step of the workflow is to “bundle” the plugin.For added security, please consider signing your bundles, especially if the connection between the Gateways and the Bundler server traverses the internet.
Deploy The Plugin
Next step of the workflow is to publish our bundle to a server that’s reachable by the Gateways.For seamless deployments, take a look at multi-version plugin support to enable zero downtime deployments of your Tyk Gateway installs
Configure the Gateway
In order to instruct the Gateway to download the bundle, we need two things:- The root server - The server which all bundles will be downloaded from. This is set globally in the Tyk conf file here.
- The name of the bundle - this is generated during your workflow usually. This is defined at the API level (this is where you declare Custom plugins, as evident in task 2)
custom_middleware_bundle.
Summary
That’s it! We’ve set up our dev environment, built, compiled, a Custom Go plugin, loaded onto a Tyk Gateway, and tested it by sending an API request. Finally, we’ve talked about deploying a Bundle in a production grade set up. Have a look at our examples repo for more inspiration.Instrumenting Plugins with OpenTelemetry
By instrumenting your custom plugins with Tyk’s OpenTelemetry library, you can gain additional insights into custom plugin behavior like time spent and exit status. Read on to see some examples of creating span and setting attributes for your custom plugins.Note:
Although this documentation is centered around Go plugins, the outlined principles are universally applicable to plugins written in other languages. Ensuring proper instrumentation and enabling detailed tracing will integrate the custom plugin span into the trace, regardless of the underlying programming language.
Prerequisites
- Go v1.19 or higher
- Gateway instance with OpenTelemetry and DetailedTracing enabled:
DetailedTracing must be enabled in the API definition to see the plugin spans in the traces.
In this case, we are using our own OpenTelemetry library for convenience. You can also use the Official OpenTelemetry Go SDK
Create a new span from the request context
trace.NewSpanFromContext() is a function that helps you create a new span from the current request context. When called, it returns two values: a fresh context with the newly created span embedded inside it, and the span itself. This method is particularly useful for tracing the execution of a piece of code within a web request, allowing you to measure and analyze its performance over time.
The function takes three parameters:
Context: This is usually the current request’s context. However, you can also derive a new context from it, complete with timeouts and cancelations, to suit your specific needs.TracerName: This is the identifier of the tracer that will be used to create the span. If you do not provide a name, the function will default to using thetyktracer.SpanName: This parameter is used to set an initial name for the child span that is created. This name can be helpful for later identifying and referencing the span.
GoPlugin_first-span and it’s the first child of the GoPluginMiddleware span.
Modifying span name and set status
The span created usingtrace.NewSpanFromContext() can be further configured after its creation. You can modify its name and set its status:
AddFooBarHeader Testing with an OK Status.
The second parameter of the SetStatus method can accept a description parameter that is valid for ERROR statuses.
The available span statuses in ascending hierarchical order are:
-
SPAN_STATUS_UNSET -
SPAN_STATUS_ERROR -
SPAN_STATUS_OK
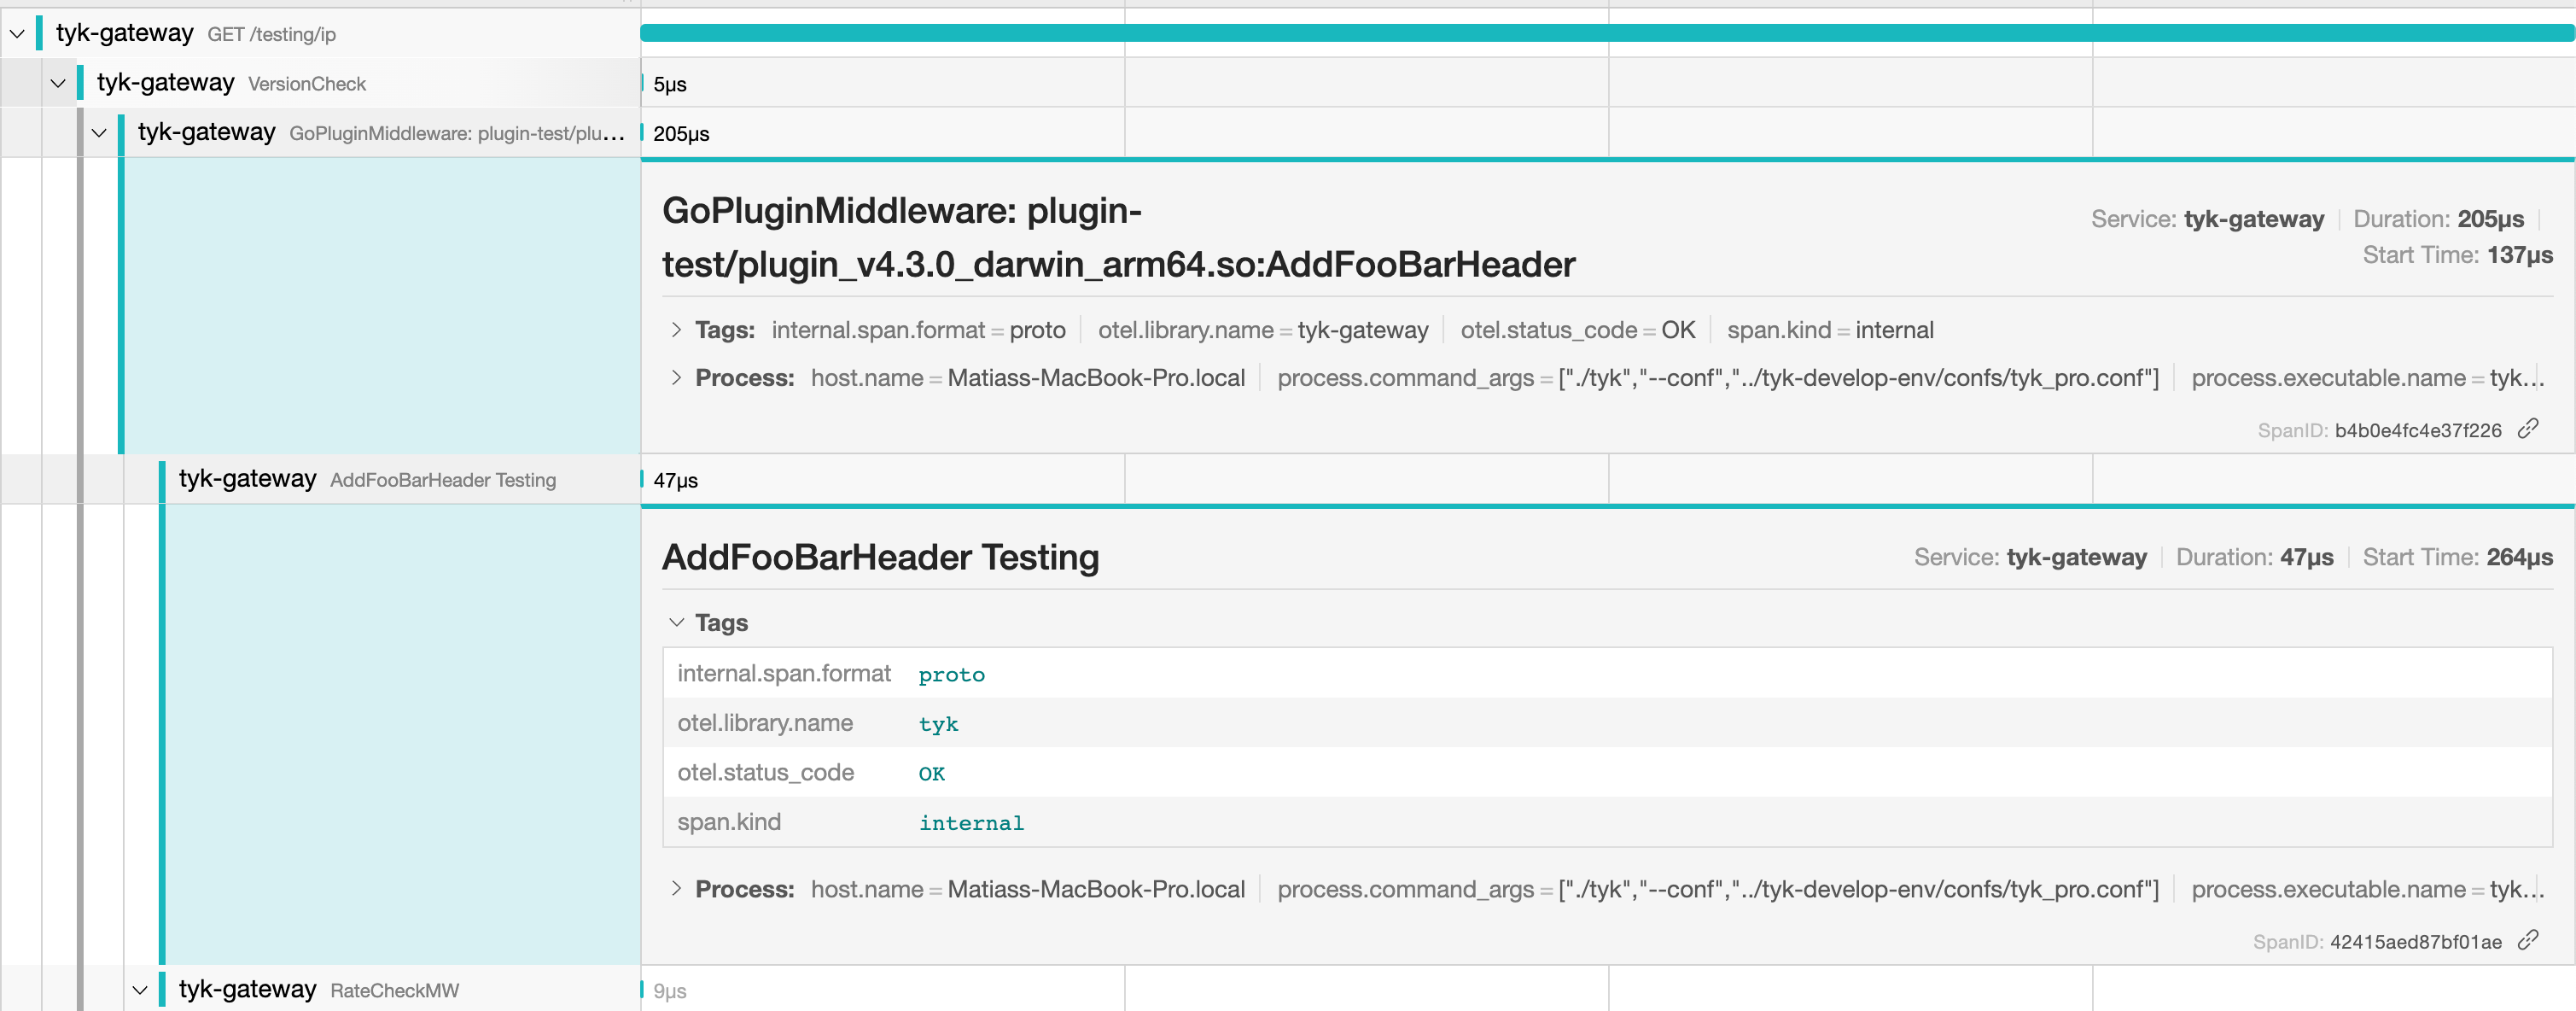
otel.status_code tag with the OK status.
Setting attributes
TheSetAttributes() function allows you to set attributes on your spans, enriching each trace with additional, context-specific information.
The following example illustrates this functionality using the OpenTelemetry library’s implementation by Tyk
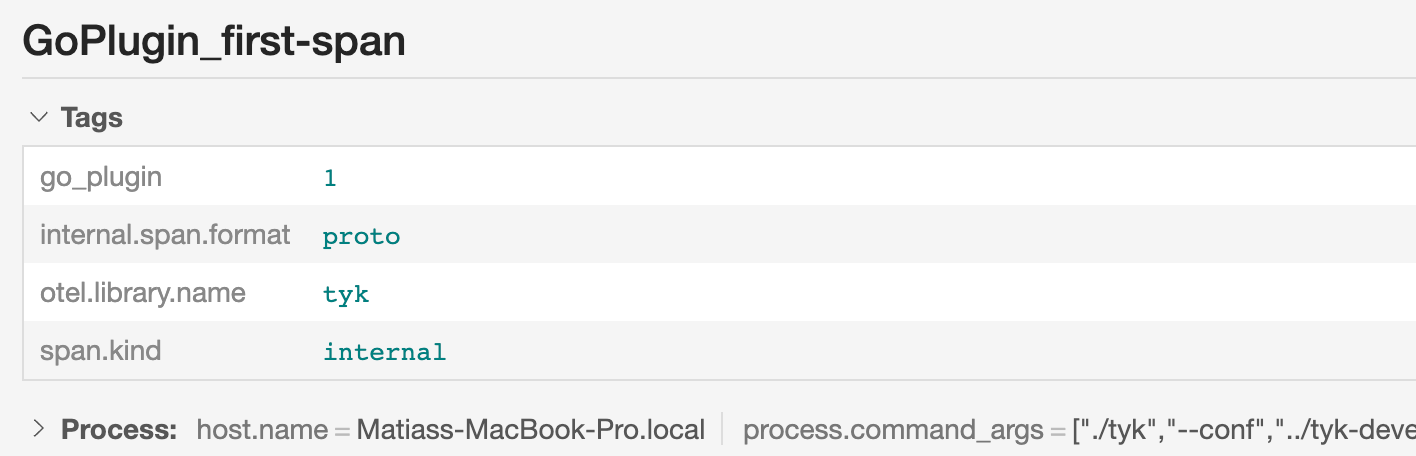
go_plugin with a value of 1 on the span. This is just a demonstration; in practice, you might want to set attributes that carry meaningful data relevant to your tracing needs.
Attributes are key-value pairs. The value isn’t restricted to string data types; it can be any value, including numerical, boolean, or even complex data types, depending on your requirements. This provides flexibility and allows you to include rich, structured data within your spans.
The illustration below, shows how the go_plugin attribute looks in Jaeger:
Multiple functions = Multiple spans
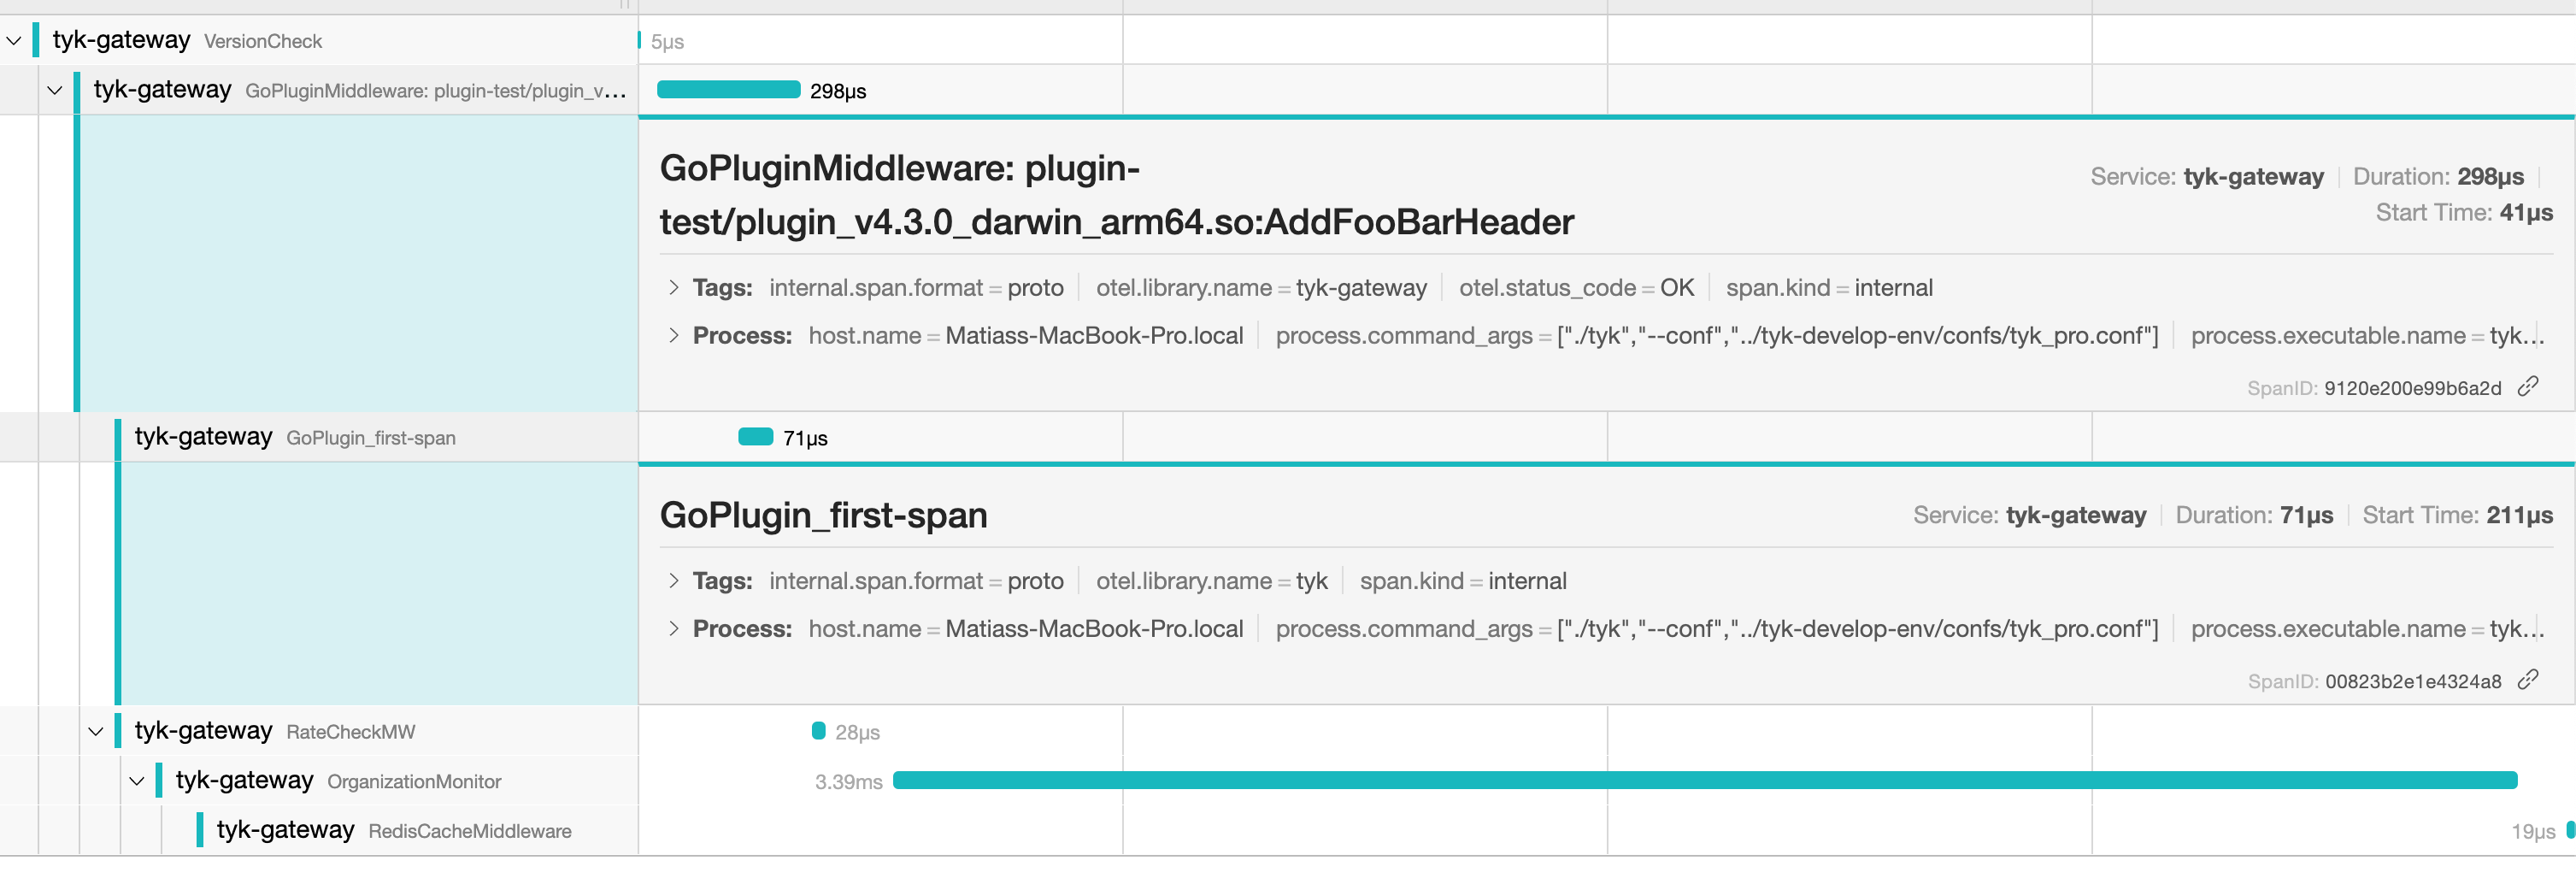
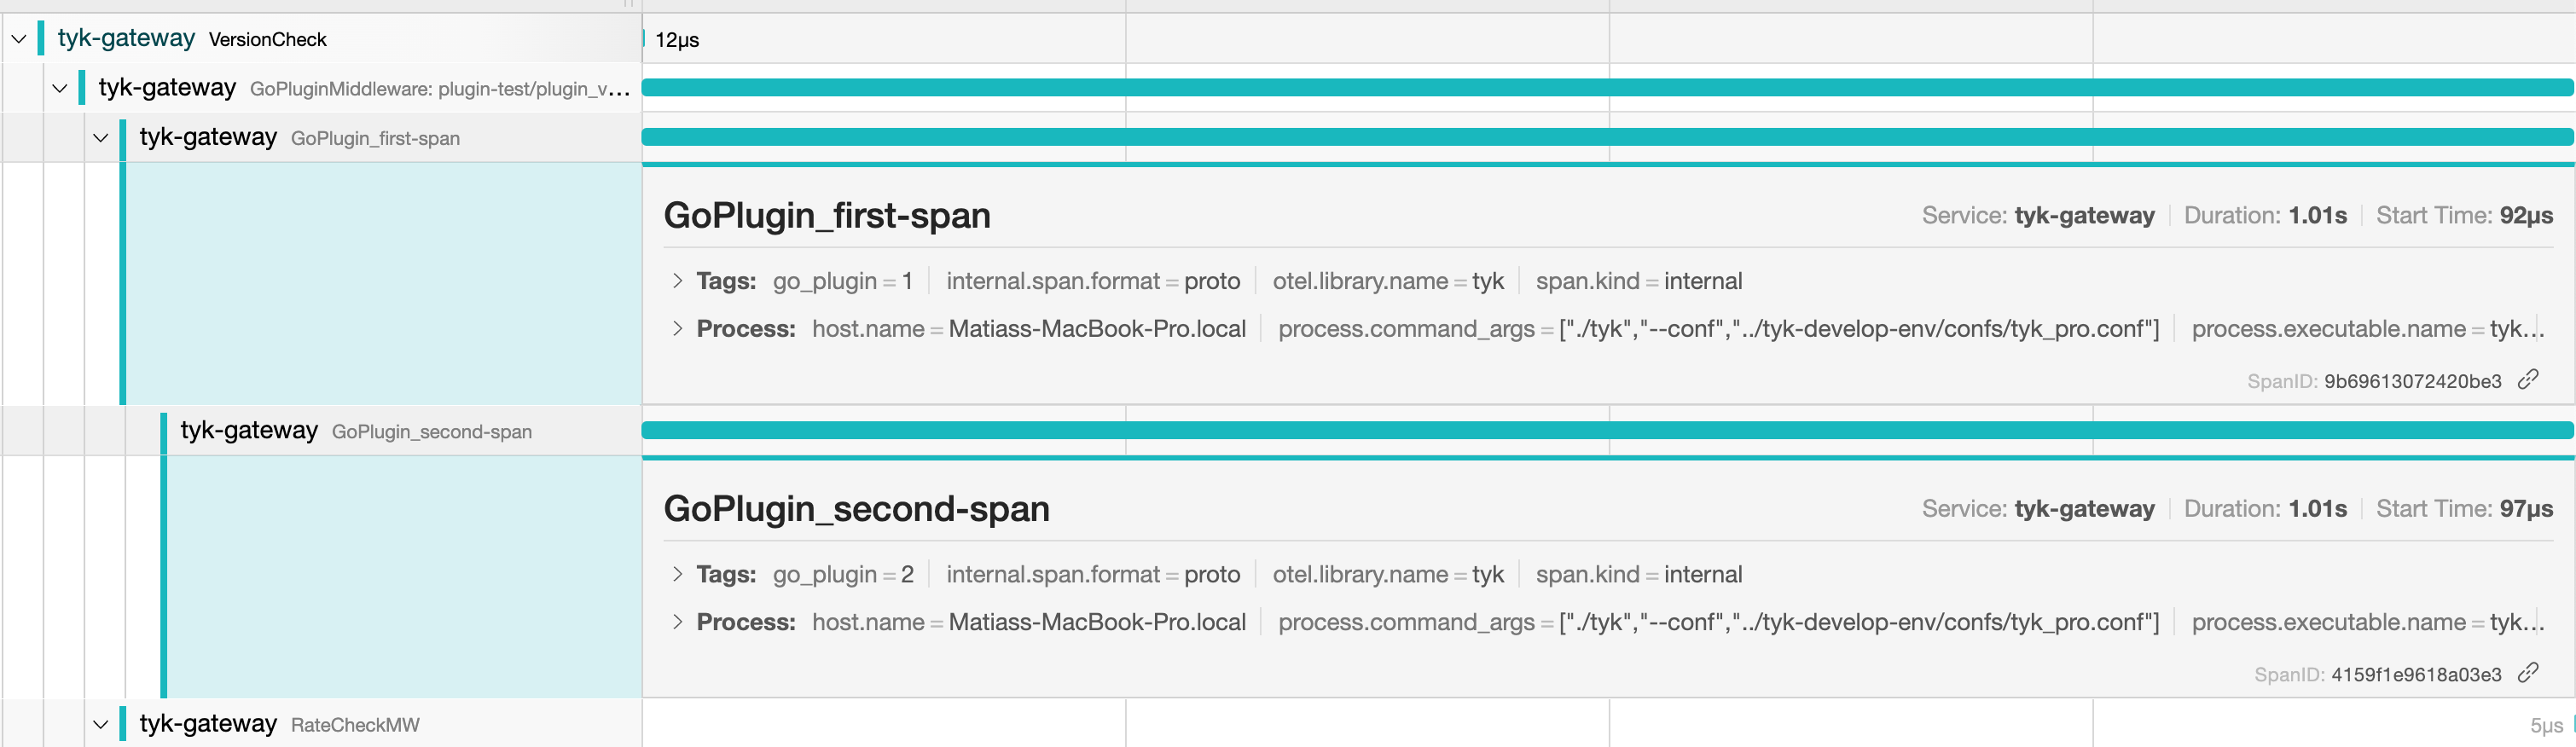
To effectively trace the execution of your plugin, you can create additional spans for each function execution. By using context propagation, you can link these spans, creating a detailed trace that covers multiple function calls. This allows you to better understand the sequence of operations, pinpoint performance bottlenecks, and analyze application behavior. Here’s how you can implement it:AddFooBarHeader function creates a span and then calls NewFunc, passing the updated context. The NewFunc function starts a new span of its own, linked to the original through the context. It also simulates some processing time by sleeping for 1 second, then sets a new attribute on the second span. In a real-world scenario, the NewFunc would contain actual code logic to be executed.
The illustration below, shows how this new child looks in Jaeger:
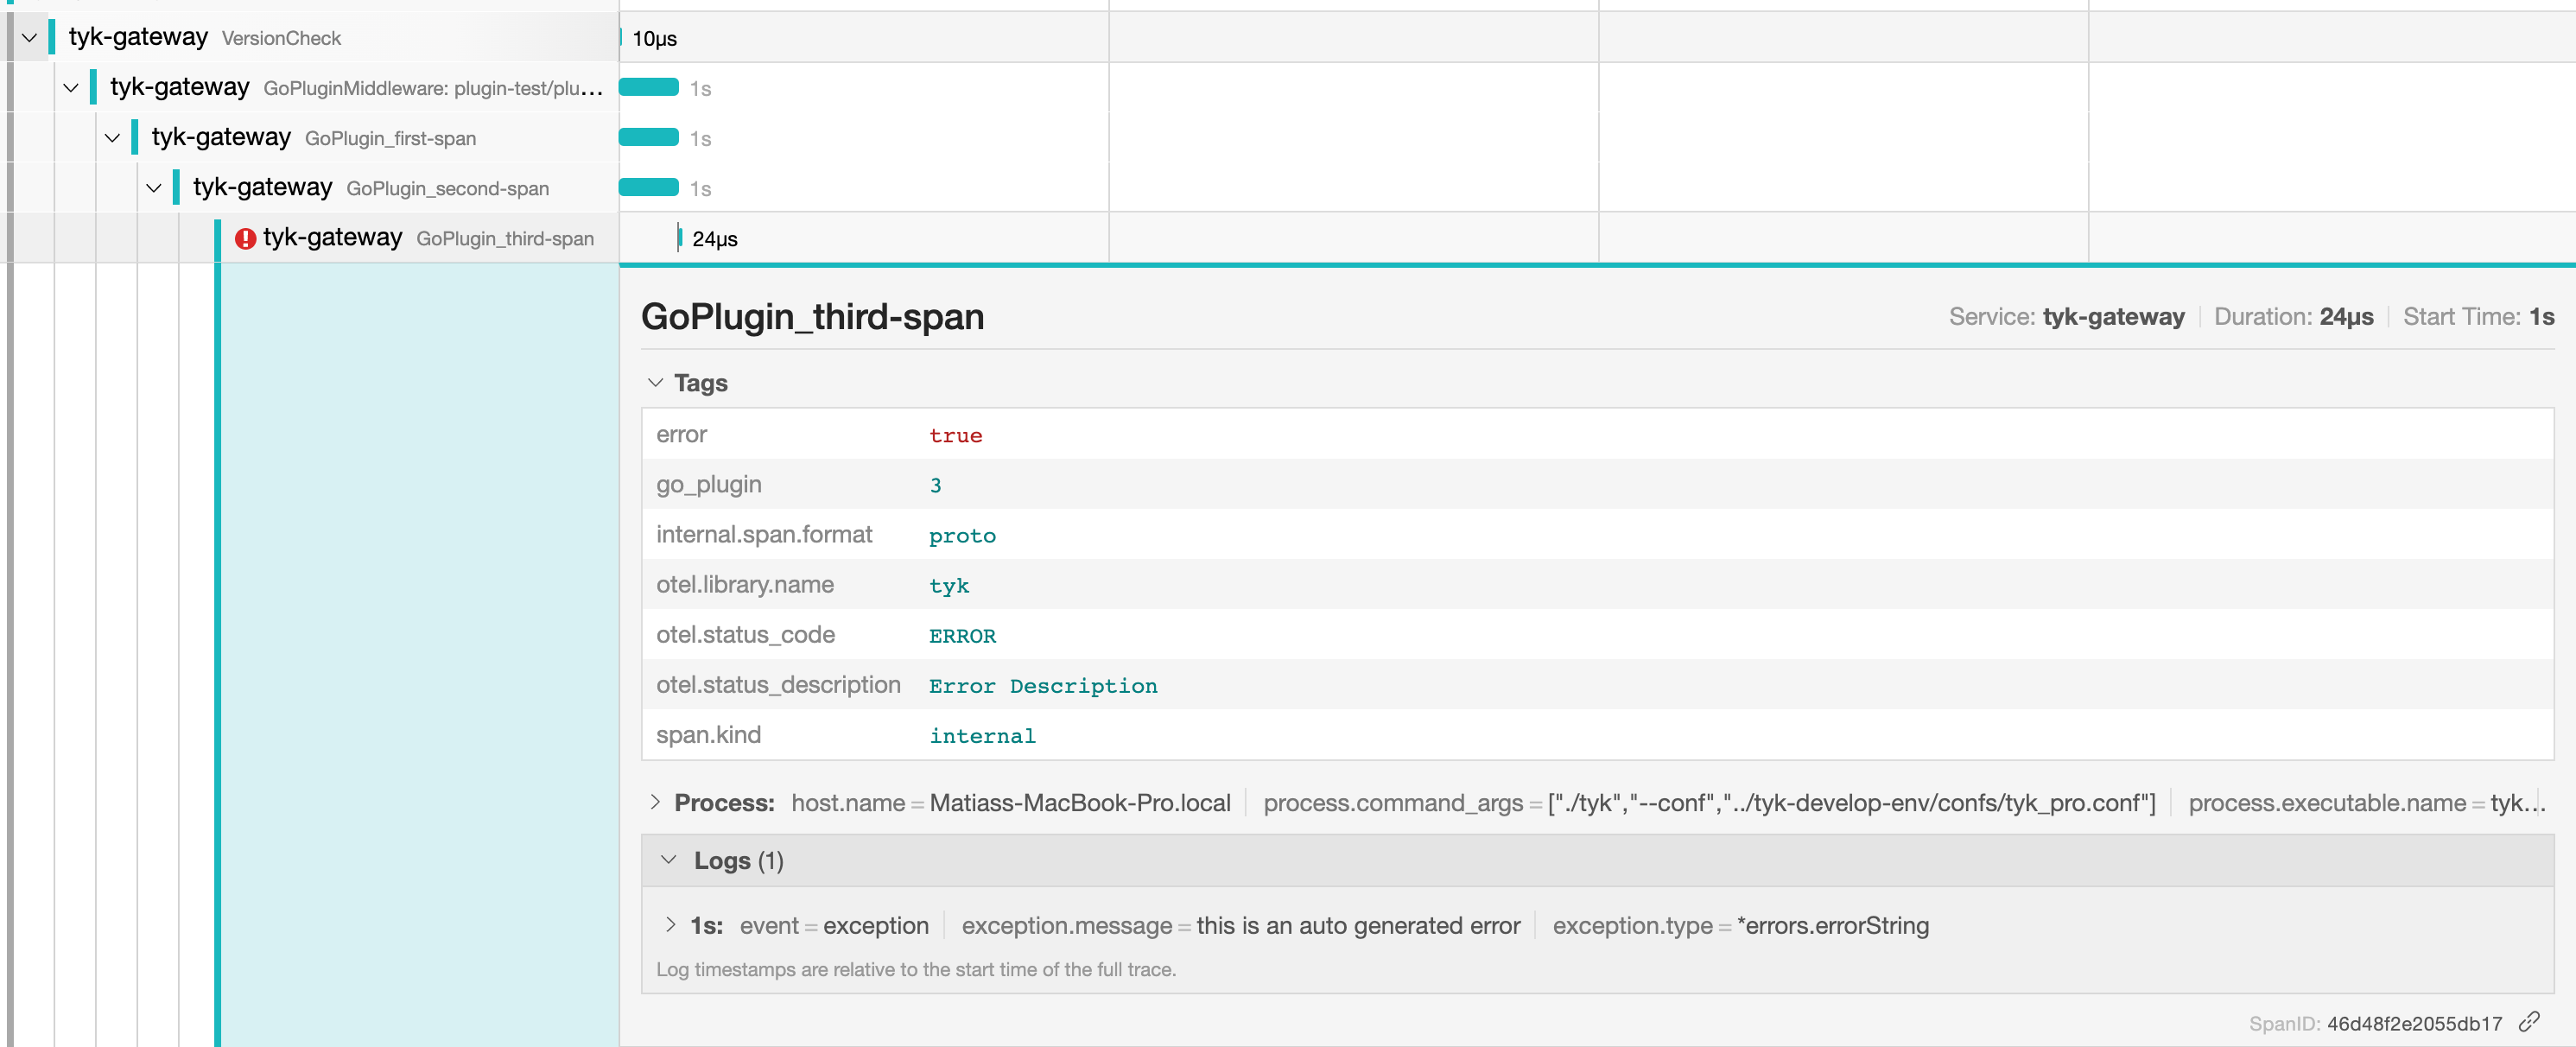
Error handling
In OpenTelemetry, it’s essential to understand the distinction between recording an error and setting the span status to error. TheRecordError() function records an error as an exception span event. However, this alone doesn’t change the span’s status to error. To mark the span as error, you need to make an additional call to the SetStatus() function.
RecordError will record err as an exception span event for this span. An additional call to SetStatus is required if the Status of the Span should be set to Error, as this method does not change the Span status. If this span is not being recorded or err is nil then this method does nothing.Here’s an illustrative example with function calls generating a new span, setting attributes, setting an error status, and recording an error:
NewFuncWithError function demonstrates error handling in OpenTelemetry. First, it creates a new span. Then it sets the status to error, and adds an attribute. Finally, it uses RecordError() to log an error event. This two-step process ensures that both the error event is recorded and the span status is set to reflect the error.
Highly Available gRPC Servers in Kubernetes
When deploying gRPC servers to host rich plugins in Kubernetes, implementing proper health checks on those servers is crucial so that you can achieve high availability and enable seamless rolling updates. Kubernetes needs to know when your gRPC server is ready to accept traffic otherwise:- Traffic may be routed to pods that aren’t ready
- Failed pods won’t be automatically restarted
- Load balancing becomes unreliable
- Rolling deployments can cause service disruption
Key Benefits of Health Checks for Rolling Updates
- Zero-Downtime Deployments
- Readiness probes ensure new pods are fully ready before receiving traffic
- Old pods continue serving until new ones are ready
- Traffic is never routed to non-functional pods
- Graceful Shutdown
- SIGTERM triggers immediate graceful shutdown sequence
- Health status changes to “not serving” during shutdown
- gRPC server stops gracefully, finishing in-flight requests
- 30-second timeout ensures forced shutdown if graceful shutdown hangs
- Failure Recovery
- Liveness probes detect and restart unhealthy pods
- Startup probes give adequate time for slow-starting services
- Failed deployments are automatically rolled back
Using gRPC Health Probes with Tyk
Tyk’s native support for gRPC health probes is provided via the Health Checking service in the standard gRPC Go library and provides several benefits:- Native Integration: Uses the same transport protocol as your main service
- Service-Specific Checks: Can check the health of individual gRPC services
- Better Resource Utilization: No need for a separate HTTP server
- Consistent Protocol: Maintains gRPC throughout the stack
gRPC Health Checking Protocol
The following example uses the gRPC Health Checking Protocol instead of HTTP endpoints.Health Check Implementation Details
The gRPC health server manages two service states:""(empty string): Overall server health"coprocess.Dispatcher": Specific service health for readiness checks
- Startup:
NOT_SERVING→SERVING(when ready) - Shutdown:
SERVING→NOT_SERVING(immediate) - Error:
SERVING→NOT_SERVING(on failure)
Example Implementation
Required Dependencies
You should add this to yourgo.mod: