GraphQL playground
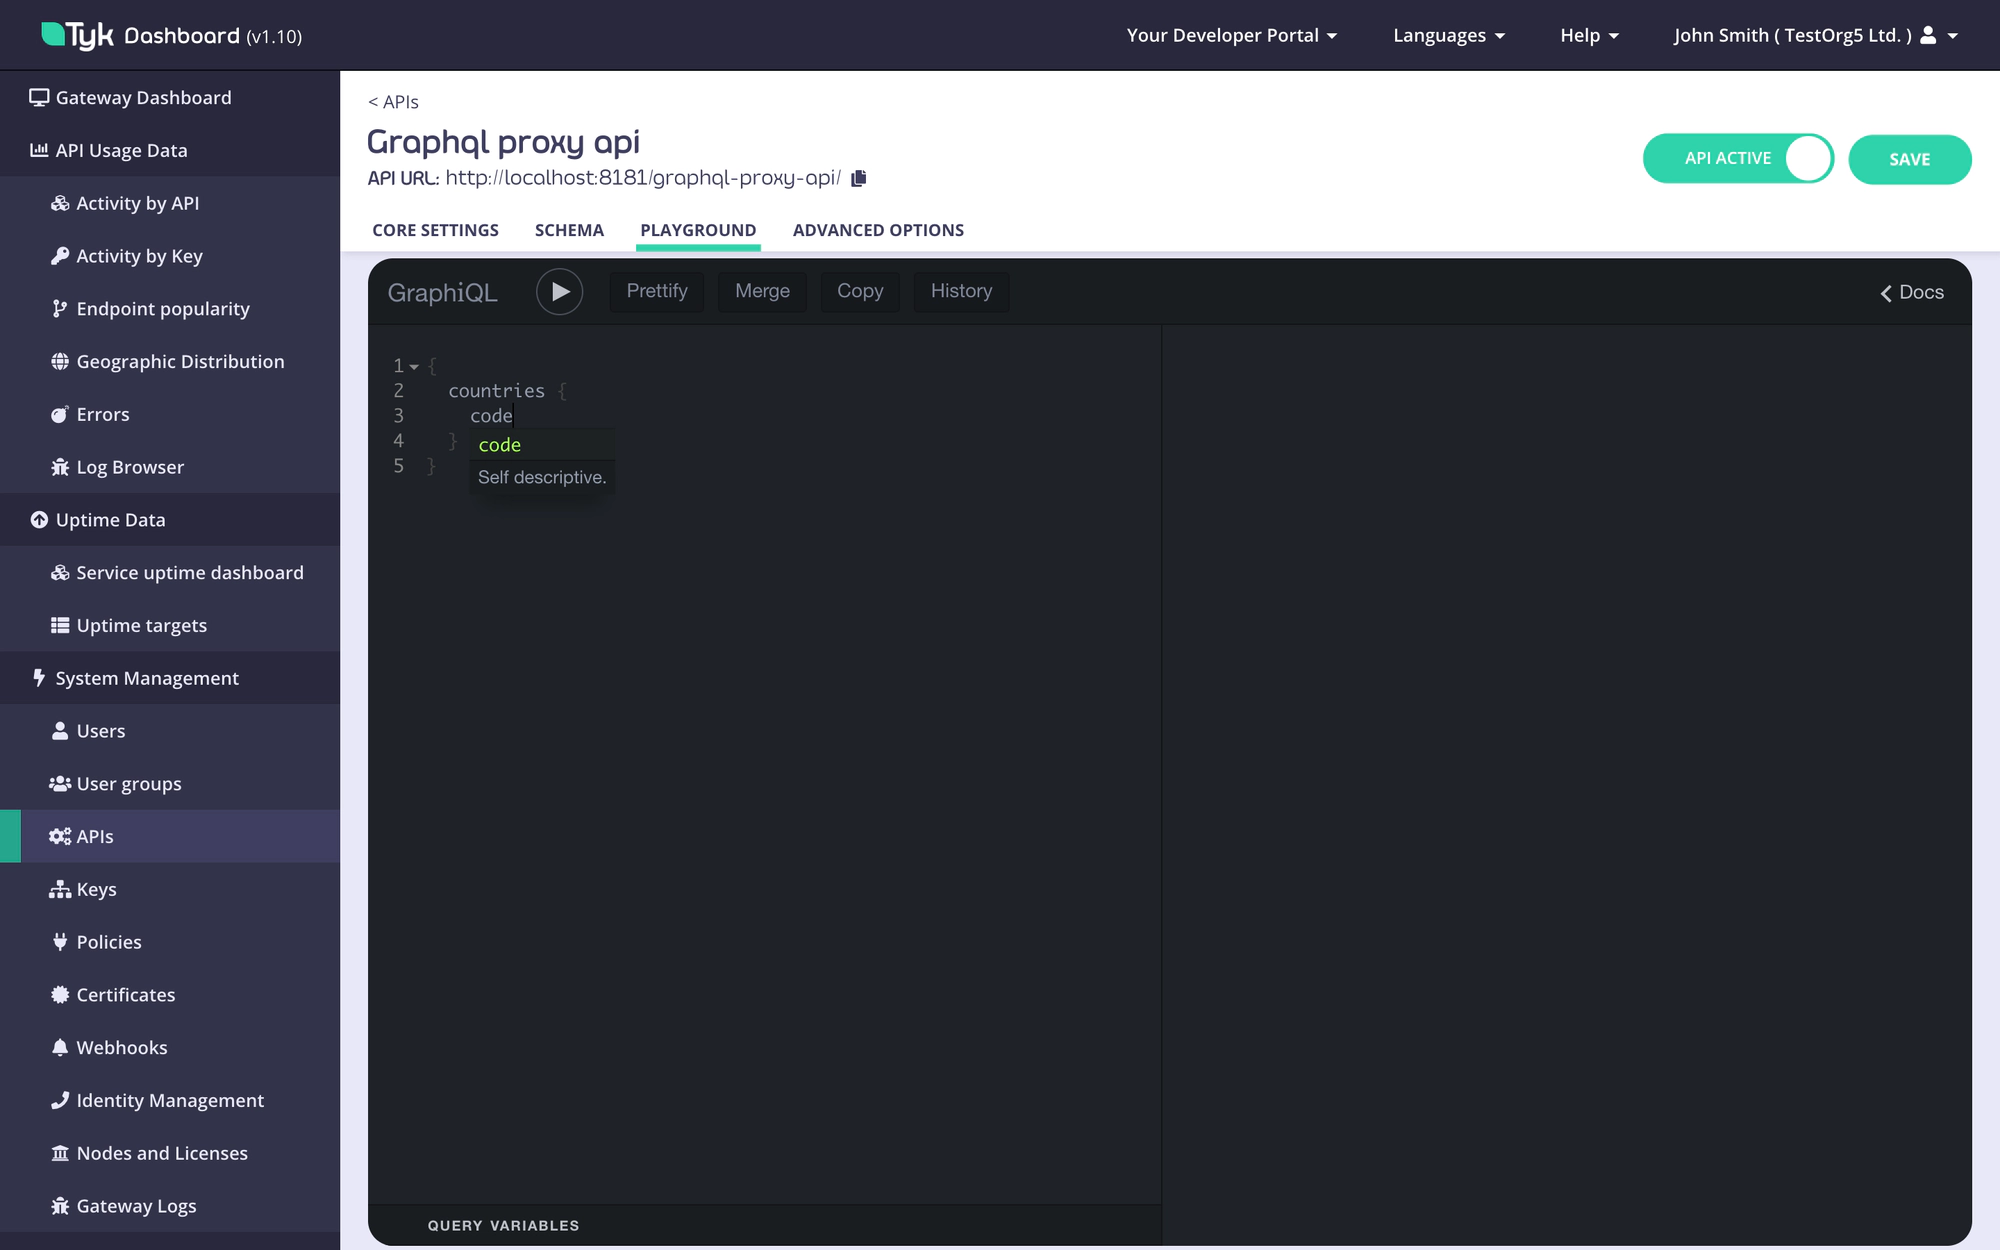
While creating or editing a GraphQL API, all the changes made, can be tested using the GraphiQL playground which sits under the Playground tab in API Designer.
The GraphiQL try-out playground comes with a series of features by default, which can be very useful while configuring the API:
- Syntax highlighting.
- Intelligent type ahead of fields, arguments, types, and more.
- Real-time error highlighting and reporting for queries and variables.
- Automatic query and variables completion.
- Automatically adds required fields to queries.
- Documentation explorer, search, with markdown support.
- Query History using local storage
- Run and inspect query results using any promise that resolves JSON results. 9. HTTPS or WSS not required.
- Supports full GraphQL Language Specification:
- Queries, Mutations, Subscriptions, Fragments, Unions, directives, multiple operations per query, etc
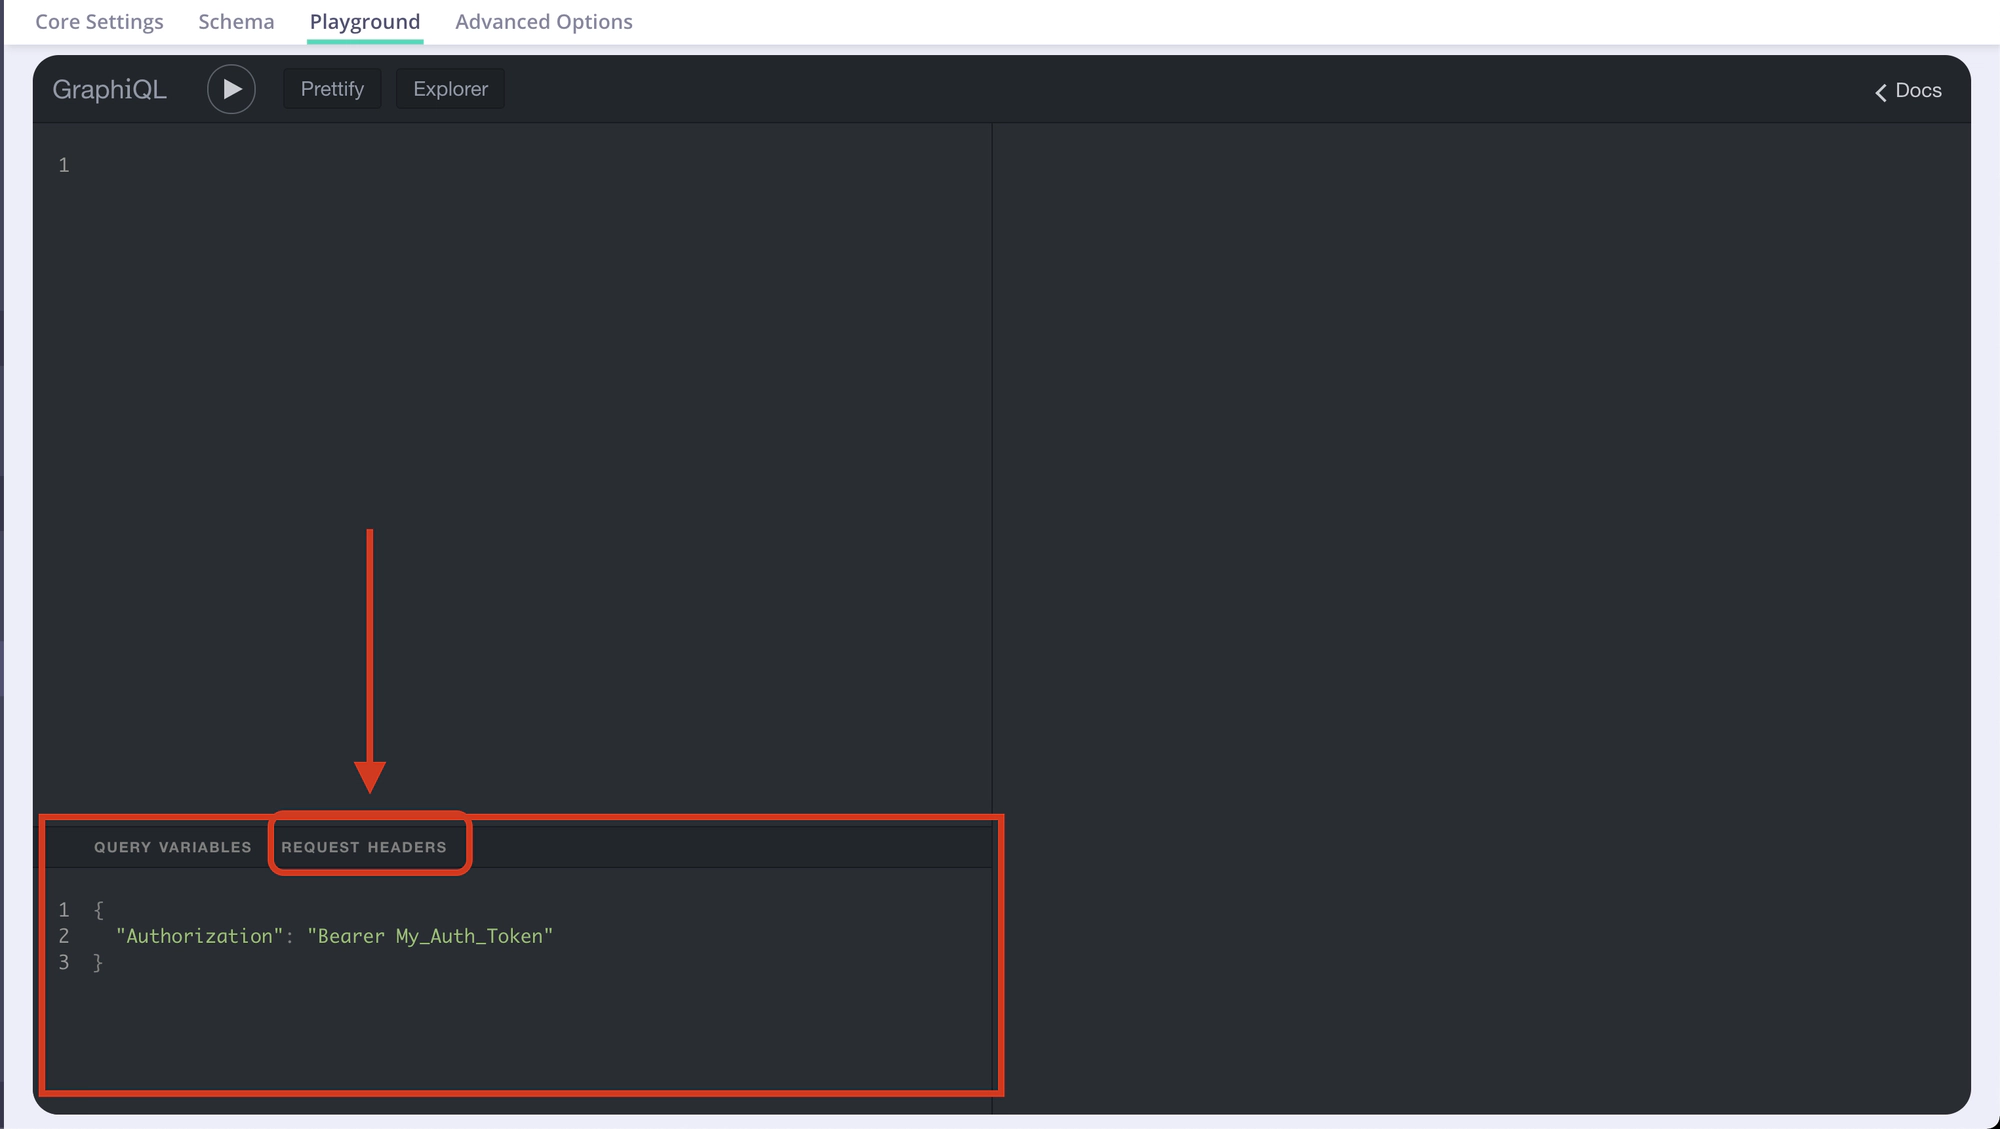
Headers
Debugging a GraphQL API might require additional headers to be passed to the requests while playing with the GraphiQL interface (i.e. Authorization header in case of Authentication Token protection over the API). This can be done using the dedicated headers tab in the Graphiql IDE.
You can also forward headers from your client request to the upstream data sources.
Logs
Beside the results displayed in the GraphiQL playground, we are displaying as well a full list of logs of the triggered request, which helps a lot when debugging the API functionality.
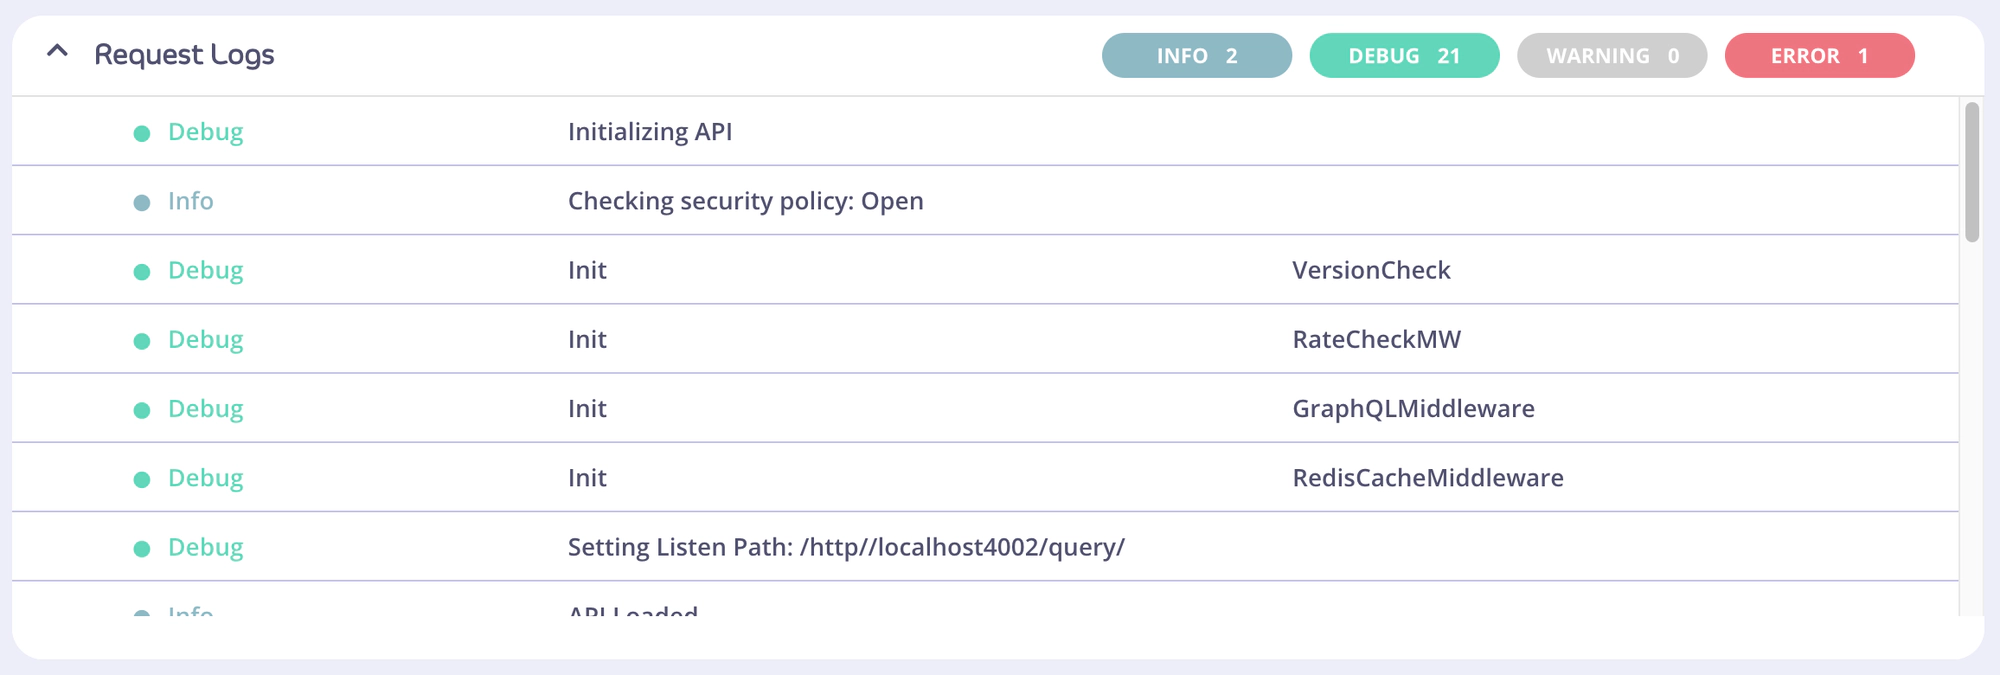
The Request Logs can be seen under the playground itself. When no logs are present, there will be no option to expand the logs, and the filter buttons (top right) will be disabled, shown in Figure 1:

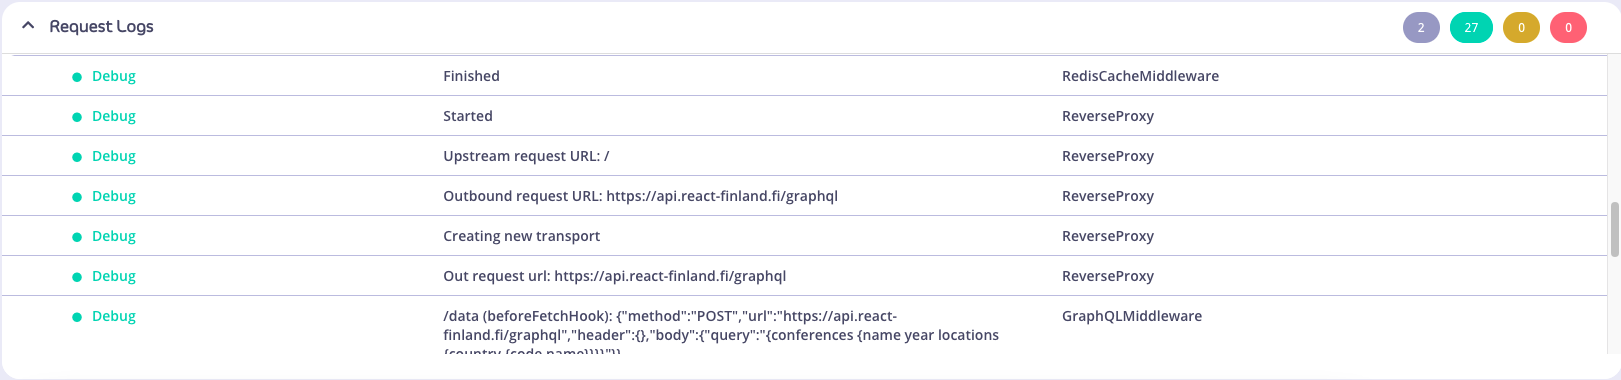
After creating and sending a query, the logs will automatically expand, and the filter buttons will display the number of logs for its respective level (category).
Contents of the logs
There are four levels (categories) of log: Info, Debug, Warning, and Error, and each log belongs to one of these levels.
The first columnof the table displays the colour-coded “level” property of the log. A log should never be absent of a level. The second column displays the log “msg” (message) property, if any. The third column displays the “mw” (middleware) property, if any.
Expansion/collapse of Request Logs
The Request Logs can be expanded or collapsed, using the chevron on the left side to toggle these states.
Filter buttons and states
Filter buttons have two states: active and inactive; the default of which is active. A solid background colour of the button indicates that a filter is active.
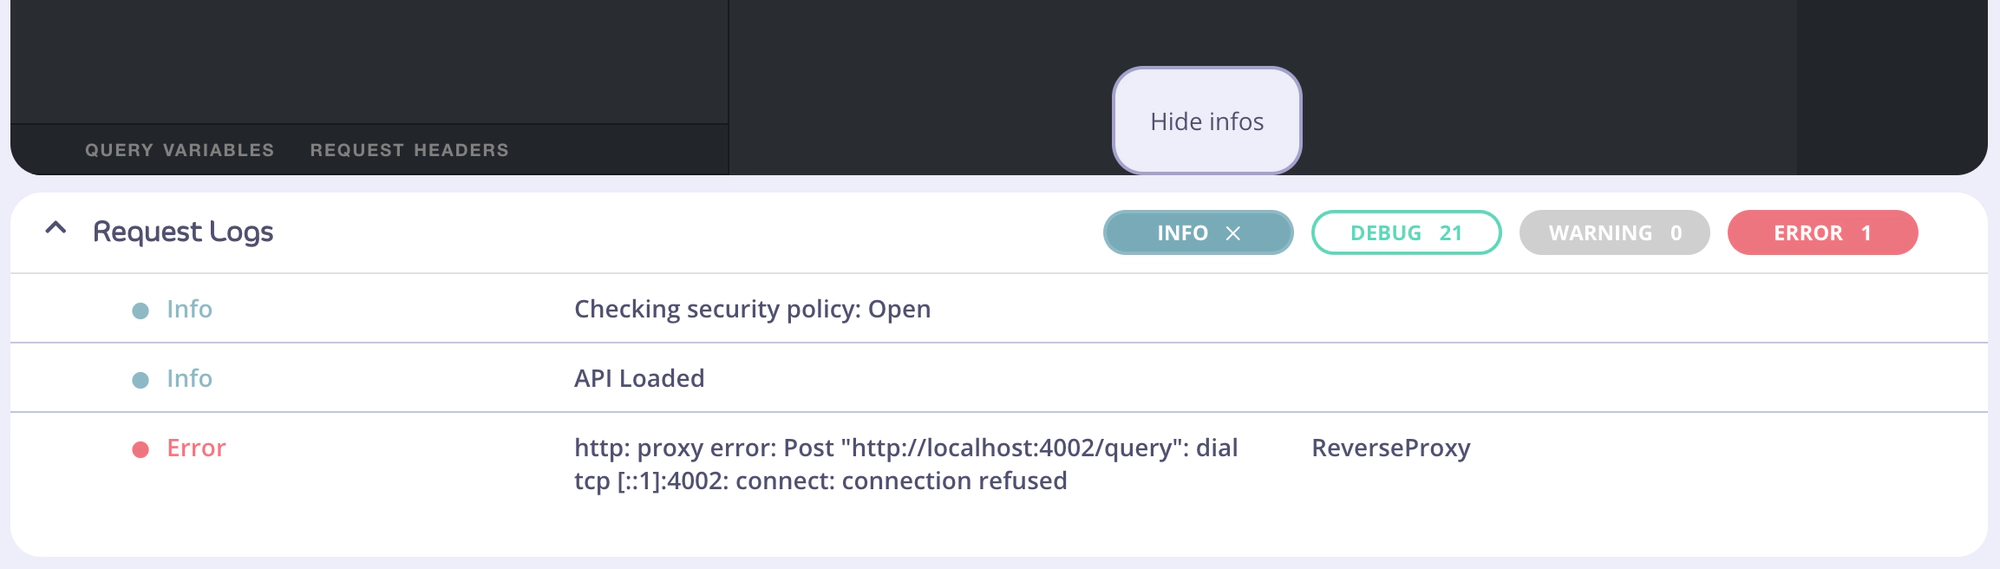
In the below picture, the info and error filters buttons are both active. If there are no logs for a particular level of log, the button will appear as a grey and disabled, as shown by the Warning filter button.
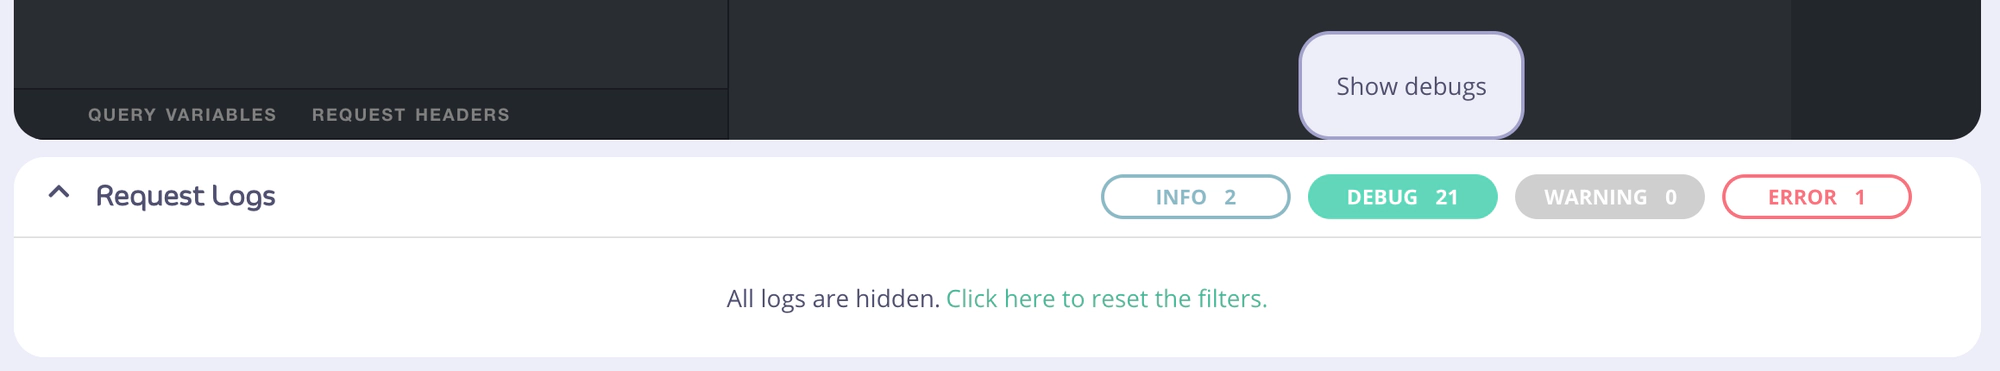
Here’s an example where there is at least one log, but all the filter buttons are in the inactive state. If the cursor (not shown) hovers over an inactive filter button, the button background will change to solid, and the tooltip will display “Show”.
If all filter buttons are inactive, a message asking whether the user would like to reset all filters will display. Clicking this text will activate all available filters.