Using Docker
This guide explains how to set up Jaeger to ingest OpenTelemetry traces via the OpenTelemetry Collector (OTel Collector) using Docker. We will cover the installation of essential components, their configuration, and the process of ensuring seamless integration. For Kubernetes instructions, please refer to How to integrate with Jaeger on Kubernetes.Prerequisites
Ensure the following prerequisites are met before proceeding:- Docker installed on your machine
- Gateway v5.2.0 or higher
Steps for Configuration
-
Create the Docker-Compose File for Jaeger
Save the following YAML configuration in a file named docker-compose.yml:
This configuration sets up Jaeger’s all-in-one instance with ports exposed for Jaeger UI and the OTLP receiver.
-
Deploy a Test API Definition
If you haven’t configured any APIs yet, follow these steps:
- Create a subdirectory named apps in the current directory.
- Create a new file named
apidef-hello-world.json. - Copy the provided simple API definition below into the
apidef-hello-world.jsonfile:
This API definition sets up a basic API named Hello-World for testing purposes, configured to proxy requests tohttp://httpbin.org/. -
Run Tyk Gateway OSS with OpenTelemetry Enabled
To run Tyk Gateway with OpenTelemetry integration, extend the previous Docker Compose file to include Tyk Gateway and Redis services. Follow these steps:
- Add the following configuration to your existing docker-compose.yml file:
- Navigate to the directory containing the docker-compose.yml file in your terminal.
- Execute the following command to start the services:
-
Explore OpenTelemetry Traces in Jaeger
- Start by sending a few requests to the API endpoint configured in Step 2:
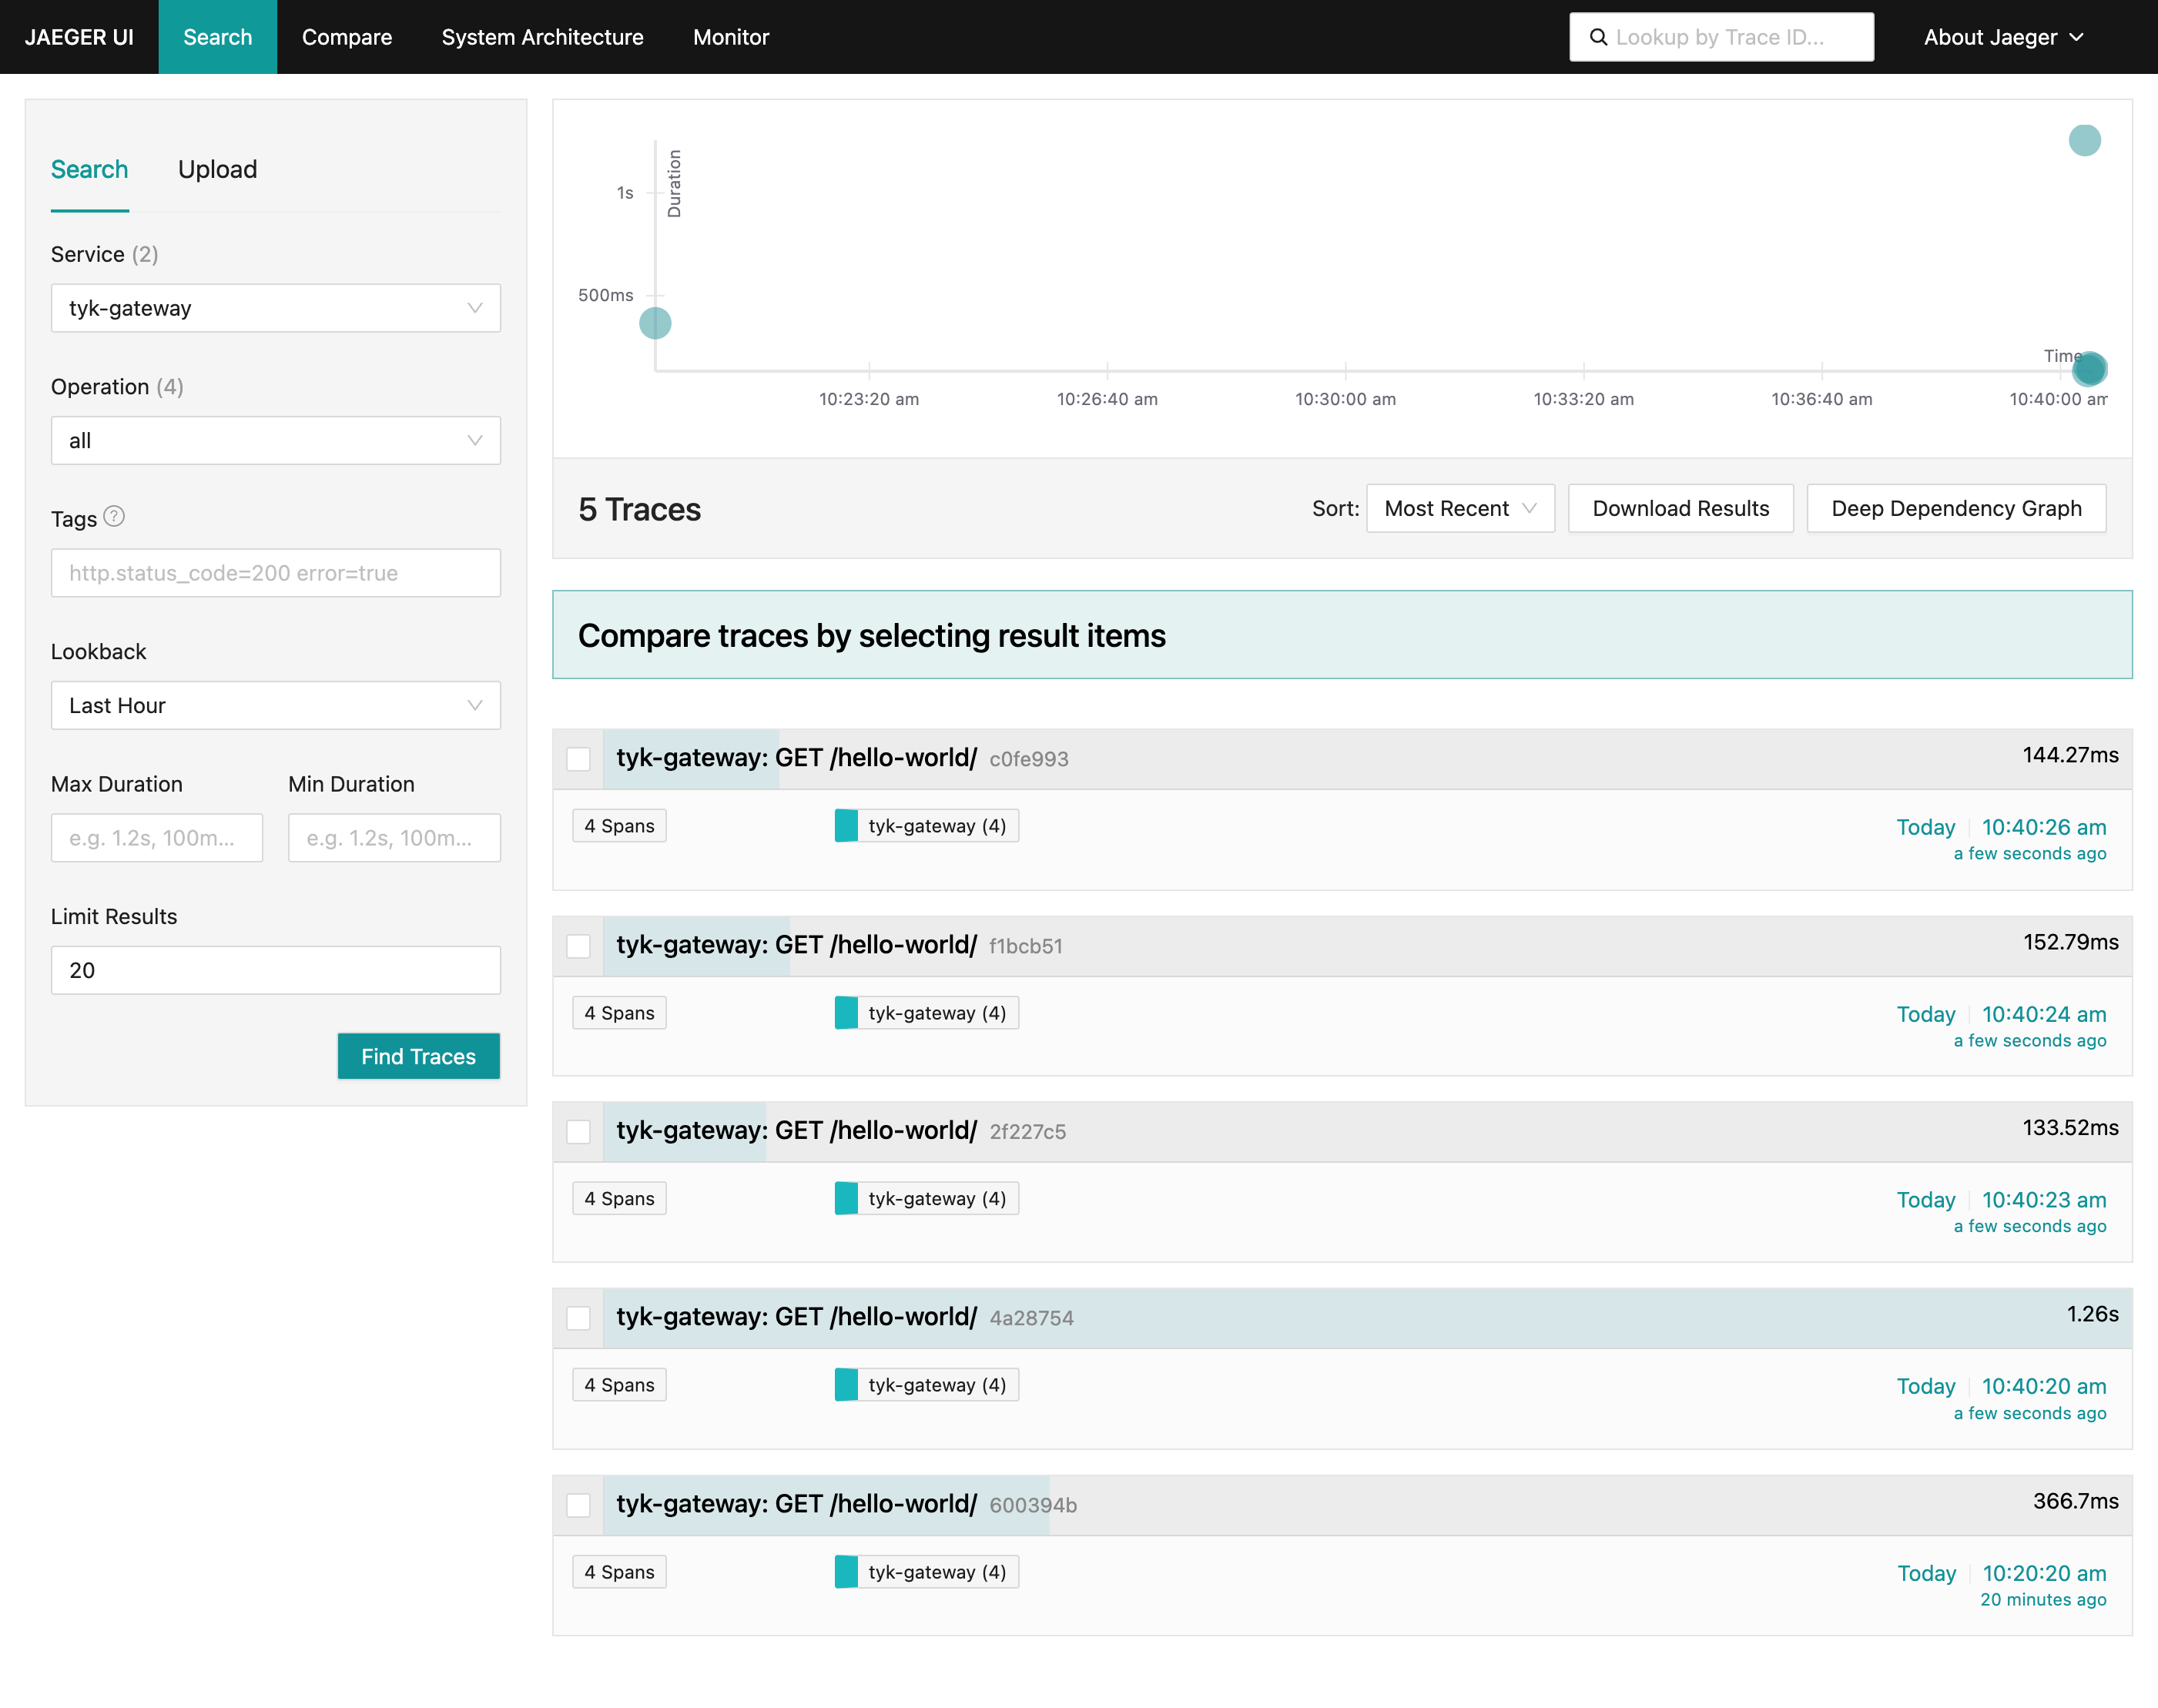
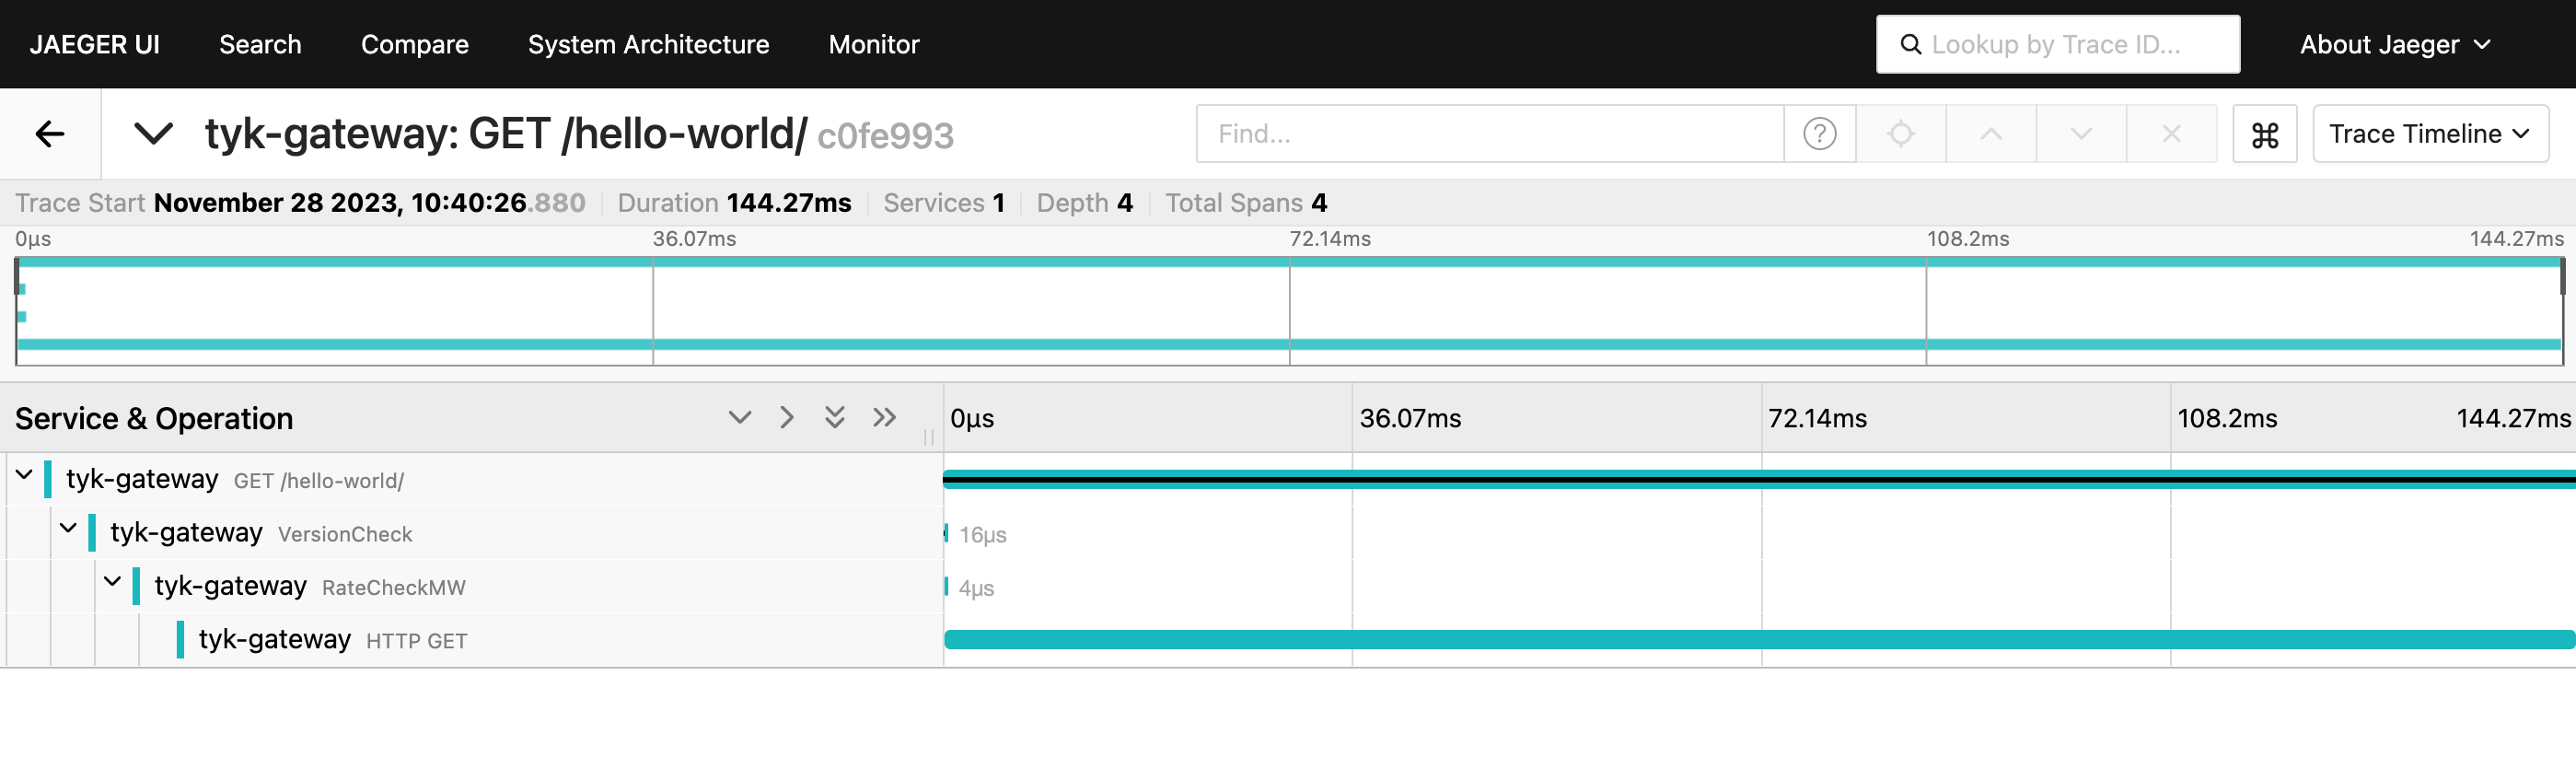
- Access Jaeger at http://localhost:16686.
- In Jaeger’s interface:
- Select the service named tyk-gateway.
- Click the Find Traces button.
Using Kubernetes
This guide explains how to set up Jaeger to ingest OpenTelemetry traces via the OpenTelemetry Collector (OTel Collector) using Kubernetes. We will cover the installation of essential components, their configuration, and the process of ensuring seamless integration. For Docker instructions, please refer to How to integrate with Jaeger on Docker.Prerequisites
Ensure the following prerequisites are in place before proceeding:Steps for Configuration
-
Install Jaeger Operator
For the purpose of this tutorial, we will use jaeger-all-in-one, which includes the Jaeger agent, collector, query, and UI in a single pod with in-memory storage. This deployment is intended for development, testing, and demo purposes. Other deployment patterns can be found in the Jaeger Operator documentation.
- Install the cert-manager release manifest (required by Jaeger)
- Install Jaeger Operator.
- After the Jaeger Operator is deployed to the
observabilitynamespace, create a Jaeger instance:
-
Deploy Tyk Gateway with OpenTelemetry Enabled using Helm
To install or upgrade Tyk Gateway OSS using Helm, execute the following commands:
Please make sure you are installing Redis versions that are supported by Tyk. Please refer to Tyk docs to get list of supported versions.
gateway-svc-tyk-oss-tyk-gateway at port 8080 and exports the OpenTelemetry traces to the jaeger-all-in-one-collector service.
-
Deploy Tyk Operator
Deploy Tyk Operator to manage APIs in your cluster:
-
Deploy a Test API Definition
Save the following API definition as
apidef-hello-world.yaml:To apply this API definition, run the following command:This step deploys an API definition named hello-world using the provided configuration. It enables a keyless HTTP API proxying requests tohttp://httpbin.org/and accessible via the path/hello-world. -
Explore OpenTelemetry traces in Jaeger
You can use the kubectl
port-forward commandto access Tyk and Jaeger services running in the cluster from your local machine’s localhost: For Tyk Gateway:For Jaeger:Begin by sending a few requests to the API endpoint configured in step 2:Next, navigate to Jaeger onhttp://localhost:16686, select the ´service´ called ´tyk-gateway´ and click on the button ´Find traces´. You should see traces generated by Tyk: