

Overview
Tyk Gateway 5.13+ exports metrics natively via OTLP, removing the need for Tyk Pump as an intermediary for Prometheus-based observability: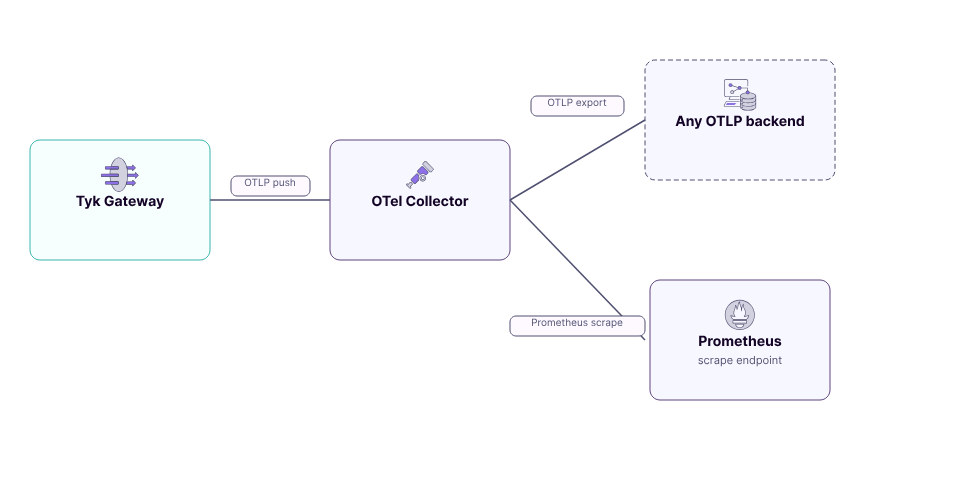
This guide covers two categories of metrics:
- RED metrics: What your APIs are doing right now: request rate, error classification, and latency decomposition.
- Gateway health metrics: What the Gateway process itself is doing: memory, goroutines, and configuration state.
Prerequisites
- Tyk Gateway 5.13 or later
- OpenTelemetry metrics enabled (
opentelemetry.metrics.enabled: trueintyk.conf, orTYK_GW_OPENTELEMETRY_METRICS_ENABLED=true) - An OTel Collector configured to export to Prometheus (or a compatible OTLP backend)
- Prometheus scraping the Collector’s metrics endpoint
Key thresholds at a glance
Use these as starting points and adjust based on your API’s traffic profile and SLOs.
Core RED Metrics
Request Rate
Request rate tells you how much traffic the Gateway is handling. Sudden drops indicate that requests are not reaching the Gateway: DNS failures, network partitions between clients and the gateway, or client-side misconfiguration. Metrics:
What are normal request rate thresholds?
There is no universal baseline. Request rate varies by deployment. Establish a baseline over 7 days and alert on deviations greater than ±30% from the rolling average for the same hour of the prior week.
A more actionable check is to watch for a sudden drop to near-zero on a previously active API:
Error Rate
Error rate is the primary SLI for API availability. Tyk classifies every non-success response with aresponse_flag: a two- or three-character code that tells you exactly where and why a request failed, before you read a single log line.
Metrics:
Response flag reference (full list: Error classification):
What error rate thresholds should I set?
A non-2xx rate below 2% is a healthy baseline for most APIs with authenticated consumers. Alert at 10% over a 5-minute window for most APIs. For payment or health endpoints, tighten to 1%.
Calculate the current error rate:
Check
upstream_latency in logs first. If it is 0, the request never left the Gateway: the error originated in auth, quota, or rate-limit middleware. If upstream_latency > 0 and response_flag = URS, the upstream itself failed.Latency
Tyk exports three latency histograms that let you decompose end-to-end response time into what the Gateway spent versus what the upstream spent. Use them together. Any one alone gives an incomplete picture. Metrics:
Histogram bucket boundaries (all three metrics, in seconds):
Latency isolation rule: If
http_server_request_duration_seconds p95 is high but tyk_gateway_request_duration_seconds p95 is < 10ms, the Gateway is healthy: the latency is upstream. If both histograms are elevated, the gateway is the bottleneck.Gateway Health Metrics
Gateway health metrics reflect the internal state of the Gateway process itself, independent of API traffic. They are available whenopentelemetry.metrics.enabled: true (Tyk Gateway 5.13+) and can be disabled independently with runtime_metrics: false if you only need RED signals.
Memory
Metrics:
What memory thresholds should I set?
There is no fixed absolute limit. Thresholds depend on how many APIs are loaded. Alert on rate of growth instead:
go_memory_used_bytes{go_memory_type="other"}growing > 10% per hour with stable traffic and stable API count → investigate- If you set
GOMEMLIMIT, alert whengo_memory_used_bytes{go_memory_type="other"}exceeds 85% ofgo_memory_limit_bytes; GC will become aggressive and start impacting request latency
Goroutines
Metrics:
What goroutine thresholds should I set?
A healthy Gateway at moderate load runs with 500–2,000 goroutines. Alert at 5,000 goroutines sustained for 10 minutes. A one-time spike during a traffic burst is normal; a monotonically increasing trend over hours is not.
Configuration State
Metrics:
What to watch for:
- A sudden drop in
tyk_gateway_apis_loaded(not a gradual decrease) typically means a failed sync from the Dashboard or an accidental bulk delete. Alert if the value drops by more than 10% in a single scrape interval. - A steady increase in
tyk_gateway_config_reload_totalat a rate faster than your deployment cadence suggests a reload loop; investigate what is triggering reloads. - Reload duration p95 growing over time suggests the API definition set is expanding and reload times need to be accounted for in SLOs.
Common Anti-Patterns
Auth Failure Surge
A sudden spike inAMF or AKI response flags means clients are failing authentication. Sustained rates above 0.1 req/s (6 per minute) warrant investigation.
Identify:
AMF and AKI are identical from a consumer-impact perspective: both result in the request never reaching the upstream. The distinction matters for root cause: AMF means the client didn’t send a key at all; AKI means the client sent a key that Tyk cannot resolve.Cardinality Overflow
The Gateway caps at 2,000 unique attribute combinations per instrument by default (see cardinality control). When this cap is reached, additional data points are recorded withotel.metric.overflow = true rather than creating new time series.
Detect:
Cardinality overflow does not drop data. The aggregate counts are preserved in the overflow bucket. You will see correct totals but lose the ability to break the data down by the overflowing dimension combination.
Retry Storm
Client retries without exponential backoff amplify an upstream failure.RLT (429) responses trigger more retries, which hit rate limits, which trigger more retries, a self-reinforcing loop that increases load on both the Gateway and the upstream.
Identify:
A retry storm shows RLT rate climbing while overall request rate is also climbing:
Set Up Alerting
Prometheus Alertmanager handles alert routing. The Gateway emits Prometheus-compatible metrics via the OTel Collector; alert rules evaluate against those metrics. Configure Prometheus to load alert rules:PromQL Quick Reference
Replace<api_id> with your Tyk API definition ID.
Next Steps
- Enable the OTel pipeline: if you haven’t yet, follow the setup instructions to enable native OTLP export and route signals to your observability backend.
- Try the reference Grafana dashboards: see the observability setup guide for a full modern observability stack (Loki, Grafana, Tempo, Prometheus) with pre-built panels for all the metrics in this guide.
-
Configure Prometheus alerting: copy the alert rules from Set Up Alerting, replace
<api_id>with your real API IDs, save astyk_alerts.yml, and restart Prometheus.