
Documentation Index

Fetch the complete documentation index at: https://tyk.io/docs/llms.txt

Use this file to discover all available pages before exploring further.

This guide explains how to set up Datadog to ingest OpenTelemetry traces via the OpenTelemetry Collector (OTel Collector) using Docker. It follows the reference documentation from Datadog. While this tutorial demonstrates using an OpenTelemetry Collector running in Docker, the core concepts remain consistent regardless of how and where the OpenTelemetry collector is deployed.

Prerequisites

Instructions

Step 1. Configure the OpenTelemetry Collector

Create a new YAML configuration file named otel-collector.yml with the following content:
receivers:
  otlp:
    protocols:
      grpc:
        endpoint: 0.0.0.0:4317
processors:
  batch:
    send_batch_max_size: 100
    send_batch_size: 10
    timeout: 10s
exporters:
  datadog:
    api:
      site: "YOUR-DATADOG-SITE"
      key: "YOUR-DATAGOG-API-KEY"
service:
  pipelines:
    traces:
      receivers: [otlp]
      processors: [batch]
      exporters: [datadog]

Step 2. Configure a test API

If you don’t have any APIs configured yet, create a subdirectory called apps in the current directory. Create a new file apidef-hello-world.json and copy this very simple API definition for testing purposes:
{ 
    "name": "Hello-World",
    "slug": "hello-world",
    "api_id": "Hello-World",
    "org_id": "1",
    "use_keyless": true,
    "detailed_tracing": true,
    "version_data": {
      "not_versioned": true,
      "versions": {
        "Default": {
          "name": "Default",
          "use_extended_paths": true
        }
      }
    },
    "proxy": {
      "listen_path": "/hello-world/",
      "target_url": "http://httpbin.org/",
      "strip_listen_path": true
    },
    "active": true
}

Step 3. Create the Docker-Compose file

Save the following YAML configuration to a file named docker-compose.yml.
version: "2"
services:
  # OpenTelemetry Collector Contrib
  otel-collector:
    image: otel/opentelemetry-collector-contrib:latest
    volumes:
      - ./otel-collector.yml:/etc/otel-collector.yml
    command: ["--config=/etc/otel-collector.yml"]
    ports:
      - "4317" # OTLP gRPC receiver
    networks:
      - tyk
  
  # Tyk API Gateway, open-source deployment
  tyk:
    image: tykio/tyk-gateway:v5.2
    ports:
      - 8080:8080
    environment:
      - TYK_GW_OPENTELEMETRY_ENABLED=true
      - TYK_GW_OPENTELEMETRY_EXPORTER=grpc
      - TYK_GW_OPENTELEMETRY_ENDPOINT=otel-collector:4317
    volumes:
      - ./apps:/opt/tyk-gateway/apps
    depends_on:
      - redis
    networks:
      - tyk

  redis:
    image: redis:4.0-alpine
    ports:
      - 6379:6379
    command: redis-server --appendonly yes
    networks:
      - tyk

networks:
  tyk:
To start the services, go to the directory that contains the docker-compose.yml file and run the following command:
docker-compose up

Step 4. Explore OpenTelemetry traces in Datadog

  1. Send a few requests to the API endpoint configured in step 2:
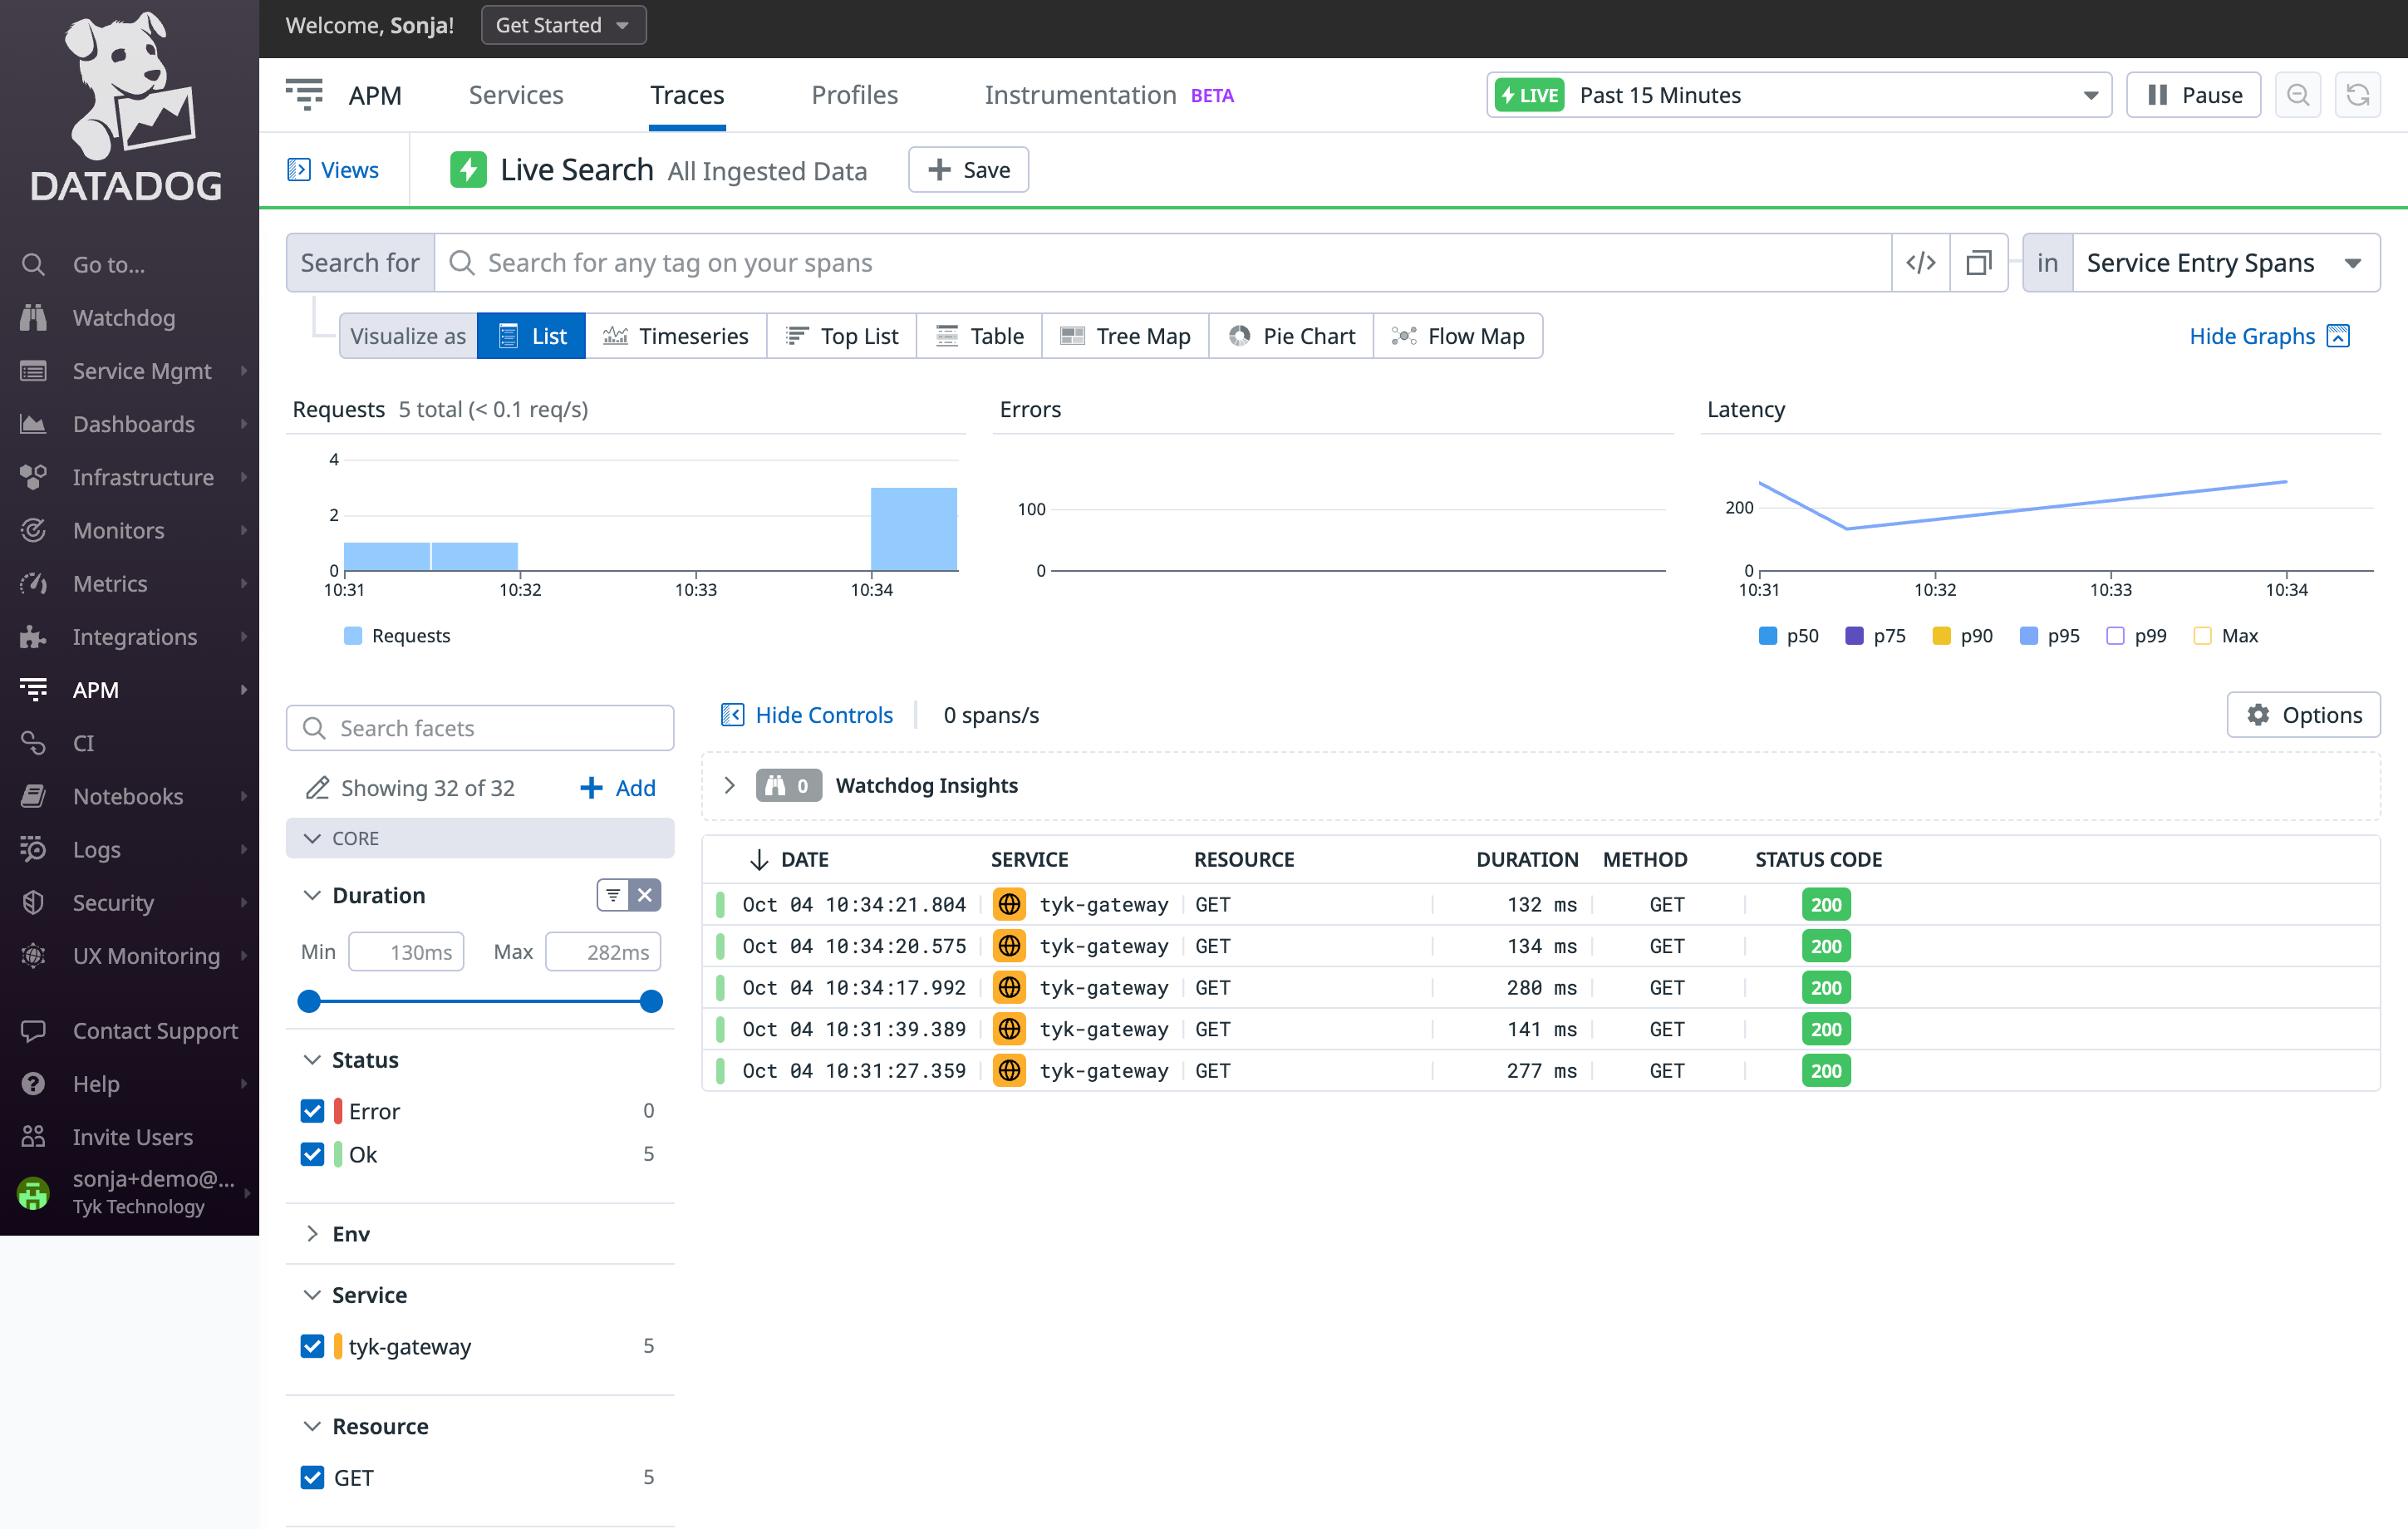
 http://localhost:8080/hello-world/
  2. Log in to Datadog and navigate to the APM / Traces section. Here, you should start observing traces generated by Tyk:
Tyk API Gateway distributed trace in Datadog
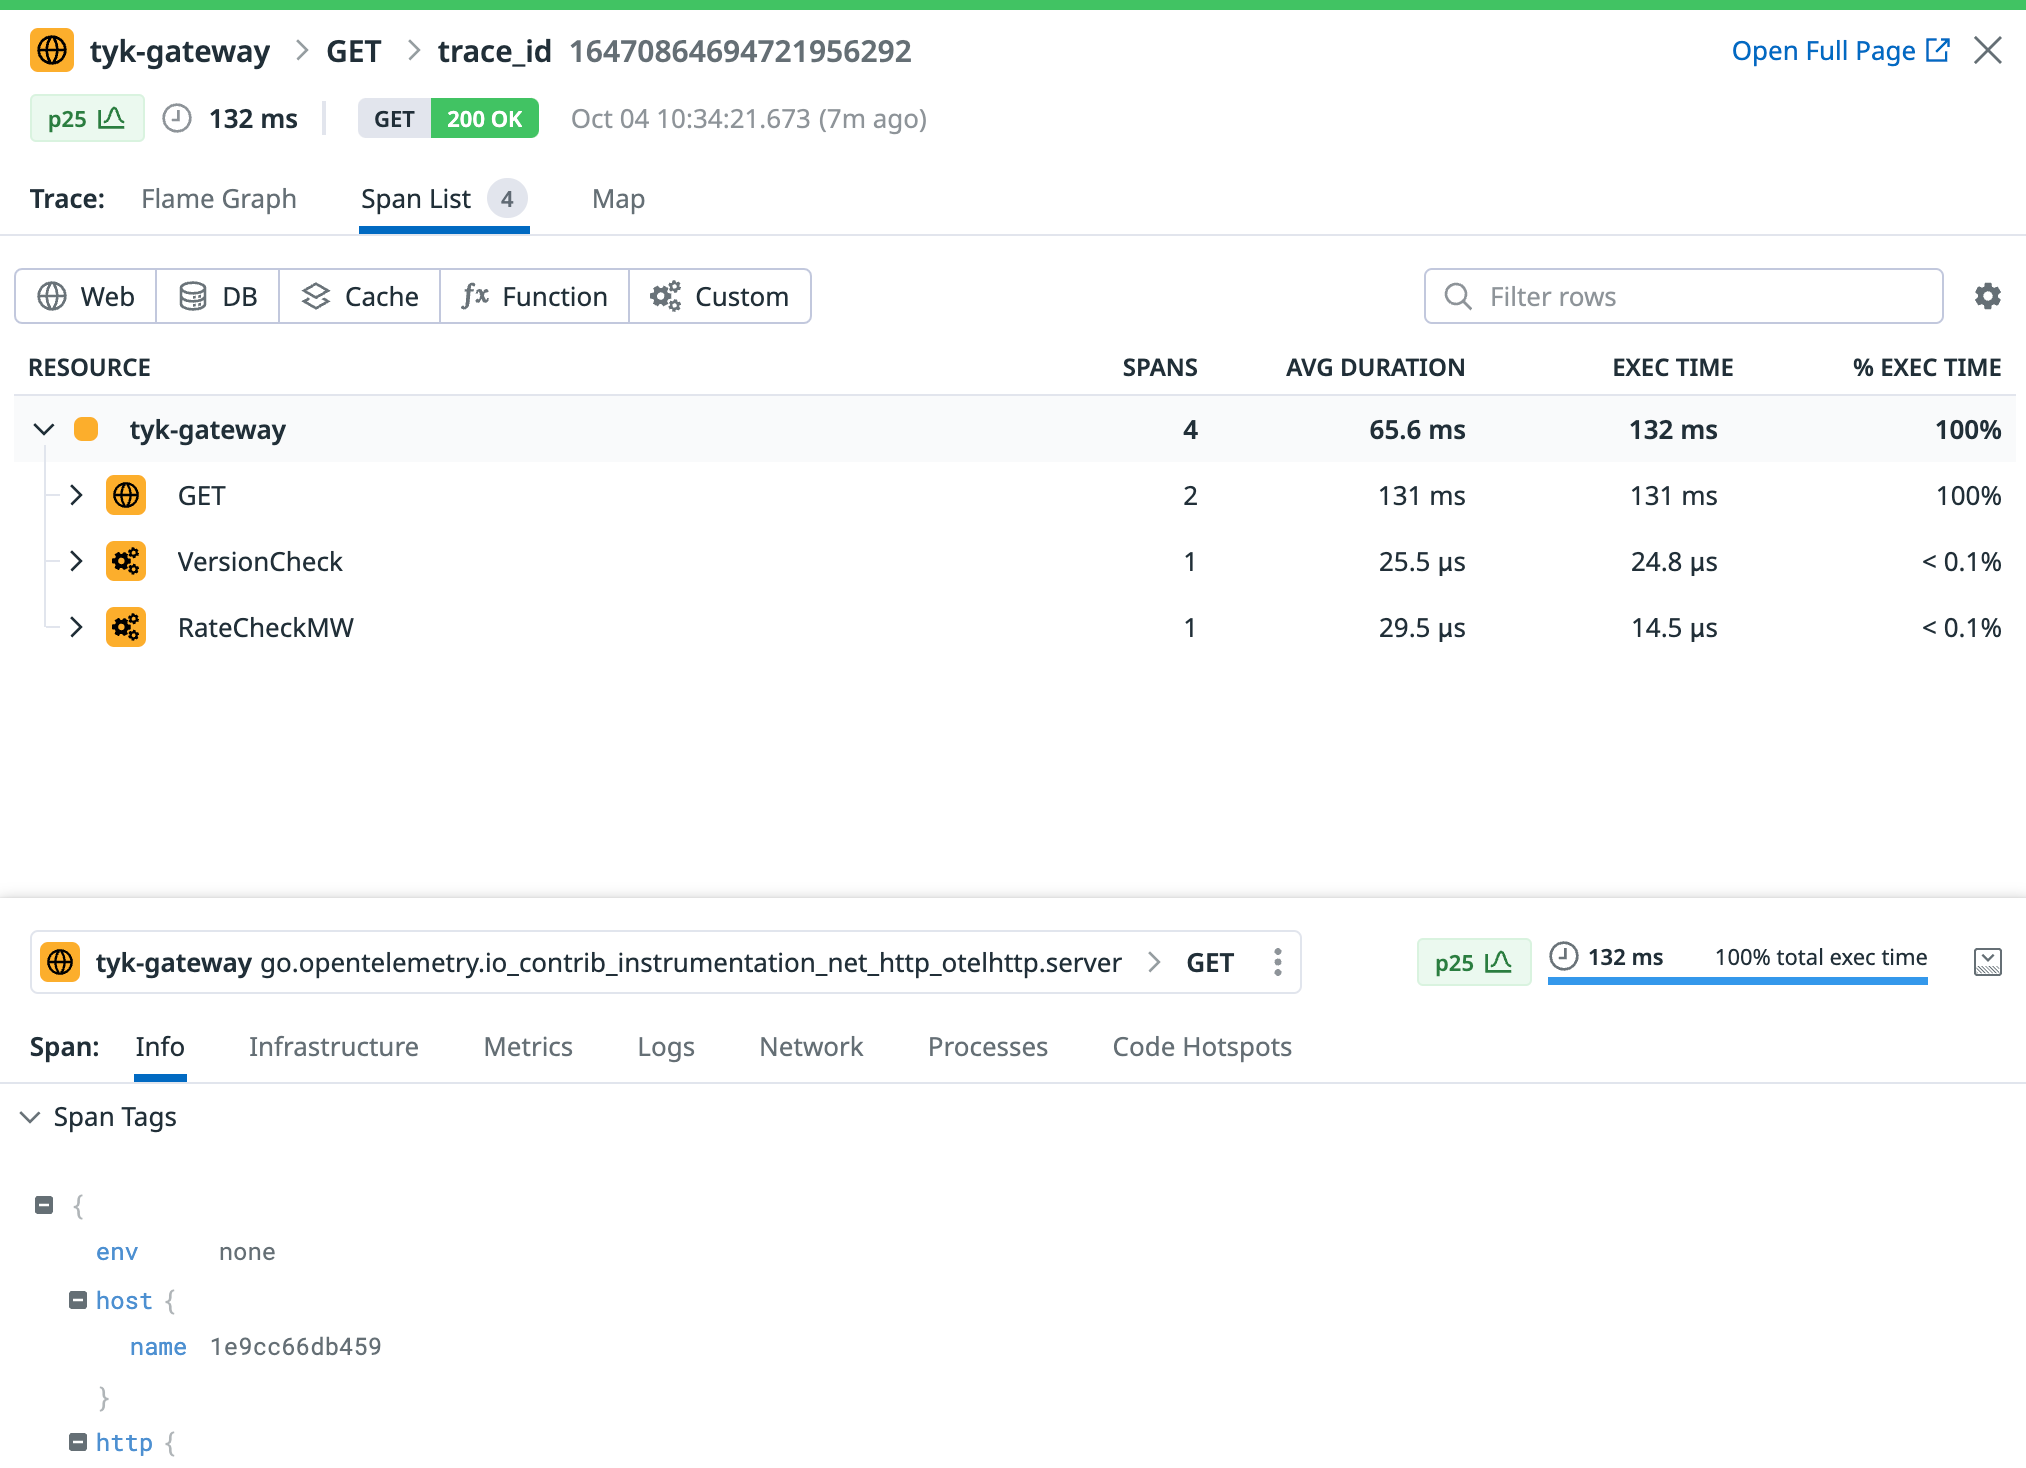
  1. Click on a trace to view all its internal spans:
Tyk API Gateway spans in Datadog
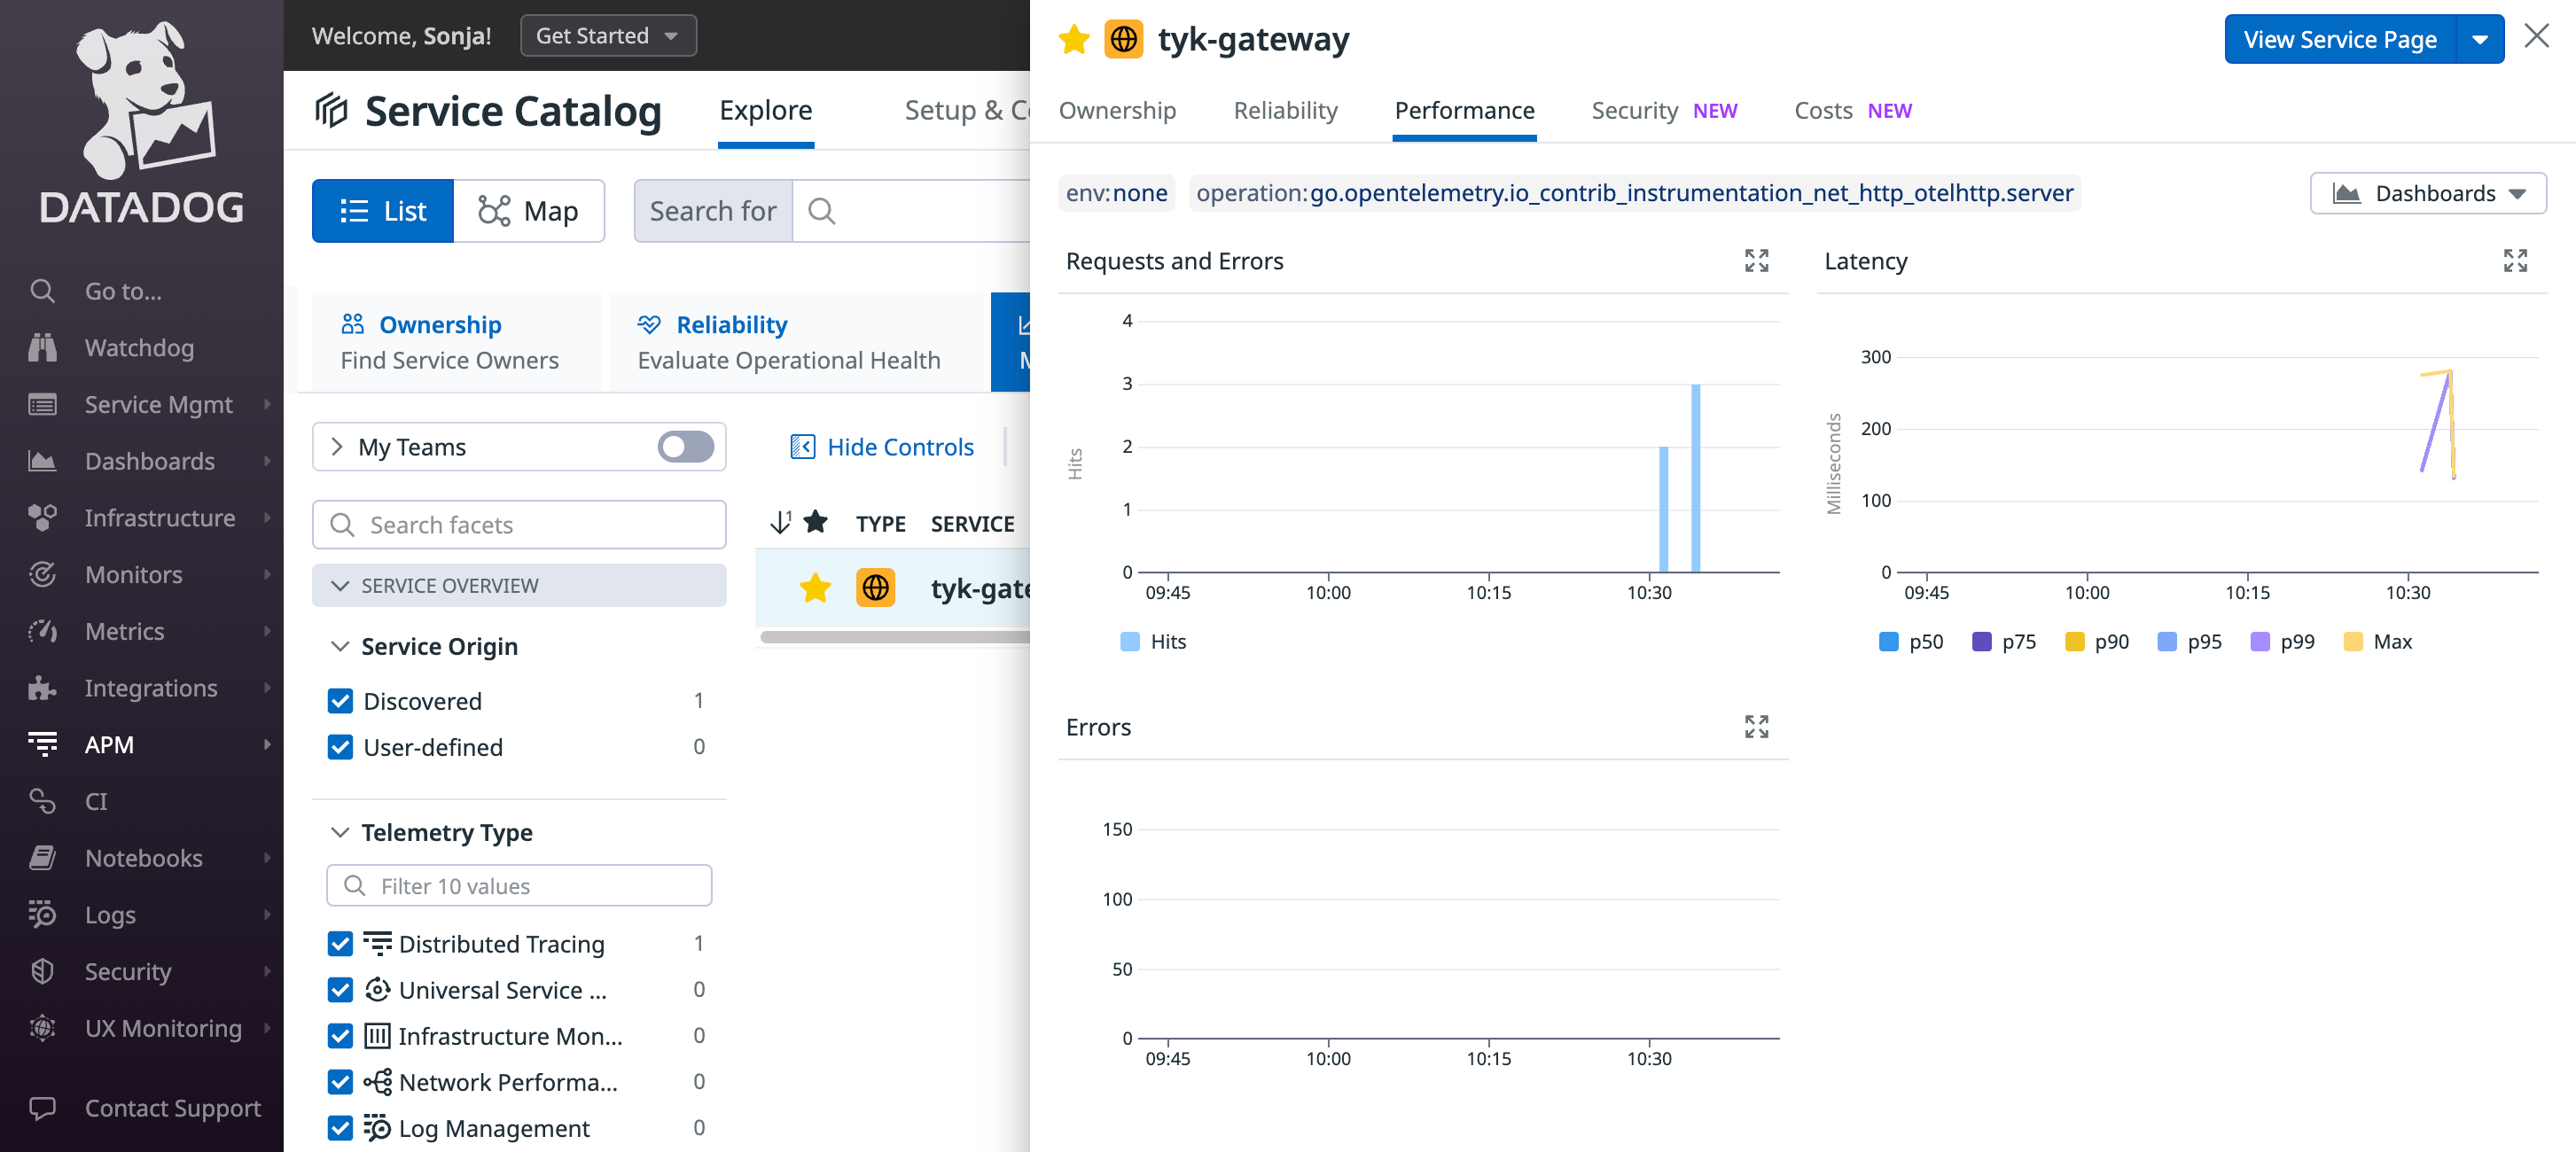
  1. Datadog will generate a service entry to monitor Tyk Gateway and will automatically compute valuable metrics using the ingested traces.4
Tyk API Gateway service monitoring in Datadog

Troubleshooting

If you do not see any traces from Tyk appearing in Datadog, consider the following steps for resolution:
  • Logging: Examine logs from Tyk Gateway and from the OpenTelemetry Collector for any issues or warnings that might provide insights.
  • Data Ingestion Delays: Be patient, as there could be some delay in data ingestion. We configured a 10 second timeout in the batch processing of the OpenTelemetry collector in step 1, so give the system time to process the data.