

What Is Dashboard Analytics
Tyk Dashboard presents built-in analytics giving visibility of the traffic passing through your APIs. It covers two levels of visibility, each gated by its own Dashboard permission:- Traffic Analytics (
analytics:read): graphs and breakdowns of request volume, error rates, and latency, sliced by dimensions such as API, access key, or OAuth client. - Log Browser (
log:read): inspect individual requests and responses.
Two Kinds of Data
Traffic Analytics and the Log Browser need different data, and can be enabled independently of each other:
Aggregated analytics is cheaper to store and query, since it’s summarized, while traffic logs preserve full request detail at the cost of storage volume. Many deployments enable both.
How Aggregation Works
Aggregation calculates hourly analytics from traffic logs, grouped into a fixed set of dimensions, offloading this processing from Tyk Dashboard and reducing storage compared to keeping every traffic log:track_path decides whether an endpoint is broken out individually in the Activity by Endpoint breakdown above; see Controlling Which Endpoints Are Tracked below for what sets it.
Additional custom aggregation is also supported for users requiring data aggregated by different dimensions.
Pre-Computed vs Live Aggregation
An Aggregate Pump is not the only way to get this aggregated data. Tyk Dashboard can also compute it itself: on every request to a Traffic Analytics screen, live, it runs the equivalent aggregation directly against the traffic log collection or table (a MongoDB aggregation pipeline, or a SQL query), and discards the result once the screen has rendered. Which of the two Tyk Dashboard uses is controlled by a single setting,enable_aggregate_lookups:
true: Tyk Dashboard reads pre-computed aggregated analytics, written by an Aggregate Pump.false(the default): Tyk Dashboard computes the aggregation live instead, regardless of whether an Aggregate Pump is deployed and running; any aggregated analytics it computes and stores go unread.
- It runs inside Tyk Dashboard itself, competing for the same CPU and database resources, rather than on a dedicated process built for this job (Tyk Pump). This can make Traffic Analytics screens feel slower to load, especially at higher traffic volumes or with several users viewing the Dashboard UI at once.
- It repeats the same aggregation on every screen load, rather than once per hour, so the cost grows with the volume of traffic logs it has to scan.
enable_aggregate_lookups: true is the recommended approach. It also means you can cap or evict old traffic logs without losing the historical data behind these screens, since the aggregated summaries are preserved separately.
For MCP proxy traffic, there’s no working live fallback: live computation has no MCP-specific aggregation logic. If you’re using MCP Analytics, running an MCP Aggregate Pump with
enable_aggregate_lookups: true is required, not just recommended.enable_aggregate_lookups doesn’t apply to the Activity by Graph screen. That screen is fed by a dedicated tyk_graph_aggregated table, written by the SQL GraphQL Aggregate Pump, which Tyk Dashboard’s Postgres driver always queries directly. There’s no live-computation fallback and no config flag for this screen, and it’s PostgreSQL-only.Where the Data Comes From
Tyk Gateway generates a traffic log for every request and writes it to Redis. See Traffic Logs for how and when these are generated, and the full field reference.What Data Is Captured
The Traffic Log Field Reference documents every field. The rest of this section covers what specifically affects Dashboard Analytics: per-endpoint tracking, detailed recording, and custom tags.Controlling Which Endpoints Are Tracked
By default, only some endpoints are broken out individually in the per-endpoint aggregates: Activity by Endpoint, and the per-endpoint breakdowns nested within Activity by Key and Traffic per OAuth Client. Which ones depends on thetrack_path field; see Controlling Which Endpoints Are Tracked on the Traffic Logs page for what sets it.
- Endpoints with Track Endpoint enabled get
track_path: true, and appear individually in these breakdowns. - Endpoints without it get
track_path: false. Their traffic is excluded from these per-endpoint breakdowns specifically, but still counted in every other aggregate dimension: API totals, error codes, API versions, key/OAuth-client counts, geo, and tags.
track_all_paths: true on an Aggregate Pump to override this and include every endpoint in these breakdowns, regardless of whether Track Endpoint is enabled on it.
Track Endpoint only affects this aggregated per-endpoint breakdown. It has no effect on traffic logs or the Log Browser.
Detailed Recording
Detailed recording, configured at the Gateway, includes the full request and response, in wire format and base64-encoded, in the traffic log’sraw_request and raw_response fields. Enabling it significantly increases record size and storage requirements; Tyk Cloud users are subject to the subscription’s storage quota.
Custom Aggregation Tags
Aggregation groups traffic logs by a fixed set of standard fields. When those don’t capture the dimension you care about, for example when several sub-accounts or environments share a single API key so the standardapi_key aggregation can’t separate them, Tyk Gateway can tag traffic logs with the value of any HTTP request header, such as X-Account-ID. Tyk Pump’s aggregate pumps then compute an hourly aggregate for each distinct tag value observed, the same way they do for the standard fields.
Because every distinct tag value gets its own aggregate bucket, tagging a header whose value is unique per request, such as a timestamp or request ID, creates one bucket per request: no aggregation benefit, just storage growth. Tyk Pump logs a warning if it detects this happening.
You might also tag a header you never intended to aggregate at all, for example a request ID useful for finding one specific transaction in the Log Browser, but meaningless as an aggregate dimension.
In both cases, you can add the tag, or its prefix, to the aggregate pump type’s ignore_tag_prefix_list setting. This only affects aggregation: the tag itself is still recorded on the traffic log and remains visible in the Log Browser either way.
Viewing the Aggregated Data
In the Tyk Dashboard UI, use the filter by tag option on the API Activity Dashboard to see the aggregate graphs for a specific tag value. Programmatically, pass the tag as a tags parameter to the Dashboard API’s analytics endpoints.
GraphQL-Specific Detail
Traffic logs for GraphQL APIs carry additional fields; see GraphQL Fields on the Traffic Logs page. This data is not currently surfaced in Tyk Dashboard; it’s stored for export to external tools. See the Mongo GraphQL Pump and SQL GraphQL Pump sections of Control Plane Pumps for configuration.MCP-Specific Detail
Traffic logs for MCP proxy requests carry additional fields; see MCP Fields on the Traffic Logs page. See MCP Analytics for how Tyk Dashboard surfaces this data.How Data Reaches Tyk Dashboard
How that data actually reaches Tyk Dashboard depends on your deployment topology. Tyk Gateway’s side of the job, generating the traffic log and writing it to Redis, is identical either way; what differs is what reads it next. In a combined control and data plane (thetyk-stack chart, no Tyk MDCB), Tyk Pump reads directly from that Redis instance and writes straight to the persistent database (MongoDB or SQL), forwarding traffic logs, aggregated analytics, or both, in parallel:
In a distributed deployment, with separate control and data planes connected via Tyk MDCB, the Hybrid Pump (the pump type that runs on each data plane) reads from its own local Redis and forwards the data to Tyk MDCB instead, which then writes it to the persistent database in the control plane, either using its own built-in writer or by forwarding it via a Redis queue to a Control Plane Pump:
See Data Plane Pump for that mechanism in full, including which of the two paths applies to traffic logs versus aggregated analytics.
Both paths write to the same MongoDB or SQL collections that Tyk Dashboard reads from.
Storage Backends
Whichever topology you use, Tyk Pump ultimately writes traffic logs and aggregated analytics into either MongoDB or SQL (PostgreSQL or MySQL), and Tyk Dashboard reads from that same database.- MongoDB stores each kind of data, traffic logs and aggregated analytics, in its own collection, and can optionally split traffic logs into a separate collection per Organisation.
- SQL also stores each kind of data in its own table, but has no per-Organisation split: every Organisation’s rows share the same table, distinguished by an indexed
org_idcolumn.
storage section, with analytics and logs sub-sections used to connect it to those same databases; see the Tyk Dashboard configuration reference for the full field list, and Database Management for production sizing guidance.
For guidance on managing the size of that stored data over time, see Analytics Storage Management.
Traffic Analytics
The Tyk Dashboard provides a full set of analytics functions and graphs that you can use to segment and view your API traffic and activity. The Dashboard offers a great way for you to debug your APIs and quickly pin down where errors might be cropping up and for which clients. User Owned Analytics, introduced in Tyk v5.1, can be used to limit the visibility of aggregate statistics to users when API Ownership is enabled. Due to the way that the analytics data are aggregated, not all statistics can be filtered by API and so may be inaccessible to users with the Owned Analytics permission.For the Tyk Dashboard’s analytics functionality to work, you must configure both per-request and aggregated pumps for the database platform that you are using. For more details see the Control Plane Pumps section.
Analyzing API Traffic Activity
API Activity Dashboard
The first screen (and main view) of the Tyk Dashboard will show you an overview of the aggregate usage of your APIs, this view includes the number of hits, the number of errors and the average latency over time for all of your APIs as an average: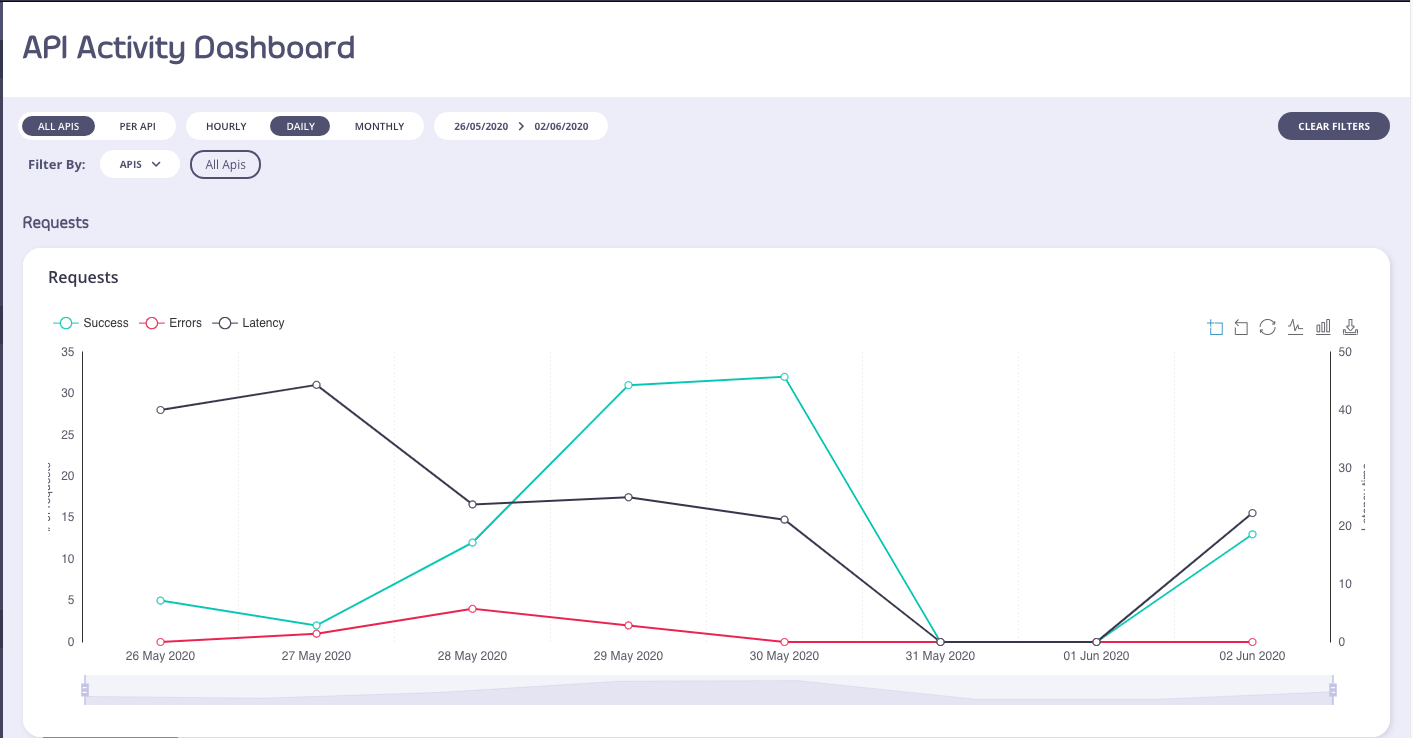
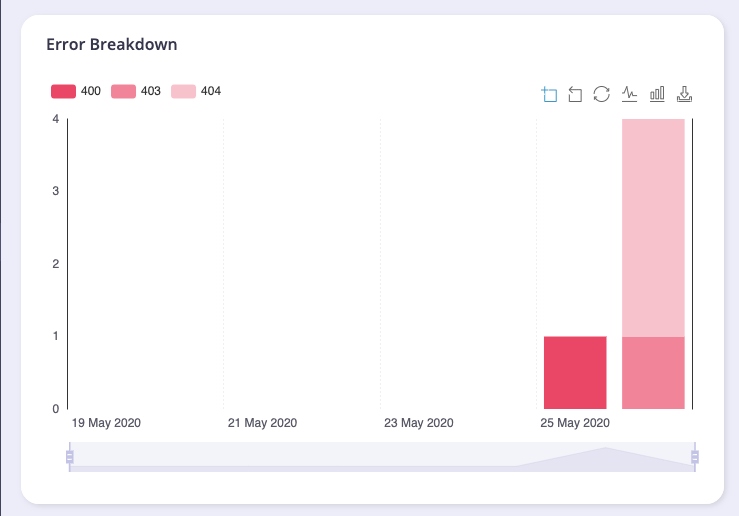
From Tyk v5.1 (and LTS patches v4.0.14 and v5.0.3) the Error Breakdown and Endpoint Popularity charts will not be visible to a user if they are assigned the Owned Analytics permission.
Activity Logs
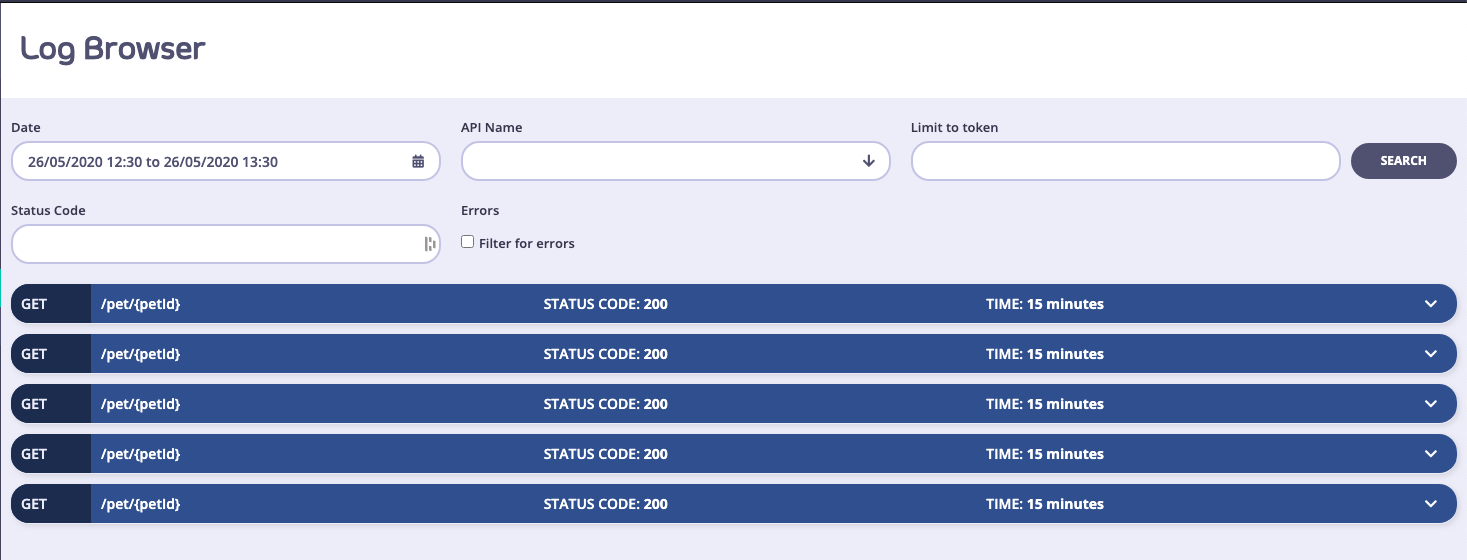
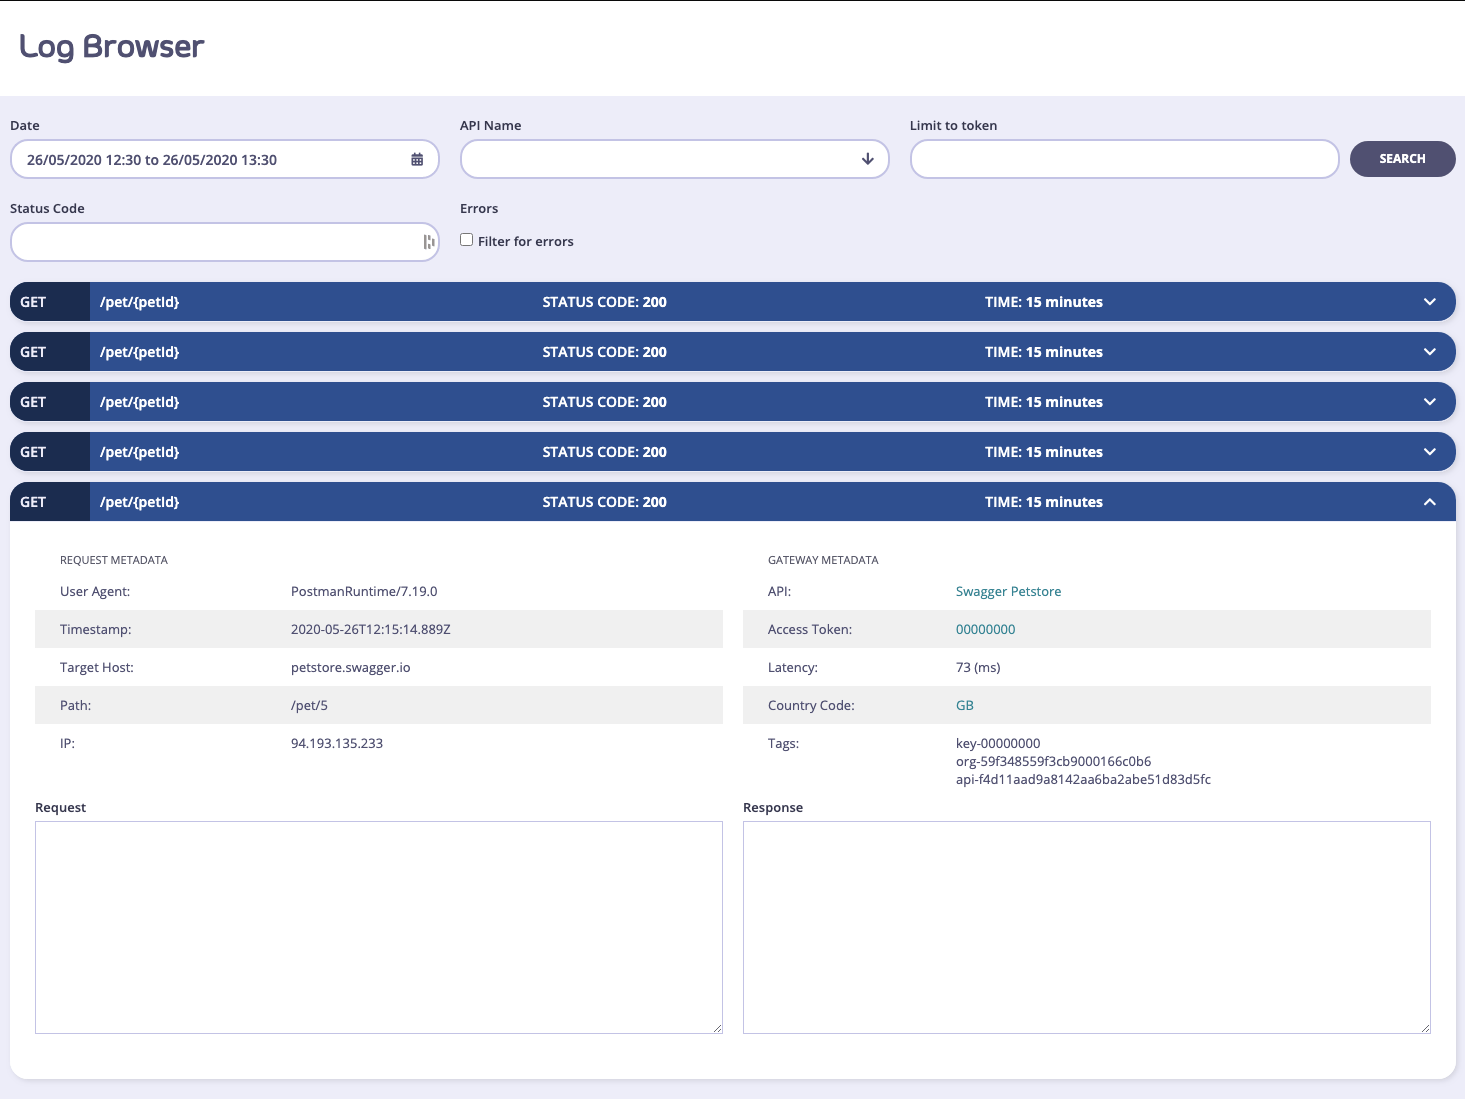
When you look through your Dashboard and your error breakdown statistics, you’ll find that you will want to drill down to the root cause of the errors. This is what the Log Browser is for. The Log Browser will isolate individual log lines in your analytics data set and allow you to filter them by:- API Name
- Token ID (hashed)
- Errors Only
- By Status Code
Self-Managed Installations Option
In an Self-Managed installation, if you have request and response logging enabled, then you can also view the request payload and the response if it is available. To enable request and response logging, please take a look at useful debug modes . A warning on detailed logging: This mode generates a very large amount of data, and that data exponentially increases the size of your log data set, and may cause problems with delivering analytics in bulk to your MongoDB instances. This mode should only be used to debug your APIs for short periods of time.Activity by API
To get a tabular view of how your API traffic is performing, you can select the Activity by API option in the navigation and see a tabular view of your APIs. This table will list out your APIs by their traffic volume and you’ll be able to see when they were last accessed: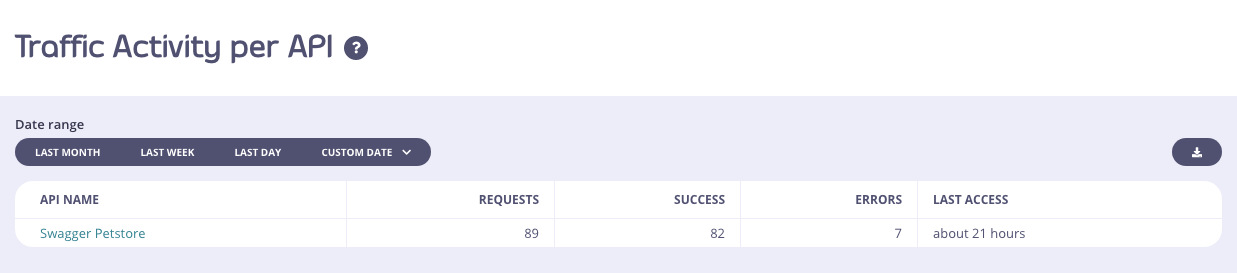
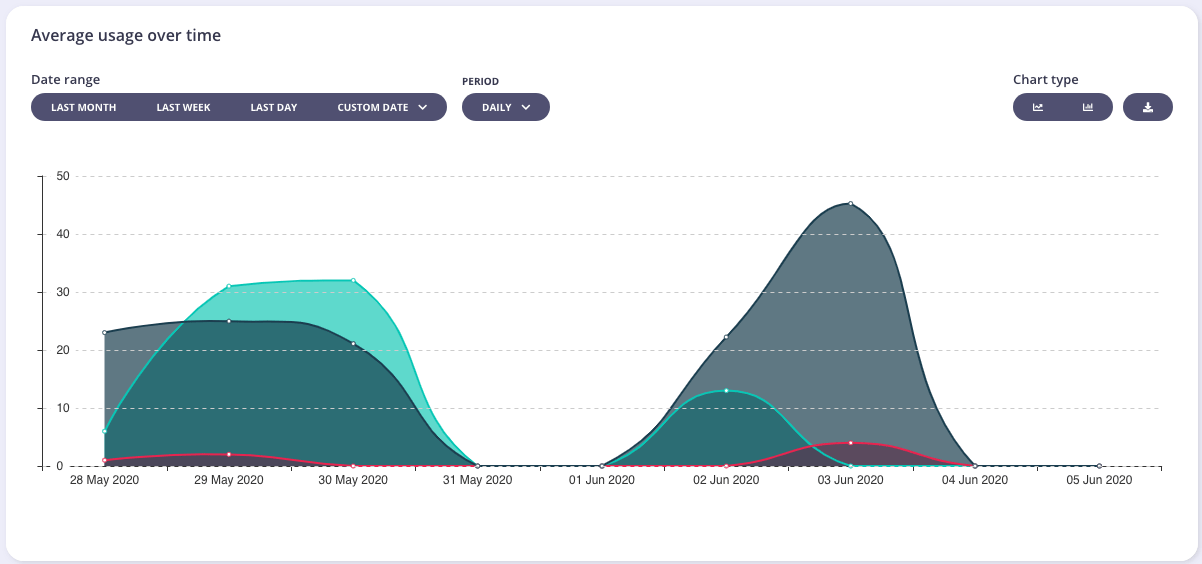
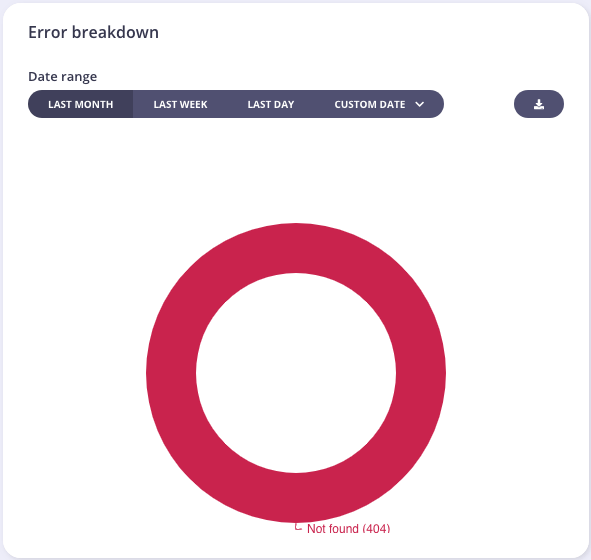
From Tyk v5.1 (and LTS patches v4.0.14 and v5.0.3) the Error Breakdown and Endpoint Popularity charts will not be visible to a user if they are assigned the Owned Analytics permission.
Activity by Key
You will often want to see what individual keys are up to in Tyk, and you can do this with the Activity per Key section of your analytics Dashboard. This view will show a tabular layout of all keys that Tyk has seen in the range period and provide analytics for them: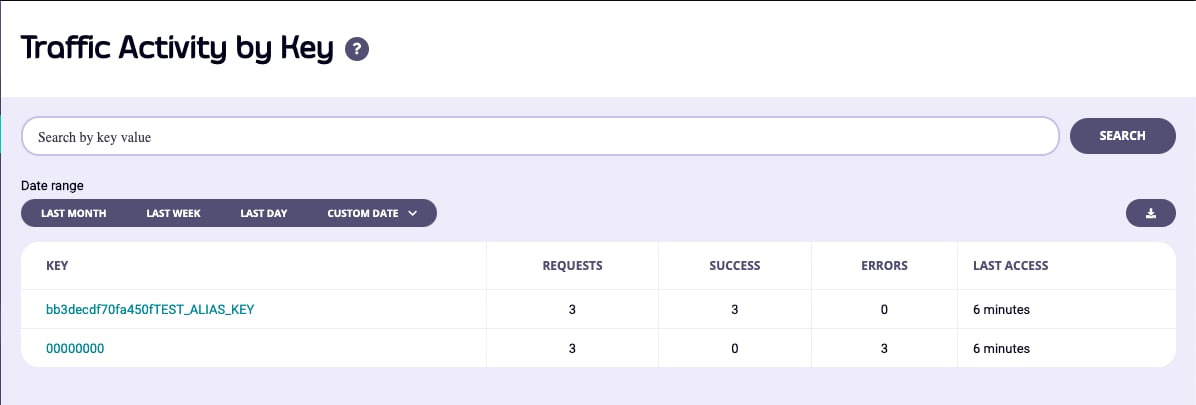
00000000 is an empty token, or an open-request. If you have an API that is open, or a request generates an error before we can identify the API key, then it will be automatically assigned this nil value.
If you select a key, you can get a drill down view of the activity of that key, and the errors and codes that the token has generated:
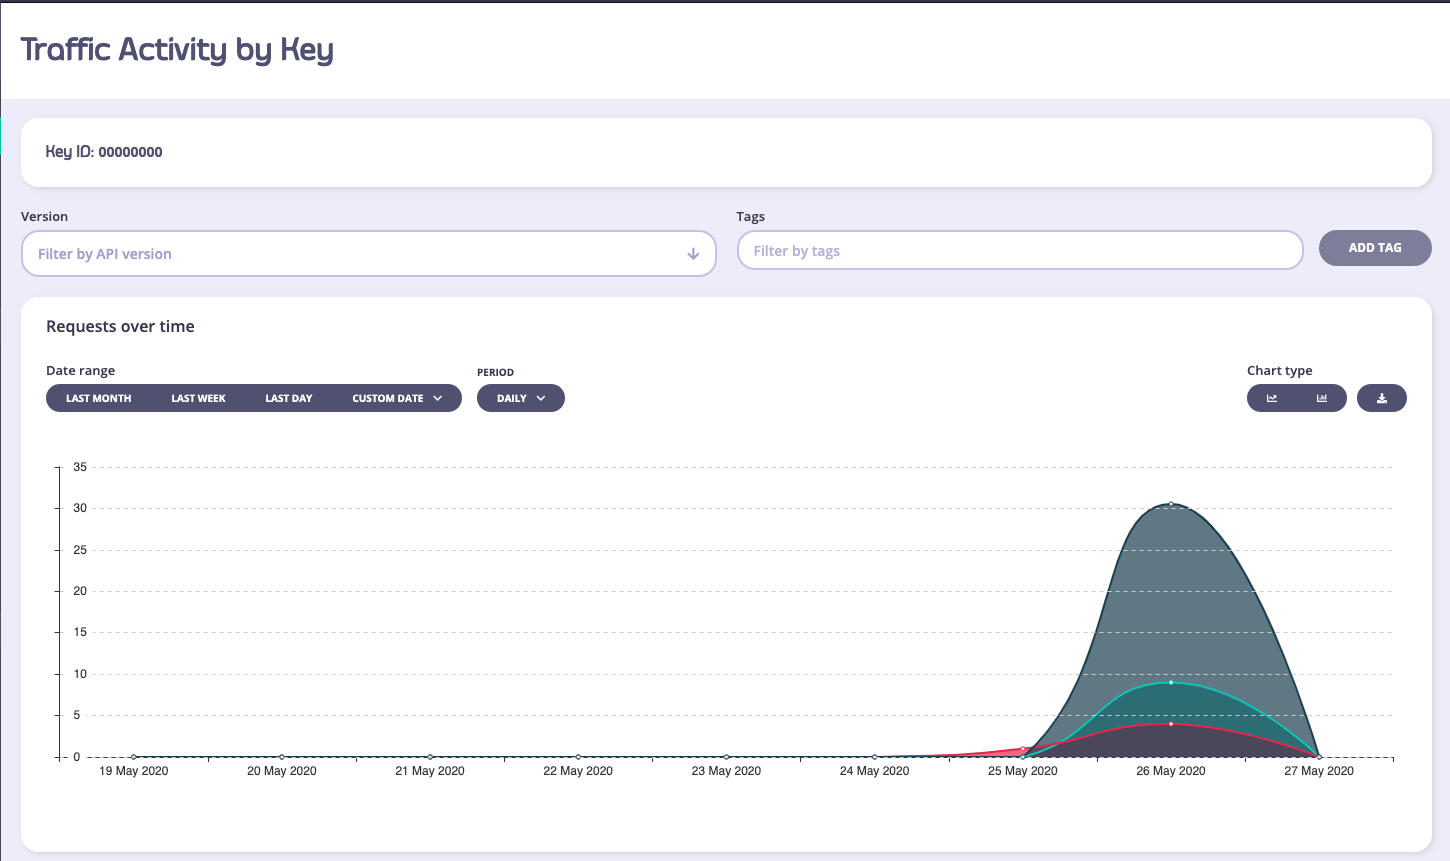
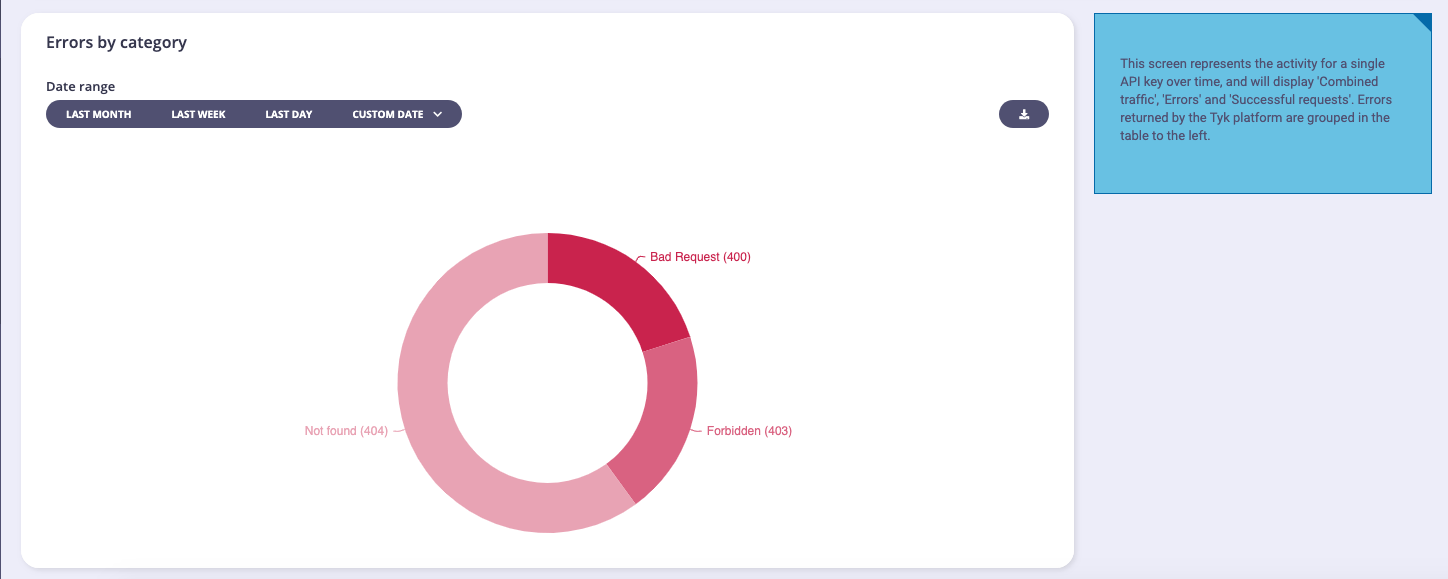
From Tyk v5.1 (and LTS patches v4.0.14 and v5.0.3) the Traffic per Key screen will not be visible to a user if they are assigned the Owned Analytics permission.
Activity by Endpoint
To get a tabular view of how your API traffic is performing at the endpoint level, you can select the Activity by Endpoint option in the navigation and see a tabular view of your API endpoints. This table will list your API endpoints by their traffic volume and you’ll be able to see when they were last accessed: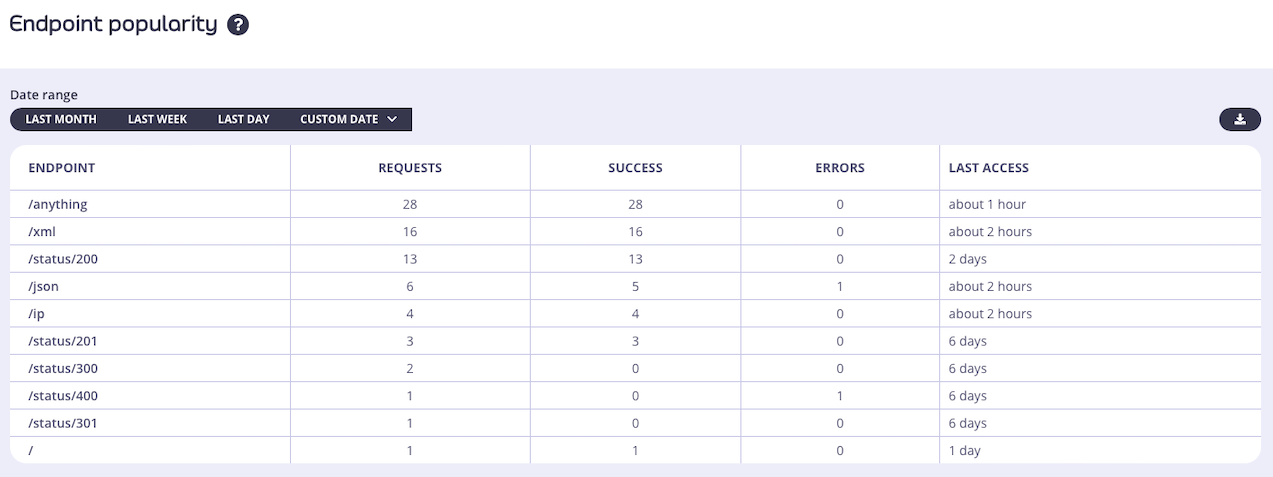
Activity by Graph
The Activity by Graph page provides analytics for your GraphQL APIs (Universal Data Graph / UDG). It allows you to monitor and analyze GraphQL-specific traffic through the following charts and tables:- Popularity by Graph API: Displays the most popular GraphQL APIs based on request volume.
- Errors by Graph API: Shows the error rates and distribution across your GraphQL APIs.
- All Graph APIs: A comprehensive table listing all configured GraphQL APIs and their key metrics.
Activity by Location
Tyk will attempt to record GeoIP based information based on your inbound traffic. This requires a MaxMind IP database to be available to Tyk and is limited to the accuracy of that database. You can view the overview of what the traffic breakdown looks like per country, and then drill down into the per-country traffic view by selecting a country code from the list: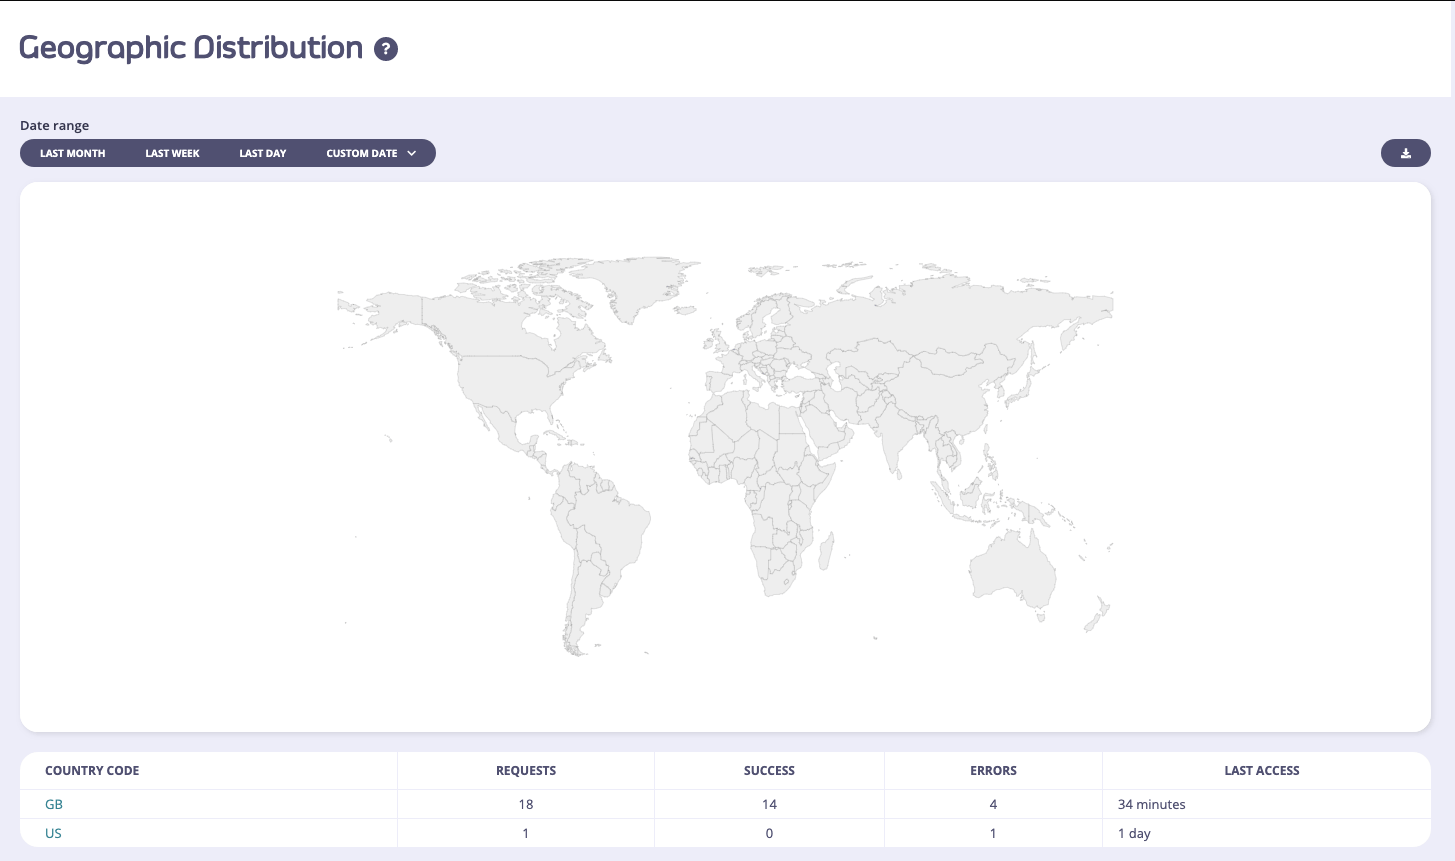
From Tyk v5.1 (and LTS patches v4.0.14 and v5.0.3) the Geographic Distribution screen will not be visible to a user if they are assigned the Owned Analytics permission.
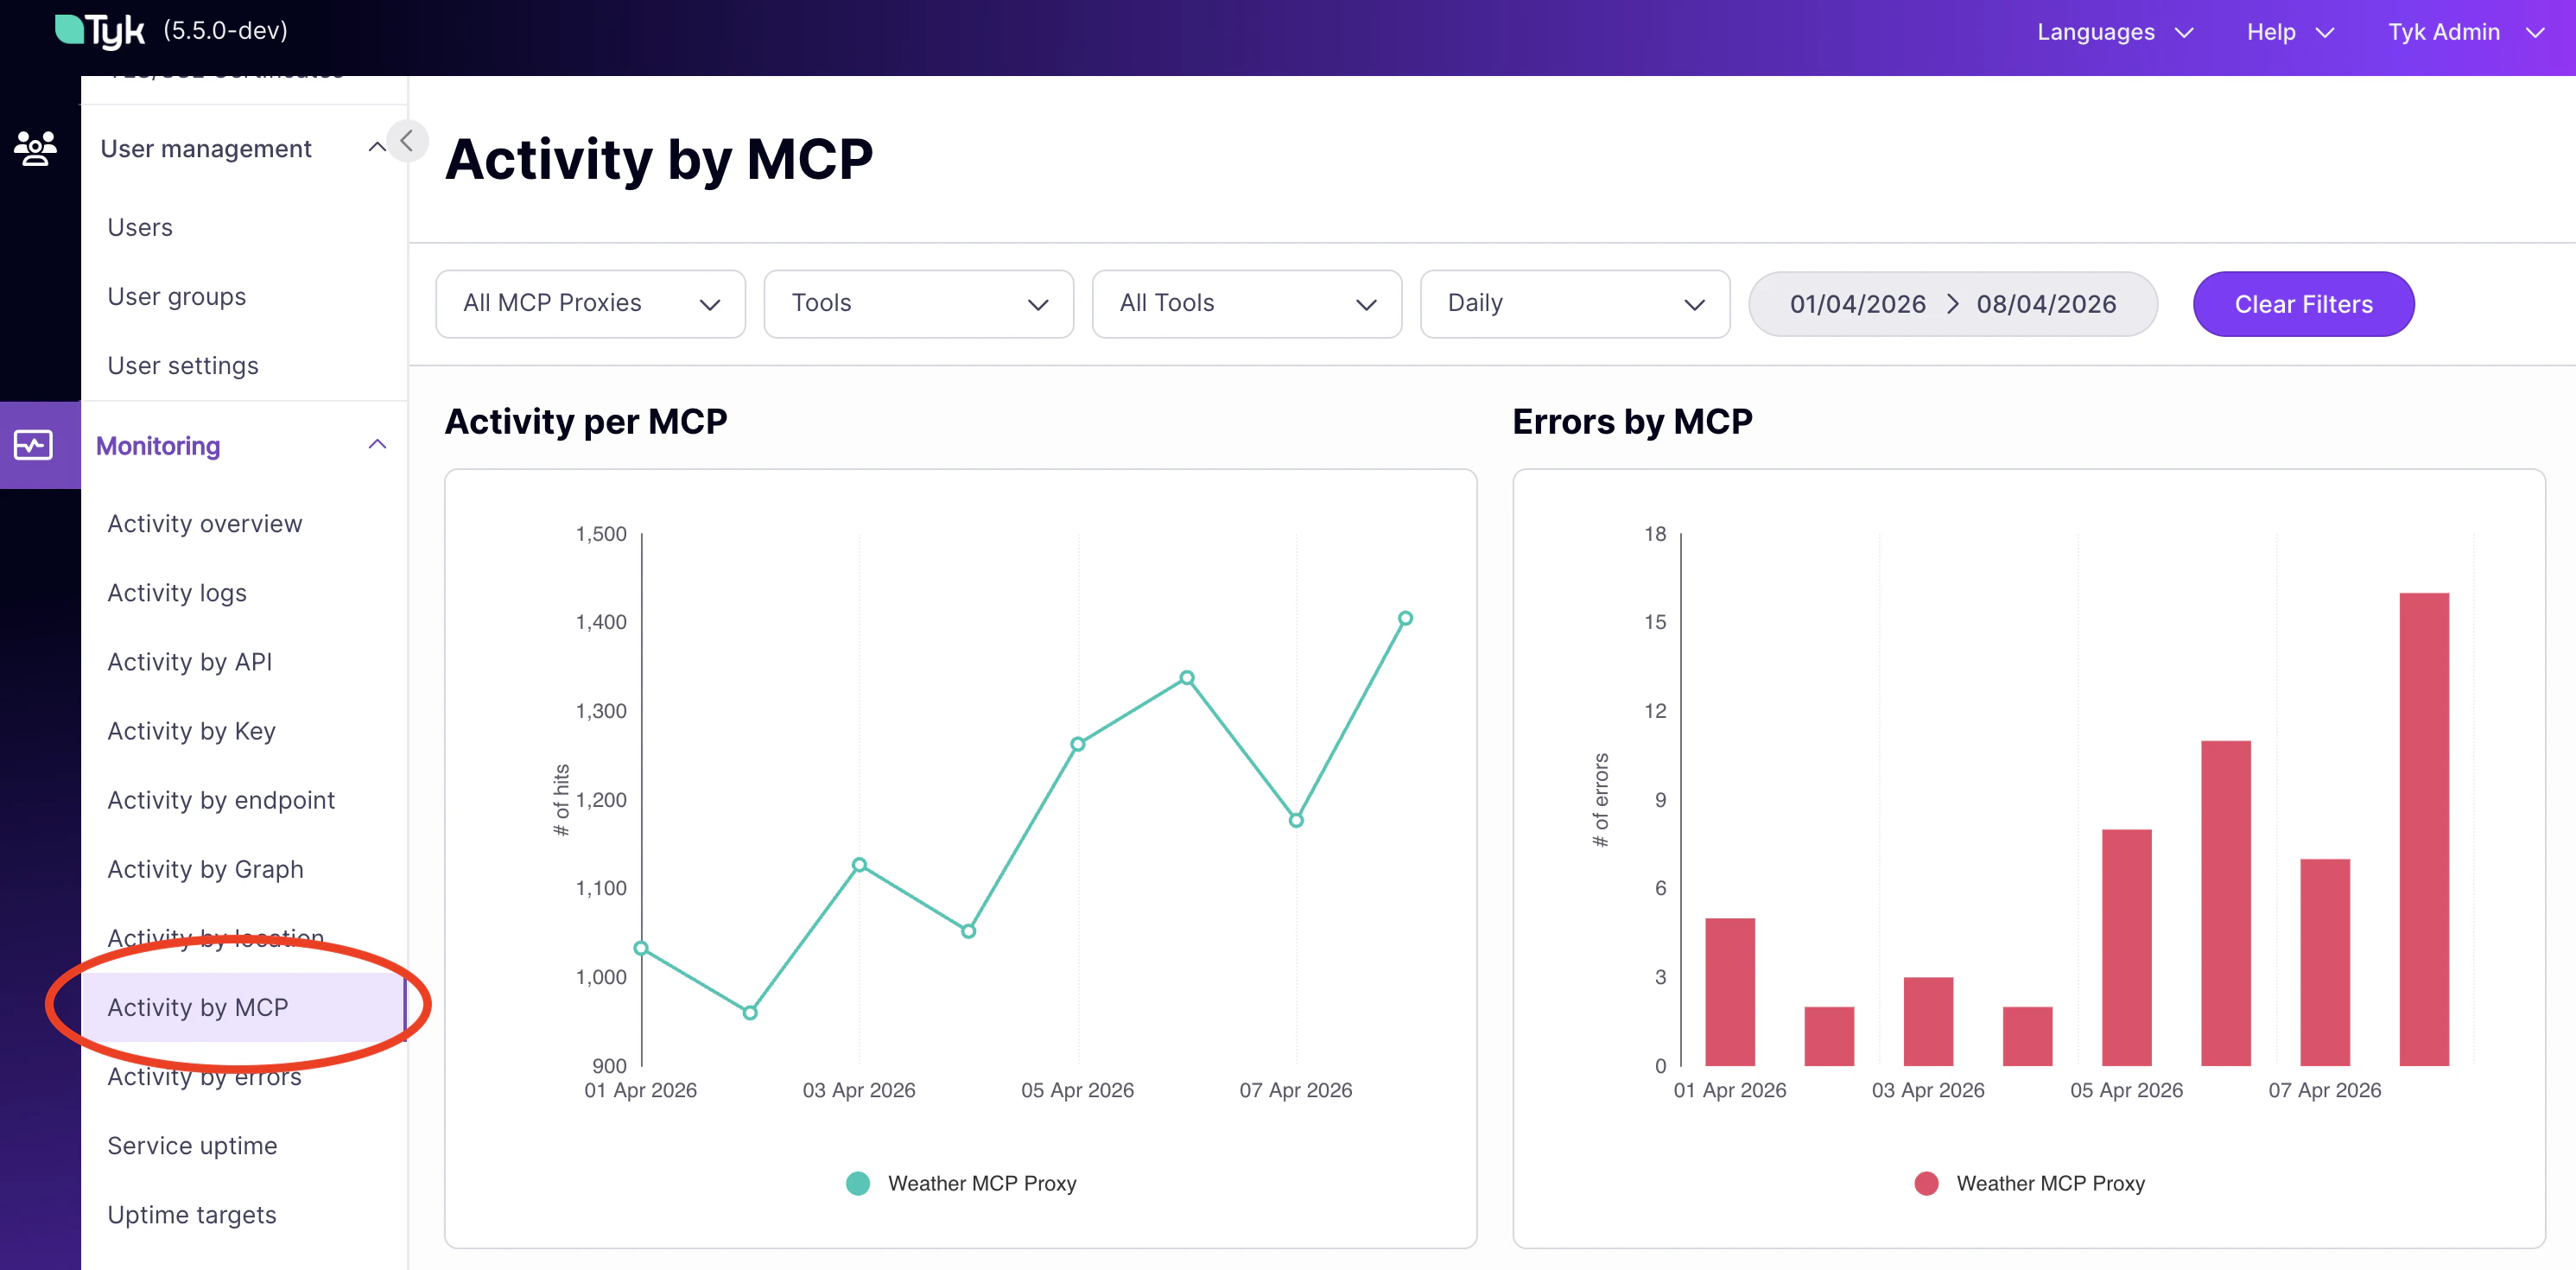
Activity by MCP
The Activity by MCP page provides analytics for your Model Context Protocol (MCP) proxies and primitives. It allows you to track and monitor MCP-specific traffic through the following charts and tables:- Activity per MCP: Displays request volumes and traffic trends across your configured MCP servers.
- Errors by MCP: Tracks error rates and distribution across different MCP servers.
- Primitives Traffic: Shows the overall traffic volume handled by your MCP primitives (tools, resources, and prompts).
- Most Used Primitives: Identifies the most frequently invoked primitives.
- Most Failing Primitives: Highlights the primitives with the highest failure rates.
- Slowest Primitives: Measures latency and identifies the slowest-performing primitives.
- Error Status Codes by Primitive: Breaks down error responses by HTTP status codes for each primitive.
Activity by Error
The error overview page limits the analytics down to errors only, and gives you a detailed look over the range of the number of errors that your APIs have generated. This view is very similar to the Dashboard, but will provide more detail on the error types: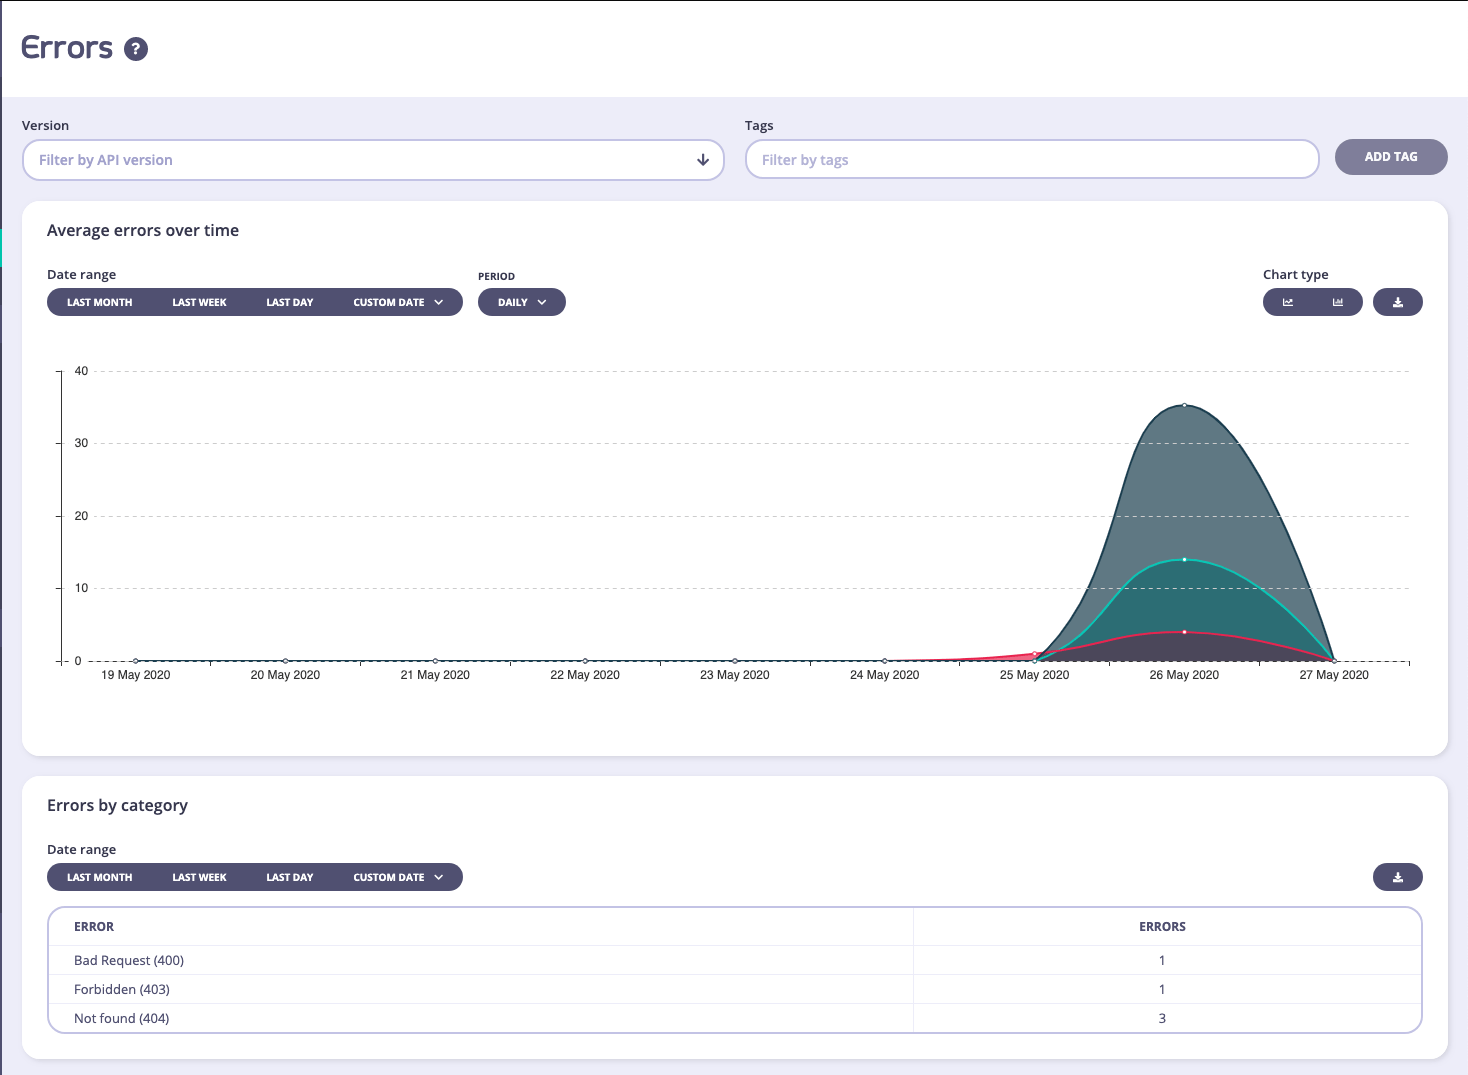
From Tyk v5.1 (and LTS patches v4.0.14 and v5.0.3) the Errors by Category data will not be visible to a user if they are assigned the Owned Analytics permission.
Activity by OAuth Client
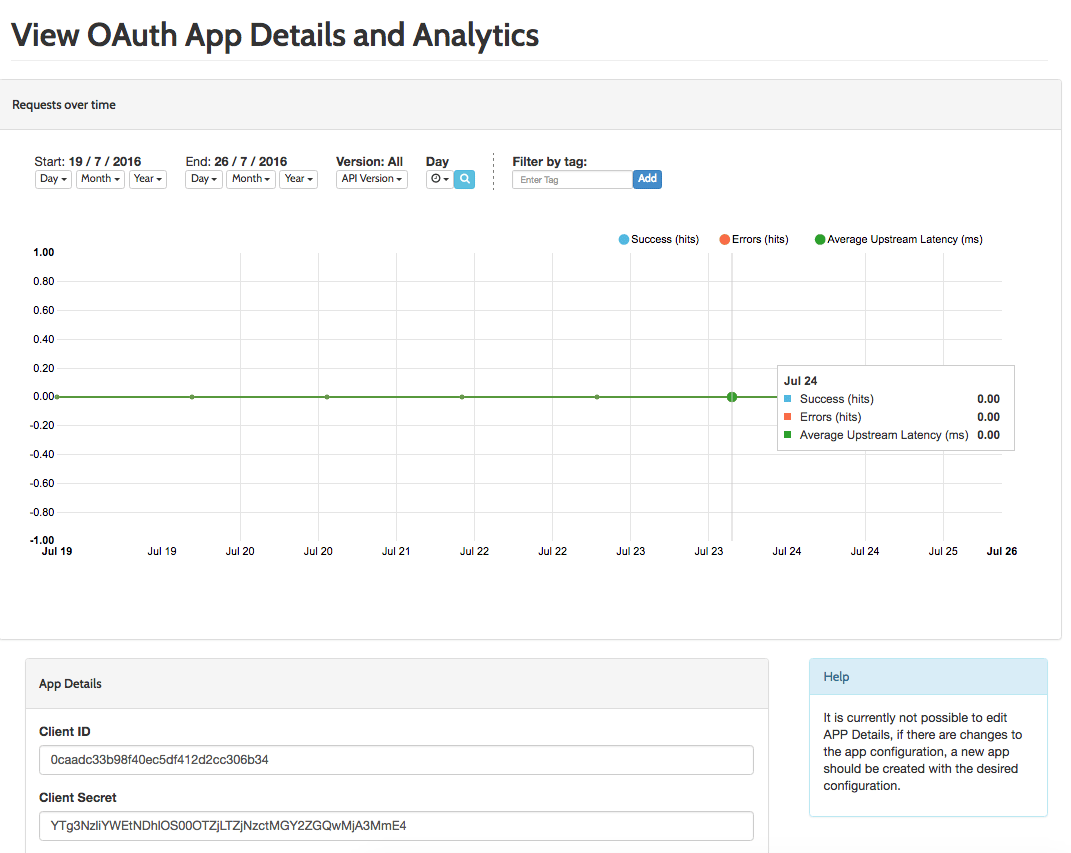
Traffic statistics are available on a per OAuth Client ID basis if you are using the OAuth mode for one of your APIs. To get a breakdown view of traffic aggregated to a Client ID, you will need to go to the System Management -> APIs section and then under the OAuth API, there will be a button called OAuth API. Selecting an OAuth client will then show its aggregate activity
From Tyk v5.1 (and LTS patches v4.0.14 and v5.0.3) the Traffic per OAuth Client ID charts will not be visible to a user if they are assigned the Owned Analytics permission.