

- End-to-end request tracing: Implement distributed tracing across your microservices architecture to track requests across different services and gather data about each service’s contribution to the overall request latency.
- Transaction Flow: Visualize the transaction flow by connecting traces to show how requests move through different services, including entry points (e.g., API gateway), middleware and backend services.
- Latency Analysis: Analyze trace data to pinpoint which service or component is causing latency issues, allowing for quick identification and remediation of performance bottlenecks.
- Error Correlation: Use traces to correlate errors across different services to understand the root cause of issues and track how errors propagate through the system.
OpenTelemetry Tracing
Since v5.2, Tyk Gateway supports distributed tracing via OpenTelemetry. The gateway exports traces using the OpenTelemetry Protocol (OTLP), making it compatible with any modern tracing backend: Jaeger, Datadog, Dynatrace, Elasticsearch, New Relic, and others.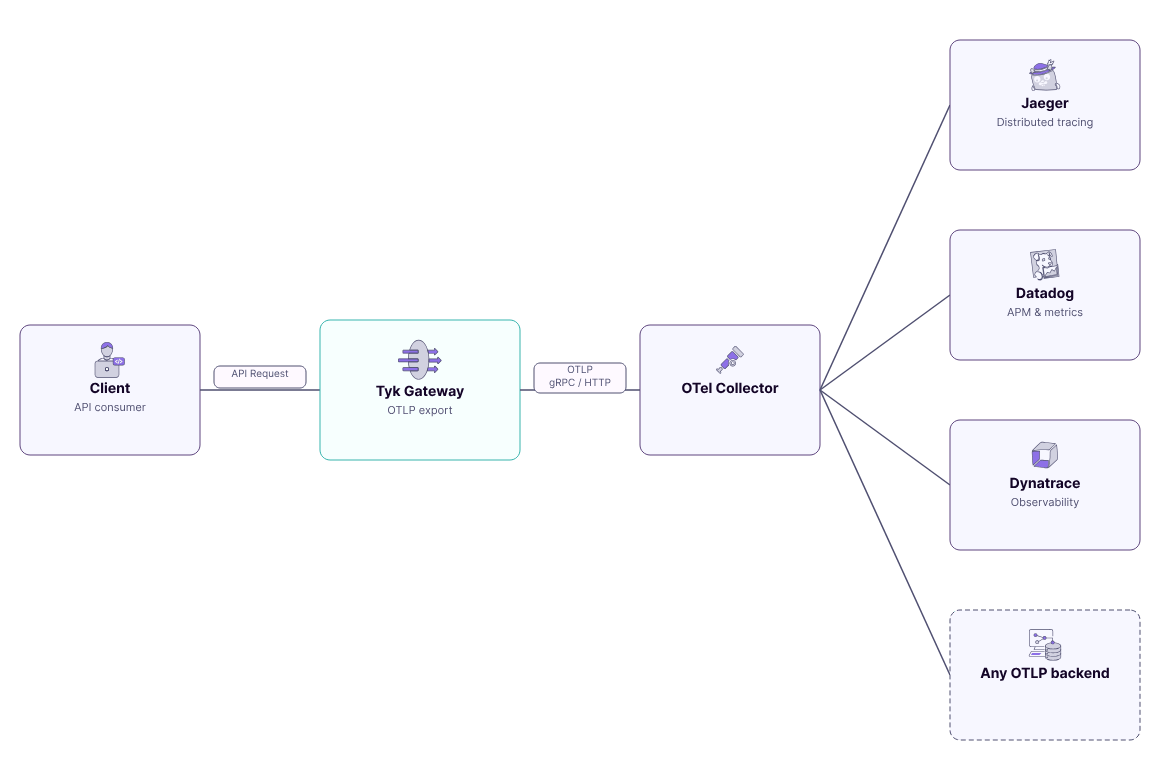
Configuration
Enable Tracing
Enable OpenTelemetry tracing at the Gateway level intyk.conf:
- Config File (tyk.conf)
- Environment Variable
Reference
The root-level
opentelemetry.enabled, opentelemetry.exporter, and opentelemetry.endpoint fields are deprecated from Tyk 5.13.0.They continue to work for backward compatibility but should be replaced with the opentelemetry.traces.* equivalents in new deployments.Detailed Tracing
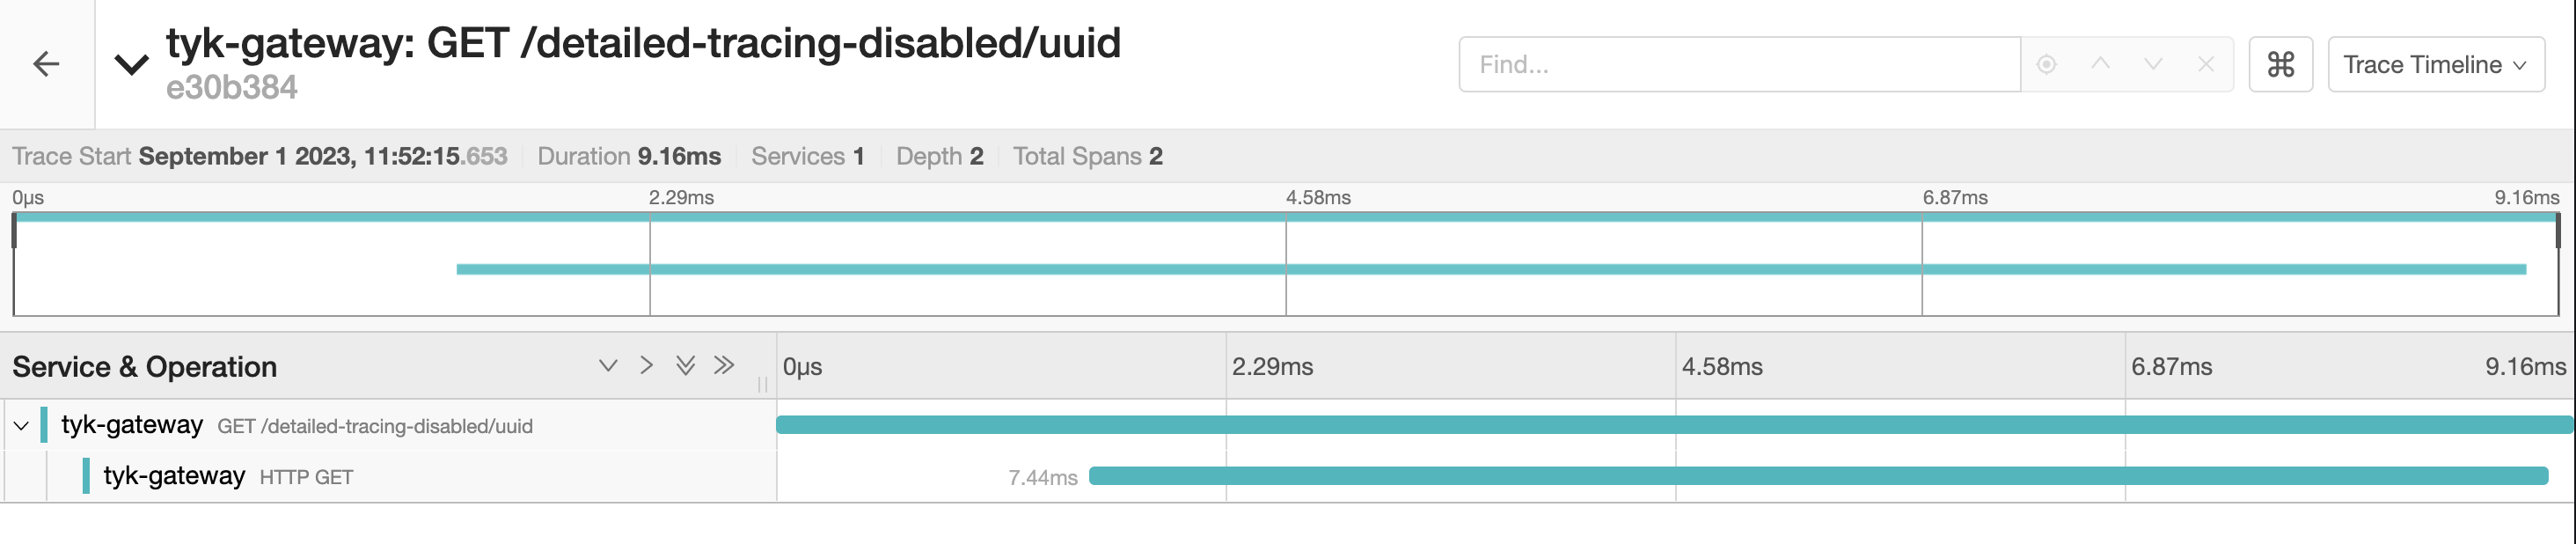
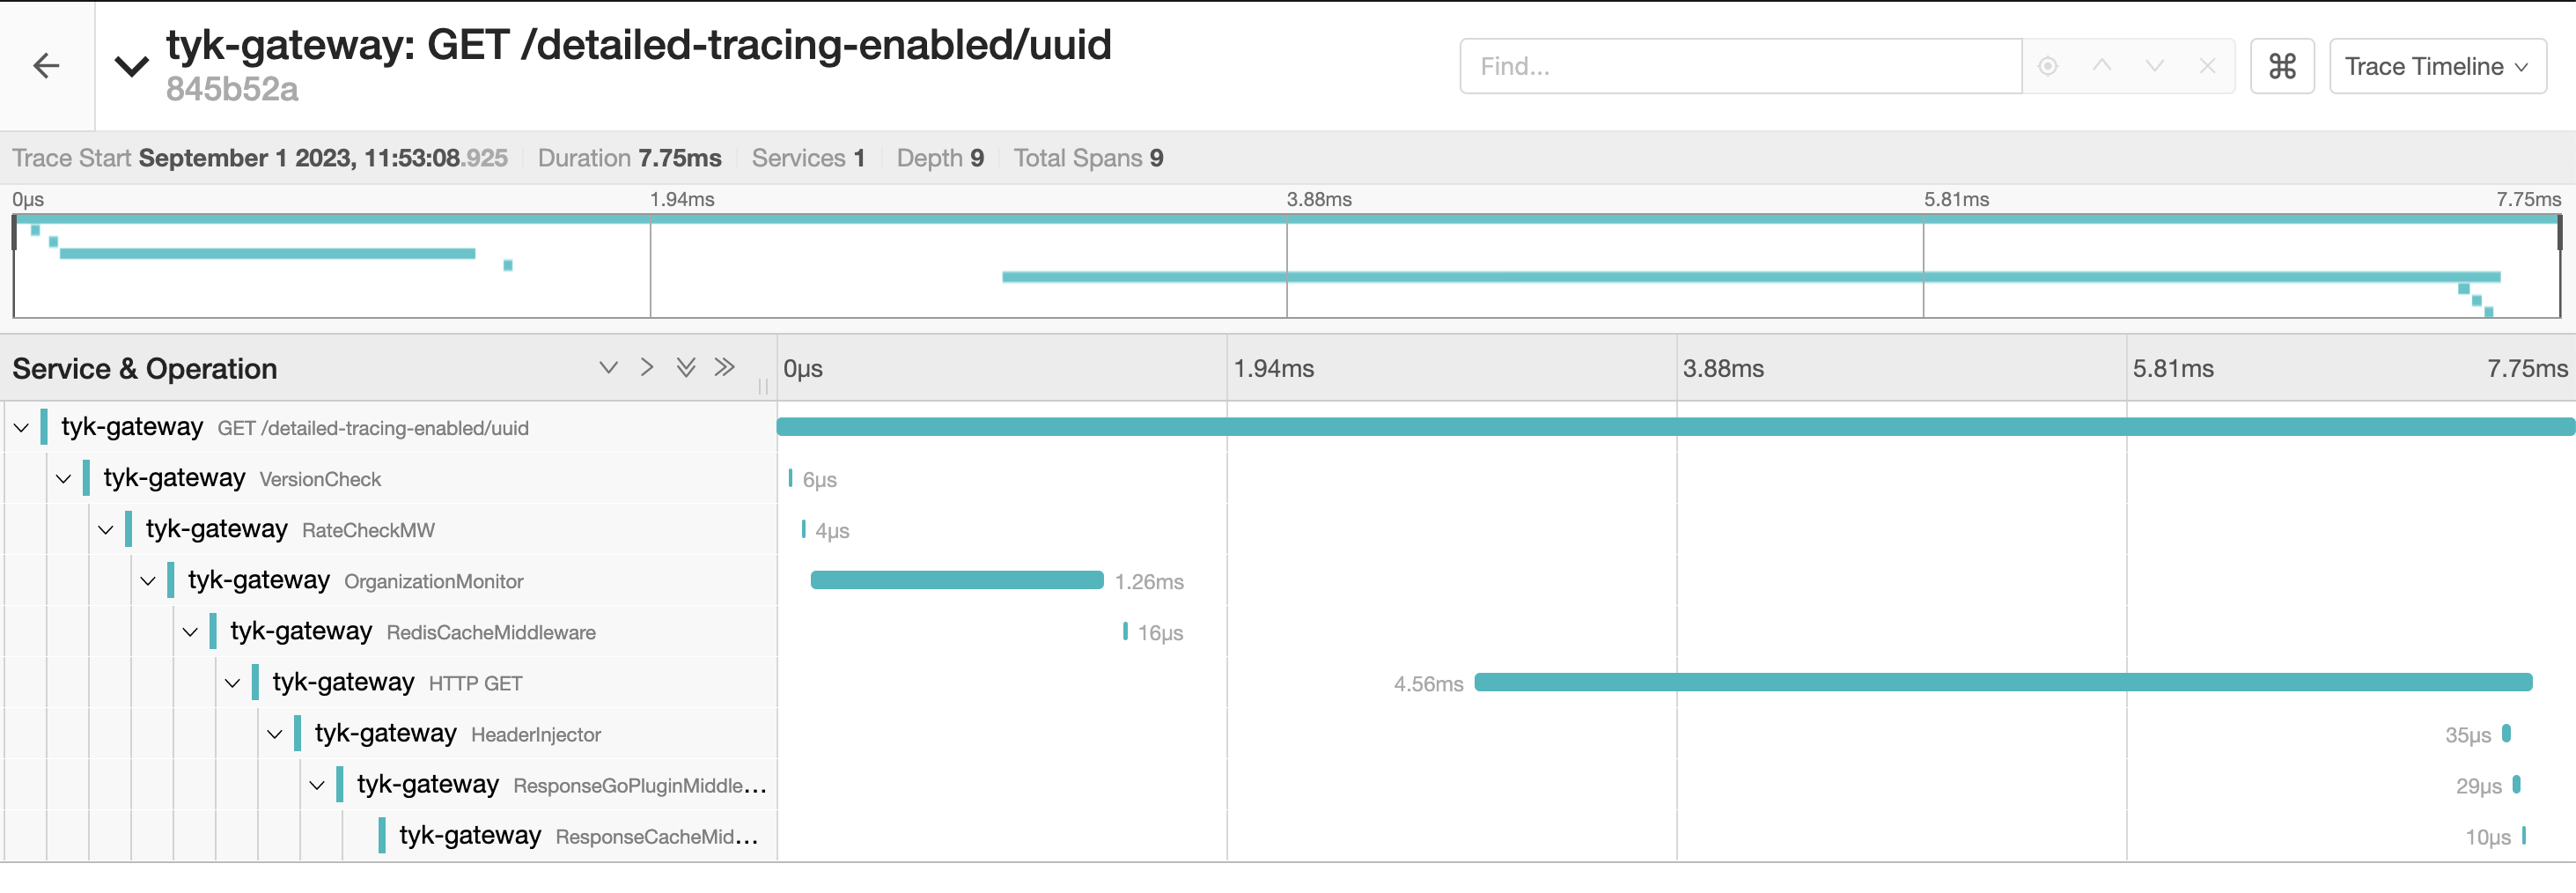
Enable detailed tracing per API to generate a span for each middleware in the request pipeline. These spans offer detailed insights, including the time taken for each middleware execution and the sequence of invocations. Set the server.detailedTracing flag in the Tyk OAS API definition, or toggle OpenTelemetry Tracing in the Tyk OAS API Designer.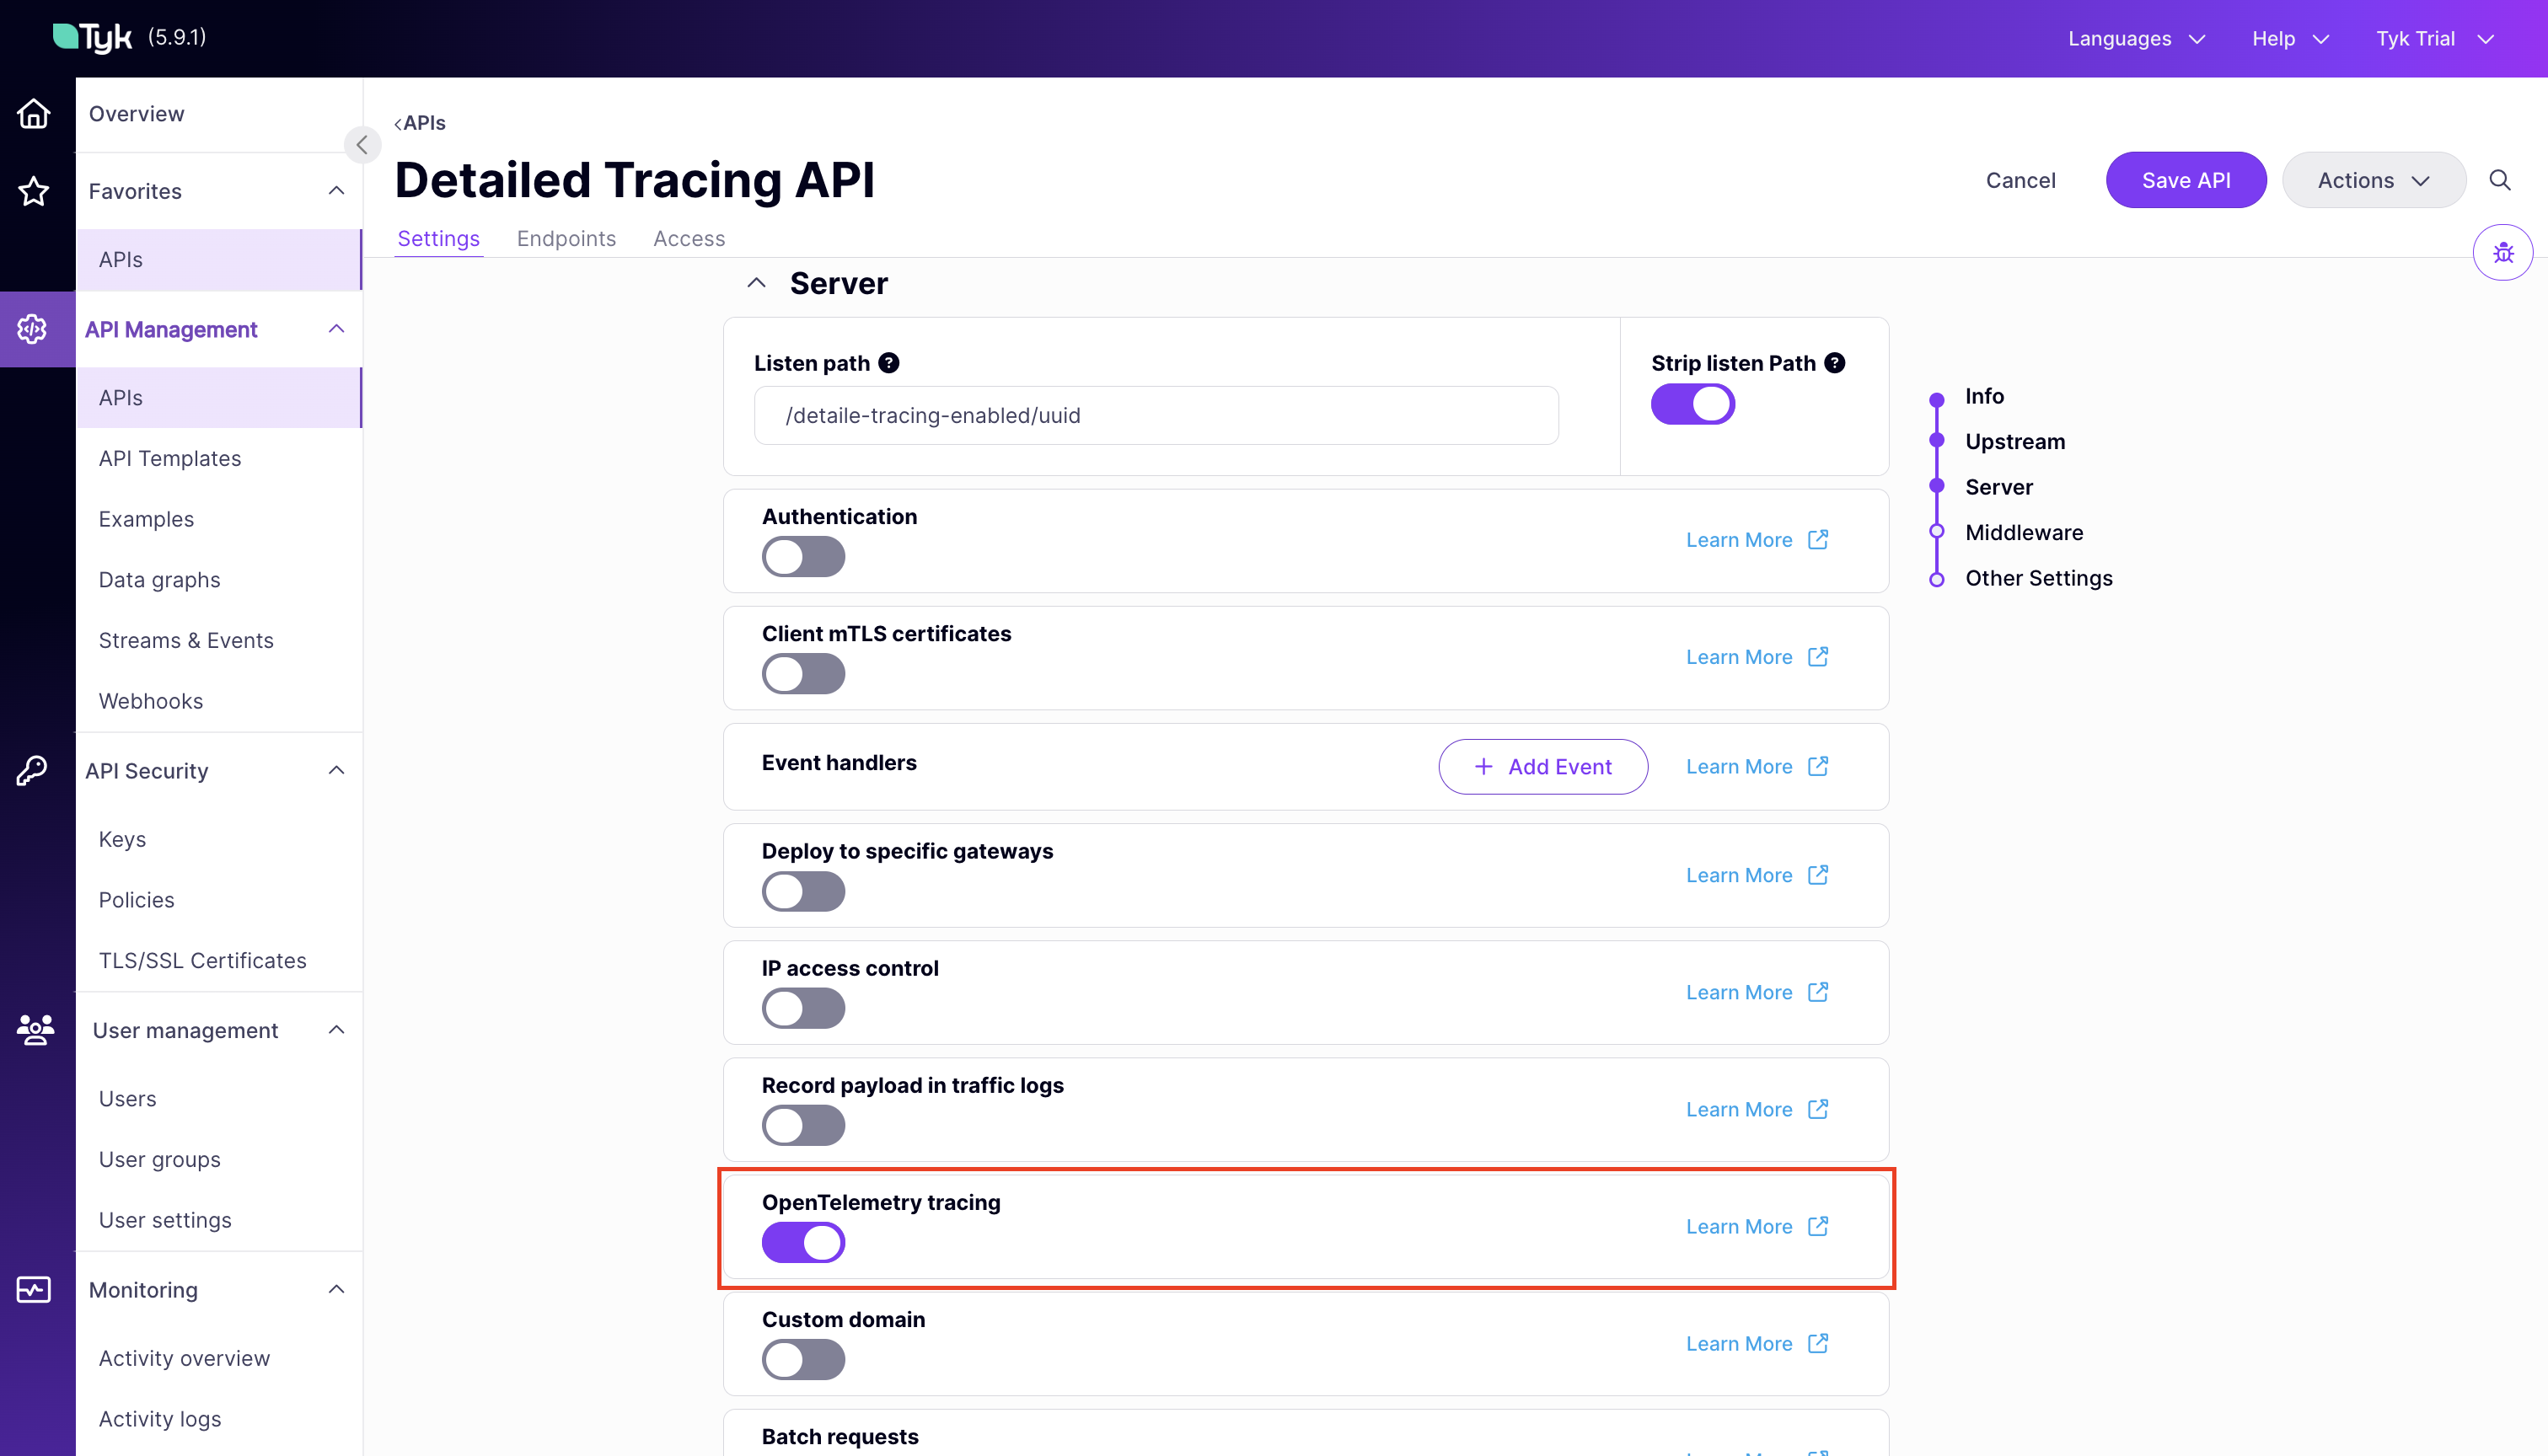
Span Processor Configuration
A span processor controls how completed spans are batched and sent to the tracing backend. This is configured in the Tyk Gateway configuration file underopentelemetry.traces.
When using span_processor_type: batch (the default), you can tune the batch processor to avoid span loss under high traffic. Use the span_batch_config block to configure the following fields:
Increase
max_queue_size and max_export_batch_size in high-throughput environments where spans are being dropped before they can be exported.
Understanding The Traces
Tyk Gateway exposes a helpful set of span attributes and resource attributes with the generated spans. These attributes provide useful insights for analyzing your API requests. A clear analysis can be obtained by observing the specific actions and associated context within each request/response. This is where span and resource attributes play a significant role.Span Attributes
A span is a named, timed operation that represents an operation. Multiple spans represent different parts of the workflow and are pieced together to create a trace. While each span includes a duration indicating how long the operation took, the span attributes provide additional contextual metadata. Span attributes are key-value pairs that provide contextual metadata for individual spans. Tyk automatically sets the following span attributes:tyk.api.name: API name.tyk.api.orgid: Organization ID.tyk.api.id: API ID.tyk.api.path: API listen path.tyk.api.tags: If tagging is enabled in the API definition, the tags are added here.tyk.api.apikey.alias: The identity alias of the authenticated client. Populated for APIs using JWT authentication or multi-auth (compliant mode).
Resource Attributes
Resource attributes provide contextual information about the entity that produced the telemetry data. Tyk exposes following resource attributes:Service Attributes
The service attributes supported by Tyk are:
By understanding and using these resource attributes, you can gain better insights into the performance of your API Gateways.
Common HTTP Span Attributes
Tyk follows the OpenTelemetry semantic conventions for HTTP spans. You can find detailed information on common attributes here. Some of these common attributes include:http.method: HTTP request method.http.scheme: URL scheme.http.status_code: HTTP response status code.http.url: Full HTTP request URL.
Advanced Configuration
Context Propagation
This setting allows you to specify the type of context propagator to use for trace data. This is essential for ensuring compatibility and data integrity between different services in your architecture.- Config File (tyk.conf)
- Environment Variable
opentelemetry.traces.context_propagation controls which trace context format the gateway reads from incoming requests and writes to upstream requests.
custom and composite are available from Tyk Gateway v5.12.0 and require opentelemetry.custom_trace_header to be set.Custom Trace Header
If your upstream systems use a proprietary correlation header (for example,X-Correlation-ID), set custom_trace_header to that header name. The behavior depends on context_propagation:
- Tracecontext
- Custom
- Composite
Tracecontext mode (
tracecontext + custom_trace_header): reads from the custom header (with fallback to traceparent), writes only the standard traceparent header to upstream.Sampling
Tyk supports configuring the following sampling strategies using opentelemetry.sampling intyk.conf.
Sampling Type
This setting dictates the sampling policy that OpenTelemetry uses to decide if a trace should be sampled for analysis. The decision is made at the start of a trace and applies throughout its lifetime. By default, the setting isAlwaysOn.
Set the opentelemetry.traces.sampling.type field in the Tyk Gateway configuration file or use the equivalent environment variable. Allowed values for this setting are:
Sampling Rate
The opentelemetry.traces.sampling.rate field is used to control what fraction of total traces will be sampled when theTraceIDRatioBased sampling is configured. It accepts a value between 0.0 and 1.0. For example, a rate set to 0.5 implies that approximately 50% of the traces will be sampled. The default value is 0.5.
- Configuration File: Update the
opentelemetry.traces.sampling.ratefield in the configuration file.
ParentBased Sampling
Parent based sampling ensures sampling consistency between parent and child spans. Specifically, if a parent span is sampled, all its child spans will be sampled at the same rate. This is particularly effective when used withTraceIDRatioBased sampling, as it helps to keep the entire transaction story together. Using ParentBased with AlwaysOn or AlwaysOff may not be as useful, since in these cases, either all or no spans are sampled.
Enable parent based sampling by setting opentelemetry.traces.sampling.parent_based or the equivalent environment variable. The default value is false.
Tracing Backends
For step-by-step setup guides connecting Tyk Gateway traces to a specific backend: All configuration options are documented in the Tyk Gateway configuration reference.OpenTracing (deprecated)
Enabling OpenTracing
Configure OpenTracing at the Gateway level intyk.conf:
Tyk automatically propagates tracing headers to upstream APIs when tracing is enabled.
Legacy Vendor Configurations
- Jaeger
- New Relic
- Zipkin
Tyk’s OpenTelemetry tracing works with Jaeger. Follow the Jaeger guide instead.