Install Tyk Self Managed
Last updated: 171 minutes read.
What is Tyk Self-Managed
Tyk Self-Managed allows you to easily install our Full Lifecycle API Management solution in your own infrastructure. There is no calling home, and there are no usage limits. You have full control.
What Does Tyk Self-Managed Include?
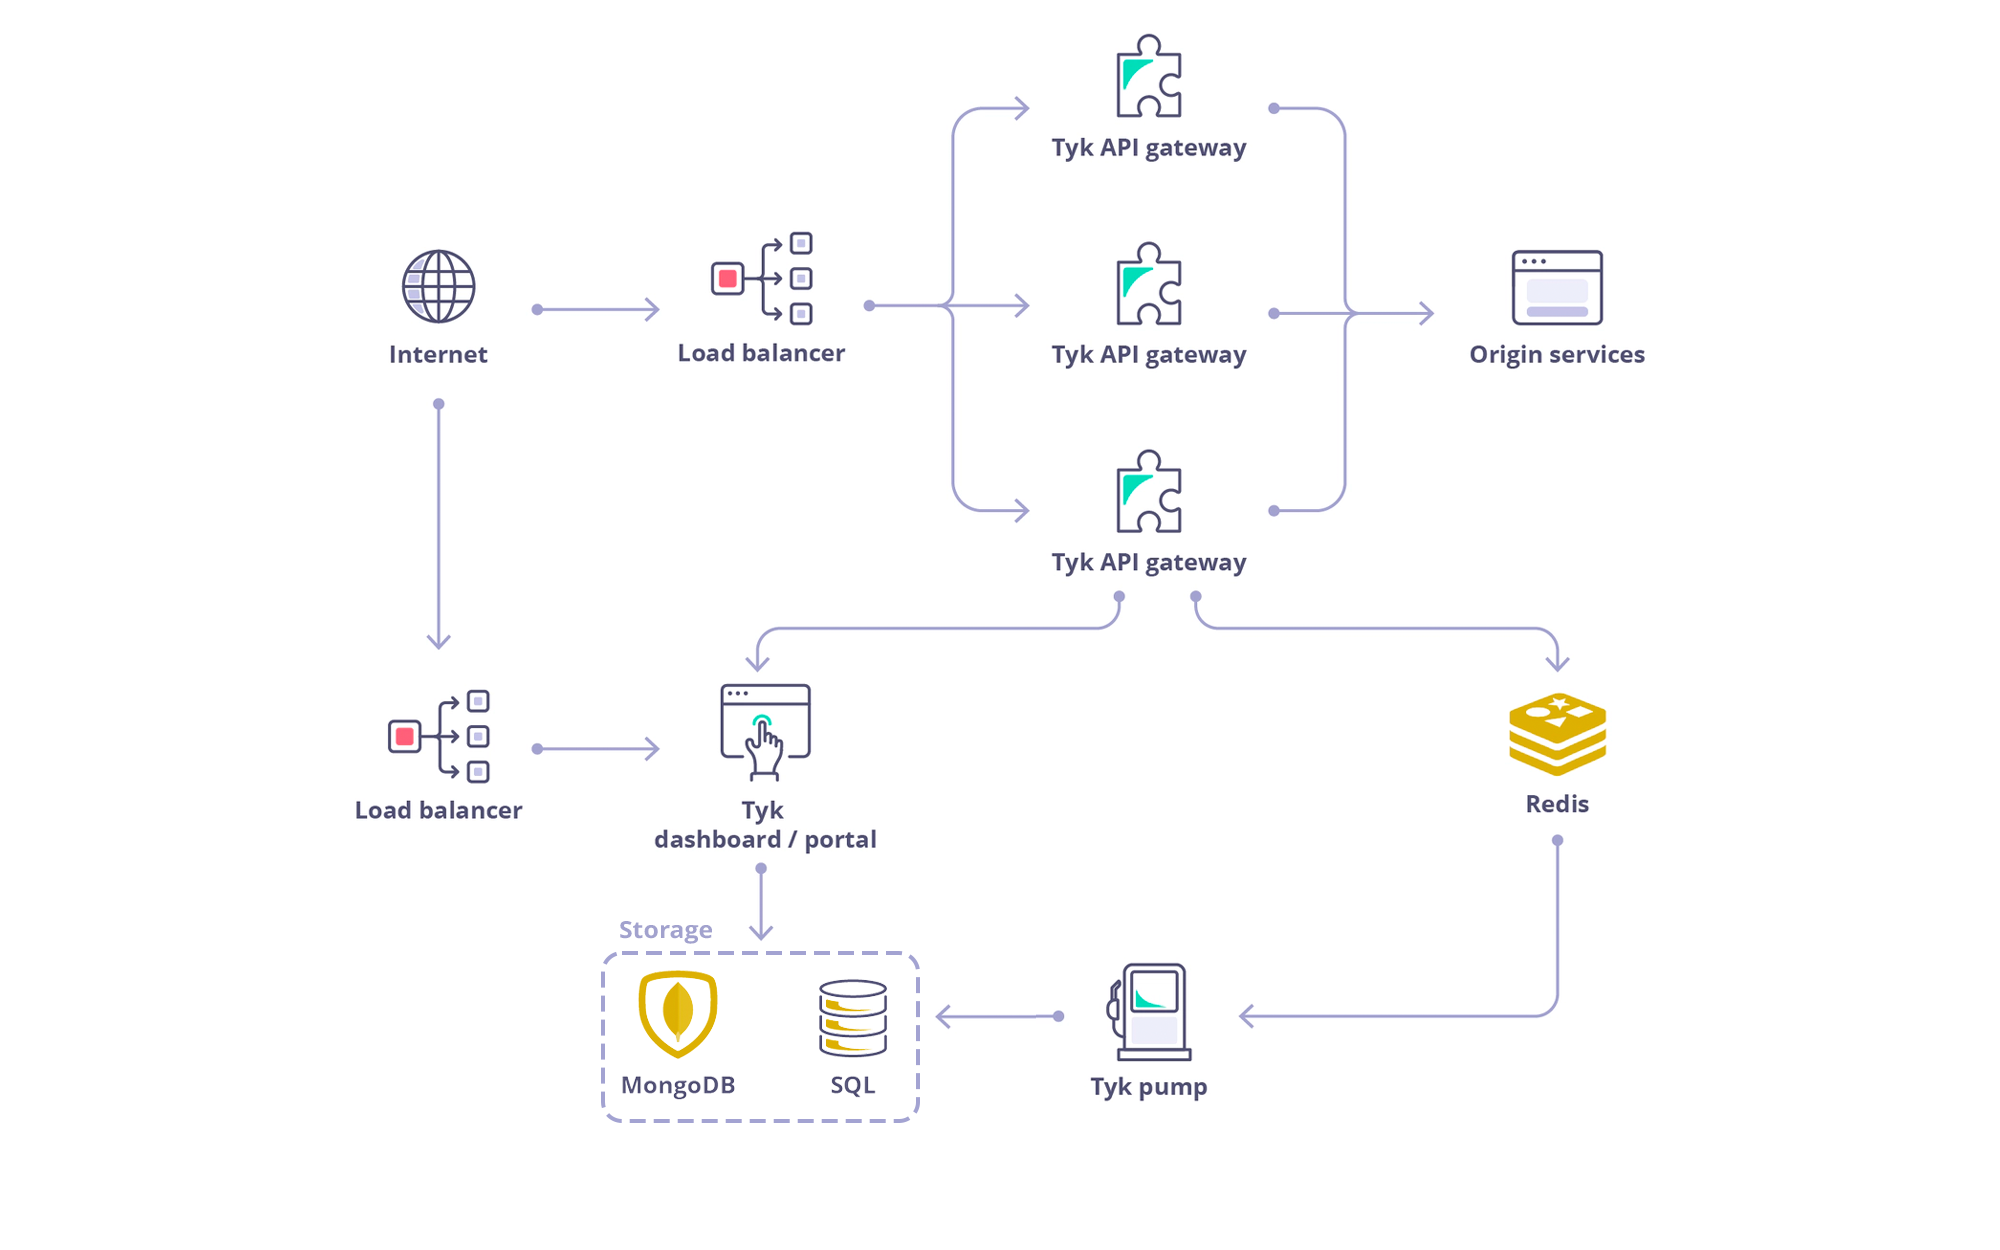
The full Tyk Self-Managed system consists of:
- Tyk Gateway: Tyk Gateway is provided ‘Batteries-included’, with no feature lockout. It is an open source enterprise API Gateway, supporting REST, GraphQL, TCP and gRPC protocols, that protects, secures and processes your APIs.
- Tyk Dashboard: The management Dashboard and integration API manage a cluster of Tyk Gateways and also show analytics and features of the Developer portal. The Dashboard also provides the API Developer Portal, a customizable developer portal for your API documentation, developer auto-enrollment and usage tracking.
- Tyk Pump: Tyk Pump handles moving analytics data between your gateways and your Dashboard (amongst other data sinks). The Tyk Pump is an open source analytics purger that moves the data generated by your Tyk nodes to any back-end.
- Tyk Identity Broker (Optional): Tyk Identify Broker handles integrations with third-party IDP’s. It (TIB) is a component providing a bridge between various Identity Management Systems such as LDAP, Social OAuth (e.g. GPlus, Twitter, GitHub) or Basic Authentication providers, to your Tyk installation.
- Tyk Multi-Data Center Bridge (Optional, add-on): Tyk Multi-Data Center Bridge allows for the configuration of a Tyk ecosystem that spans many data centers and clouds. It also (MDCB) acts as a broker between Tyk Gateway Instances that are isolated from one another and typically have their own Redis DB.
Understand Licensing and Deployment Models
Tyk Self-Managed is the easiest way to install Tyk Full Lifecycle API Management solution in your infrastructure. There is no calling home, and there are no usage limits. You have full control.
When selecting a Tyk Self-managed license (see the pricing page to compare the licenses), you can choose between three deployment models: Launch, Flex and Global Multi-team. Read below to learn which model fits best for your scenario.
Are you still figuring out your requirements for your deployment around performance, resilience, availability, latency, or multi-region deployment? Look at our API management architectural and deployment patterns 101 post to learn more.
Questions to Ask Yourself to Select your Deployment Model
- How many environments do you manage?
An environment is a single grouping of a control plane and multiple gateways, representing your development lifecycle. For example, staging and production would be 2 environments.
If you have teams working on two different projects, deployed in different environments, you might have 4 different environments (staging and prod for project number 1, staging and prod for project number 2). Or, you can leverage multi-tenancy with RBAC to onboard multiple teams onto the same environment to be more cost effective. You can read more about that scenario in the blog post How to manage multiple teams with Tyk Self-Managed.
You get extra developer licenses (a single control plane with 1 connected gateway for local testing on a developer’s workstation) for development and testing on local computers.
- How many gateways do you need per environment?
We recommend a minimum of 2 gateways per environment for redundancy & fail over. Rolling updates or blue green deployment might require additional gateways to ensure high availability during deployments.
You might also need more depending on your average load or to handle seasonal peak traffic. See Planning for Production to learn more.
- Are you deploying your software stack in multiple regions or datacenter?
Do you need support for centrally managing your APIs while deploying edge gateways into multiple regions or datacenter? Do you want to ensure data sovereignty in each of the regions you are deploying your APIs?
Launch - perfect to get started
✅ For single teams just getting started
Flex - for multiple teams within a single data center or cloud
✅ For multiple teams that require high availability and horizontal scaling
✅ For Kubernetes-based deployment within one cluster / region
Global Multi-team - for the largest global enterprises at scale
✅ For managing your APIs centrally while deploying edge gateways in independent clusters / regions
✅ For the highest availability across data centers
✅ For Kubernetes-based deployment in multiple cluster / multiple regions
✅ For larger organizations with multiple teams and data sovereignty requirements
The license starts with 3 environments and 2 regions, can be extended to more environments and regions as needed.
Don’t see what you need?
Contact us to discuss custom or enterprise deployments.
Tyk Dependencies and Database Support
MongoDB / PostgreSQL
Tyk Dashboard requires a persistent datastore for its operations. By default MongoDB is used. From Tyk v4.0, we also support PostgreSQL. See Database Options for a list of versions and drop-in replacements we support.
Redis
Tyk Gateway requires Redis for its operations. Here is the list of supported versions:
Supported Versions
- Tyk 5.3 supports Redis 6.2.x, 7.0.x, and 7.2.x
- Tyk 5.2.x and earlier supports Redis 6.0.x and Redis 6.2.x only.
Visit the Gateway page for more info.
Tyk Gateway Architecture
The Tyk Gateway can run completely independently, requiring only a Redis database, and can scale horizontally:
Init Systems
Tyk packages support systemd, Upstart (both 0.6.x and 1.x) and SysVinit Linux init systems. During package installation only one is chosen depending on the operating system support, e.g.:
- CentOS 6, RHEL 6, Amazon Linux ship with Upstart 0.6.x
- Ubuntu 14.04, Debian Jessie with Upstart 1.x
- CentOS 7, RHEL 7, Ubuntu 16.04, Debian Stretch are running with systemd
- Certain older distros may only provide SysVinit but all of them typically provide compatibility with its scripts
Note that any init scripts of your choosing can be used instead of automatically detected ones by copying them from the install/inits
directory inside the package directory.
This init system variance implies there are different ways to manage the services and collect service logs.
Upstart
For Upstart, service management can be performed through the initctl
or a set of start
, stop
, restart
and status
commands. Upstart 1.x also works with the service
command.
systemd
For systemd, either systemctl
or service
commands may be utilized.
The service
command can usually be used with SysVinit scripts, as well as invoking them directly.
Note
- Upstart 0.6.x and SysVinit: log files are located in
/var/logs
for every respective service, e.g./var/logs/tyk-gateway.stderr
and/var/logs/tyk-gateway.stdout
- Upstart 1.x: by default everything is stored in
/var/logs/upstart
directory, e.g./var/logs/upstart/tyk-gateway.log
- systemd utilizes its own logging mechanism called journald, which is usable via the
journalctl
command, e.g.journalctl -u tyk-gateway
Please consult with respective init system documentation for more details on how to use and configure it.
Licensing
Read more about licensing here.
Getting Started with Tyk Self-Managed
Tyk Self-Managed consists of multiple components, as described above. While the OSS Gateway and Pump are available without a license, the remaining components require one. To experience the full capabilities of our Full Lifecycle API Management solution within your own infrastructure, please obtain a license by contacting our support team.
If you prefer guided support, we recommend exploring our Tyk Technical PoC Guide.
Once you have obtained your license, you can proceed with the installation options provided below.
Tyk Demo - The Perfect PoC Experience
Head over to our Tyk Demo guides in Kubernetes or Docker. These guides, with zero to none effort, will spin up the full Tyk infrastructure (Tyk stack) with examples of Tyk’s capabilities and integrations out-of-the-box.
Installation Options for Tyk Self-Managed
Install with Docker
Install on K8s
Install with Ansible
Install on Red Hat
Install on Ubuntu
Install on Amazon AWS
Install Tyk on Heroku
Install on Microsoft Azure
Install on Kubernetes
The main way to install Tyk Self-Managed in a Kubernetes cluster is via Helm charts. We are actively working to add flexibility and more user flows to our chart. Please reach out to our teams on support or the cummunity forum if you have questions, requests or suggestions for improvements.
Get started with one of our quick start guides:
Or go to Tyk Stack helm chart for detailed installation instructions and configuration options.
Install Tyk Stack with Helm Chart (PostgreSQL)
The following guides provide instructions to install Redis, PostgreSQL, and Tyk stack with default configurations. It is intended for quick start only. For production, you should install and configure Redis and PostgreSQL separately.
Prerequisites
Quick Start
The following quick start guide explains how to use the Tyk Stack Helm chart to configure a Dashboard that includes:
- Redis for key storage
- PostgreSQL for app config
- Tyk Pump to send analytics to PostgreSQL. It also opens a metrics endpoint where Prometheus (if available) can scrape from.
At the end of this quickstart Tyk Dashboard should be accessible through service dashboard-svc-tyk-tyk-dashboard
at port 3000
. You can login to Dashboard using the admin email and password to start managing APIs. Tyk Gateway will be accessible through service gateway-svc-tyk-tyk-gateway.tyk.svc
at port 8080
.
1. Setup required credentials
First, you need to provide Tyk license, admin email and password, and API keys. We recommend to store them in secrets.
NAMESPACE=tyk
REDIS_BITNAMI_CHART_VERSION=19.0.2
POSTGRES_BITNAMI_CHART_VERSION=12.12.10
API_SECRET=changeit
ADMIN_KEY=changeit
TYK_LICENSE=changeit
ADMIN_EMAIL=[email protected]
ADMIN_PASSWORD=changeit
kubectl create namespace $NAMESPACE
kubectl create secret generic my-secrets -n $NAMESPACE \
--from-literal=APISecret=$API_SECRET \
--from-literal=AdminSecret=$ADMIN_KEY \
--from-literal=DashLicense=$TYK_LICENSE
kubectl create secret generic admin-secrets -n $NAMESPACE \
--from-literal=adminUserFirstName=Admin \
--from-literal=adminUserLastName=User \
--from-literal=adminUserEmail=$ADMIN_EMAIL \
--from-literal=adminUserPassword=$ADMIN_PASSWORD
2. Install Redis (if you don’t already have Redis installed)
If you do not already have Redis installed, you may use these charts provided by Bitnami.
helm upgrade tyk-redis oci://registry-1.docker.io/bitnamicharts/redis -n $NAMESPACE --install --version $REDIS_BITNAMI_CHART_VERSION
Follow the notes from the installation output to get connection details and password. The DNS name of your Redis as set by Bitnami is tyk-redis-master.tyk.svc:6379
(Tyk needs the name including the port)
The Bitnami chart also creates a secret tyk-redis
which stores the connection password in redis-password
. We will make use of this secret in installation later.
3. Install PostgreSQL (if you don’t already have PostgreSQL installed)
If you do not already have PostgreSQL installed, you may use these charts provided by Bitnami.
helm upgrade tyk-postgres oci://registry-1.docker.io/bitnamicharts/postgresql --set "auth.database=tyk_analytics" -n $NAMESPACE --install --version $POSTGRES_BITNAMI_CHART_VERSION
Follow the notes from the installation output to get connection details.
We require the PostgreSQL connection string for Tyk installation. This can be stored in a secret and will be used in installation later.
POSTGRESQLURL=host=tyk-postgres-postgresql.$NAMESPACE.svc\ port=5432\ user=postgres\ password=$(kubectl get secret --namespace $NAMESPACE tyk-postgres-postgresql -o jsonpath="{.data.postgres-password}" | base64 -d)\ database=tyk_analytics\ sslmode=disable
kubectl create secret generic postgres-secrets -n $NAMESPACE --from-literal=postgresUrl="$POSTGRESQLURL"
Note
Ensure that you are installing PostgreSQL versions that are supported by Tyk. Please consult the list of supported versions that are compatible with Tyk.
4. Install Tyk
helm repo add tyk-helm https://helm.tyk.io/public/helm/charts/
helm repo update
helm upgrade tyk tyk-helm/tyk-stack -n $NAMESPACE \
--install \
--set global.adminUser.useSecretName=admin-secrets \
--set global.secrets.useSecretName=my-secrets \
--set global.redis.addrs="{tyk-redis-master.$NAMESPACE.svc:6379}" \
--set global.redis.passSecret.name=tyk-redis \
--set global.redis.passSecret.keyName=redis-password \
--set global.postgres.connectionStringSecret.name=postgres-secrets \
--set global.postgres.connectionStringSecret.keyName=postgresUrl
5. Done!
Now Tyk Dashboard should be accessible through service dashboard-svc-tyk-tyk-dashboard
at port 3000
. You can login to Dashboard using the admin email and password to start managing APIs. Tyk Gateway will be accessible through service gateway-svc-tyk-tyk-gateway.tyk.svc
at port 8080
.
You are now ready to create an API.
For the complete installation guide and configuration options, please see Tyk Stack Helm Chart.
Install Tyk Stack with Helm Chart (MongoDB)
The following guides provide instructions to install Redis, MongoDB, and Tyk stack with default configurations. It is intended for quick start only. For production, you should install and configure Redis and MongoDB separately.
Prerequisites
Note
If you want to enable Tyk Enterprise Developer Portal, please use PostgreSQL. MongoDB is not supported in Developer Portal.
Quick Start
The following quick start guide explains how to use the Tyk Stack Helm chart to configure a Dashboard that includes:
- Redis for key storage
- MongoDB for app config
- Tyk Pump to send analytics to MongoDB. It also opens a metrics endpoint where Prometheus (if available) can scrape from.
At the end of this quickstart Tyk Dashboard should be accessible through service dashboard-svc-tyk-tyk-dashboard
at port 3000
. You can login to Dashboard using the admin email and password to start managing APIs. Tyk Gateway will be accessible through service gateway-svc-tyk-tyk-gateway.tyk.svc
at port 8080
.
1. Setup required credentials
First, you need to provide Tyk license, admin email and password, and API keys. We recommend to store them in secrets.
NAMESPACE=tyk
REDIS_BITNAMI_CHART_VERSION=19.0.2
MONGO_BITNAMI_CHART_VERSION=15.1.3
API_SECRET=changeit
ADMIN_KEY=changeit
TYK_LICENSE=changeit
ADMIN_EMAIL=[email protected]
ADMIN_PASSWORD=changeit
kubectl create namespace $NAMESPACE
kubectl create secret generic my-secrets -n $NAMESPACE \
--from-literal=APISecret=$API_SECRET \
--from-literal=AdminSecret=$ADMIN_KEY \
--from-literal=DashLicense=$TYK_LICENSE
kubectl create secret generic admin-secrets -n $NAMESPACE \
--from-literal=adminUserFirstName=Admin \
--from-literal=adminUserLastName=User \
--from-literal=adminUserEmail=$ADMIN_EMAIL \
--from-literal=adminUserPassword=$ADMIN_PASSWORD
2. Install Redis (if you don’t have a Redis instance)
If you do not already have Redis installed, you may use these charts provided by Bitnami.
helm upgrade tyk-redis oci://registry-1.docker.io/bitnamicharts/redis -n $NAMESPACE --install --version $REDIS_BITNAMI_CHART_VERSION
Follow the notes from the installation output to get connection details and password. The DNS name of your Redis as set by Bitnami is
tyk-redis-master.tyk.svc:6379
(Tyk needs the name including the port)
The Bitnami chart also creates a secret tyk-redis
which stores the connection password in redis-password
. We will make use of this secret in installation later.
Note
Please make sure you are installing Redis versions that are supported by Tyk. Please refer to Tyk docs to get list of supported versions.
3. Install MongoDB (if you don’t have a MongoDB instance)
If you do not already have MongoDB installed, you may use these charts provided by Bitnami.
helm upgrade tyk-mongo oci://registry-1.docker.io/bitnamicharts/mongodb -n $NAMESPACE --install --version $MONGO_BITNAMI_CHART_VERSION
Note
Please make sure you are installing MongoDB versions that are supported by Tyk. Please refer to Tyk docs to get list of supported versions.
Note
Bitnami MongoDB image is not supported on darwin/arm64 architecture.
We require the MongoDB connection string for Tyk installation. You can store it in a secret and provide the secret in installation later.
MONGOURL=mongodb://root:$(kubectl get secret --namespace $NAMESPACE tyk-mongo-mongodb -o jsonpath="{.data.mongodb-root-password}" | base64 -d)@tyk-mongo-mongodb.$NAMESPACE.svc:27017/tyk_analytics?authSource=admin
kubectl create secret generic mongourl-secrets --from-literal=mongoUrl=$MONGOURL -n $NAMESPACE
Note
Ensure that you are installing MongoDB versions that are supported by Tyk. Please consult the list of supported versions that are compatible with Tyk.
4. Install Tyk
helm repo add tyk-helm https://helm.tyk.io/public/helm/charts/
helm repo update
helm upgrade tyk tyk-helm/tyk-stack -n $NAMESPACE \
--install \
--set global.adminUser.useSecretName=admin-secrets \
--set global.secrets.useSecretName=my-secrets \
--set global.redis.addrs="{tyk-redis-master.$NAMESPACE.svc:6379}" \
--set global.redis.passSecret.name=tyk-redis \
--set global.redis.passSecret.keyName=redis-password \
--set global.mongo.driver=mongo-go \
--set global.mongo.connectionURLSecret.name=mongourl-secrets \
--set global.mongo.connectionURLSecret.keyName=mongoUrl \
--set global.storageType=mongo \
--set tyk-pump.pump.backend='{prometheus,mongo}'
5. Done!
Now Tyk Dashboard should be accessible through service dashboard-svc-tyk-tyk-dashboard
at port 3000
. You can login to Dashboard using the admin email and password to start managing APIs. Tyk Gateway will be accessible through service gateway-svc-tyk-tyk-gateway.tyk.svc
at port 8080
.
You are now ready to create an API.
For the complete installation guide and configuration options, please see Tyk Stack Helm Chart.
Install Tyk Stack on Windows with Helm
Note
Installing Tyk on Kubernetes requires a multi-node Tyk license. If you are evaluating Tyk on Kubernetes, contact us to obtain an temporary license.
Warning
This deployment is NOT designed for production use or performance testing. The Tyk Pro Docker Demo is our full, Self-Managed solution, which includes our Gateway, Dashboard and analytics processing pipeline.
This demo will run Tyk Self-Managed on your machine, which contains 5 containers: Tyk Gateway, Tyk Dashboard, Tyk Pump, Redis and either MongoDB or one of our supported SQL databases.
This demo is great for proof of concept and demo purposes, but if you want to test performance, you need to move each component to a separate machine.
Note
You use this at your own risk. Tyk is not supported on the Windows platform. However you can test it as a proof of concept using our Pro Demo Docker installation.
Prerequisites
- MS Windows 10 Pro
- Tyk Helm Chart
- Docker Desktop for Windows running with a signed in Docker ID
- minikube
- Kubectl
- Helm
- Git for Windows
- Python for Windows
- PowerShell running as administrator
- Our Pro Demo Docker GitHub repo
- A free Tyk Self-Managed Developer license
Ensure that kubectl and helm prerequisites are configured on your Windows path environment variable
This demo installation was tested with the following tools/versions:
- Microsoft Windows 10 Pro v1909 VM on Azure (Standard D2 v3 size)
- Docker Desktop for Windows 2.2.0.0 (Docker engine v19.03.5)
- helm v3.0.3
- minikube v1.7.1 (k8s v 1.17.2)
- kubectl v 1.17.0 (Note that kubectl is packaged with Docker Desktop for Windows, but the version may be incompatible with k8s)
Installation
Now you have your prerequisites, follow the instructions from our Tyk Helm Chart page.
Use Legacy Helm Chart
Warning
tyk-pro
chart is deprecated. Please use our Tyk Stack helm chart instead.
We recommend all users migrate to the tyk-stack
Chart. Please review the Configuration section of the new helm chart and cross-check with your existing configurations while planning for migration.
Introduction
Tyk Helm chart is the preferred (and easiest) way to install Tyk Self-Managed on Kubernetes.
The helm chart tyk-helm/tyk-pro
will install full Tyk platform with Tyk Manager, Tyk Gateways and Tyk Pump into your Kubernetes cluster. You can also choose to enable the installation of Tyk Operator (to manage your APIs in a declarative way).
Prerequisites
-
Tyk License
If you are evaluating Tyk on Kubernetes, contact us to obtain a temporary license.
-
Data stores
The following are required for a Tyk Self-Managed installation:
- Redis - Should be installed in the cluster or reachable from inside the cluster (for SaaS option). You can find instructions for a simple Redis installation bellow.
- MongoDB or SQL - Should be installed in the cluster or be reachable by the Tyk Manager (for SaaS option).
You can find supported MongoDB and SQL versions here.
Installation instructions for Redis and MongoDB/SQL are detailed below.
-
Helm
Installed Helm 3 Tyk Helm Chart is using Helm v3 version (i.e. not Helm v2).
Installation
As well as our official Helm repo, you can also find it in ArtifactHub.
If you are interested in contributing to our charts, suggesting changes, creating PRs or any other way, please use GitHub Tyk-helm-chart repo or contact us in Tyk Community forum or through our sales team.
-
Add Tyk official Helm repo to your local Helm repository
helm repo add tyk-helm https://helm.tyk.io/public/helm/charts/ helm repo update
-
Create namespace for your Tyk deployment
kubectl create namespace tyk
-
Getting the values.yaml of the chart
Before we proceed with installation of the chart you need to set some custom values. To see what options are configurable on a chart and save that options to a custom values.yaml file run:
helm show values tyk-helm/tyk-pro > values.yaml
Installing the data stores
For Redis, MongoDB or SQL you can use these rather excellent charts provided by Bitnami
Redis
helm install tyk-redis bitnami/redis -n tyk --version 19.0.2
Note
Please make sure you are installing Redis versions that are supported by Tyk. Please refer to Tyk docs to get list of supported versions.
Follow the notes from the installation output to get connection details and password.
Redis(TM) can be accessed on the following DNS names from within your cluster:
tyk-redis-master.tyk.svc.cluster.local for read/write operations (port 6379)
tyk-redis-replicas.tyk.svc.cluster.local for read-only operations (port 6379)
export REDIS_PASSWORD=$(kubectl get secret --namespace tyk tyk-redis -o jsonpath="{.data.redis-password}" | base64 --decode)
The DNS name of your Redis as set by Bitnami is tyk-redis-master.tyk.svc.cluster.local:6379
(Tyk needs the name including the port)
You can update them in your local values.yaml
file under redis.addrs
and redis.pass
Alternatively, you can use --set
flag to set it in Tyk installation. For example --set redis.pass=$REDIS_PASSWORD
MongoDB
helm install tyk-mongo bitnami/mongodb --set "replicaSet.enabled=true" -n tyk --version 15.1.3
Note
Bitnami MongoDB images is not supported on darwin/arm64 architecture.
Follow the notes from the installation output to get connection details and password. The DNS name of your MongoDB as set with Bitnami is tyk-mongo-mongodb.tyk.svc.cluster.local
and you also need to set the authSource
parameter to admin
. The full mongoURL
should be similar to mongoURL: mongodb://root:[email protected]:27017/tyk_analytics?authSource=admin
. You can update them in your local values.yaml
file under mongo.mongoURL
Alternatively, you can use --set
flag to set it in your Tyk installation.
Important Note regarding MongoDB
This Helm chart enables the PodDisruptionBudget for MongoDB with an arbiter replica-count of 1. If you intend to perform system maintenance on the node where the MongoDB pod is running and this maintenance requires for the node to be drained, this action will be prevented due the replica count being 1. Increase the replica count in the helm chart deployment to a minimum of 2 to remedy this issue.
Postgres
helm install tyk-postgres bitnami/postgresql --set "auth.database=tyk_analytics" -n tyk --version 12.12.10
Note
Please make sure you are installing PostgreSQL versions that are supported by Tyk. Please refer to Tyk docs to get list of supported versions.
Follow the notes from the installation output to get connection details and password. The DNS name of your Postgres service as set by Bitnami is tyk-postgres-postgresql.tyk.svc.cluster.local
.
You can update connection details in values.yaml
file under postgres
.
Quick Redis and MongoDB PoC installation
Warning
Another option for Redis and MongoDB, to get started quickly, is to use our simple-redis and simple-mongodb charts. Please note that these provided charts must not ever be used in production and for anything but a quick start evaluation only. Use external redis or Official Redis Helm chart in any other case. We provide this chart, so you can quickly get up and running, however it is not meant for long term storage of data for example.
helm install redis tyk-helm/simple-redis -n tyk
helm install mongo tyk-helm/simple-mongodb -n tyk
License setting
For the Tyk Self-Managed chart we need to set the license key in your custom values.yaml
file under dash.license
field
or use --set dash.license={YOUR-LICENSE_KEY}
with the helm install
command.
Tyk Self-Managed licensing allow for different numbers of Gateway nodes to connect to a single Dashboard instance.
To ensure that your Gateway pods will not scale beyond your license allowance, please ensure that the Gateway’s resource kind is Deployment
and the replica count to your license node limit. By default, the chart is configured to work with a single node license: gateway.kind=Deployment
and gateway.replicaCount=1
.
Please Note
There may be intermittent issues on the new pods during the rolling update process, when the total number of online gateway pods is more than the license limit with lower amounts of Licensed nodes.
Installing Tyk Self managed
Now we can install the chart using our custom values:
helm install tyk-pro tyk-helm/tyk-pro -f ./values.yaml -n tyk --wait
Important Note regarding MongoDB
The --wait
argument is important to successfully complete the bootstrap of your Tyk Manager.
Pump Installation
By default pump installation is disabled. You can enable it by setting pump.enabled
to true
in values.yaml
file.
Alternatively, you can use --set pump.enabled=true
while doing helm install.
Quick Pump configuration(Supported from tyk helm v0.10.0)
1. Mongo Pump
To configure mongo pump, do following changings in values.yaml
file:
- Set
backend
tomongo
. - Set connection string in
mongo.mongoURL
.
2. Postgres Pump
To configure postgres pump, do following changings in values.yaml
file:
- Set
backend
topostgres
. - Set connection string parameters in
postgres
section.
Tyk Developer Portal
You can disable the bootstrapping of the Developer Portal by the portal.bootstrap: false
in your local values.yaml
file.
Using TLS
You can turn on the TLS option under the gateway section in your local values.yaml
file which will make your Gateway
listen on port 443 and load up a dummy certificate. You can set your own default certificate by replacing the file in the certs/
folder.
Mounting Files
To mount files to any of the Tyk stack components, add the following to the mounts array in the section of that component. For example:
- name: aws-mongo-ssl-cert
filename: rds-combined-ca-bundle.pem
mountPath: /etc/certs
Sharding APIs
Sharding is the ability for you to decide which of your APIs are loaded on which of your Tyk Gateways. This option is
turned off by default, however, you can turn it on by updating the gateway.sharding.enabled
option. Once you do that you
will also need to set the gateway.sharding.tags
field with the tags that you want that particular Gateway to load. (ex. tags: “external,ingress”.)
You can then add those tags to your APIs in the API Designer, under the Advanced Options tab, and
the Segment Tags (Node Segmentation) section in your Tyk Dashboard.
Check Tyk Gateway Sharding for more details.
Install More Tyk Components
Installing Tyk Enterprise Developer Portal
If you are deploying the Tyk Enterprise Developer Portal, set the appropriate values under the enterprisePortal
section in your values.yaml
. Please visit Tyk Enterprise Developer Portal installation for a step by step guide.
Note: Helm chart supports Enterprise Portal v1.2.0+
Installing Tyk Self-managed Control Plane
If you are deploying the Tyk Control plane, a.k.a MDCB, for a Tyk Multi Data Center Bridge deployment then you set
the mdcb.enabled: true
option in the local values.yaml
to add of the MDCB component to your installation.
Check Tyk Control plane for more configuration details.
This setting enables multi-cluster, multi Data-Center API management from a single dashboard.
Tyk Identity Broker (TIB)
The Tyk Identity Broker (TIB) is a micro-service portal that provides a bridge between various Identity Management Systems such as LDAP, OpenID Connect providers and legacy Basic Authentication providers, to your Tyk installation. See TIB for more details.
For SSO to Tyk Manager and Tyk developer portal purposes you do not need to install TIB, as its functionality is now part of the Tyk Manager. However, if you want to run it separately (as you used to before this merge) or if you need it as a broker for the Tyk Gateway you can do so.
Once you have installed your Tyk Gateway and Tyk Manager, you can configure TIB by adding its configuration environment variables
under the tib.extraEnvs
section and updating the profile.json
in your configs
folder.
See our TIB GitHub repo.
Once you complete your modifications you can run the following command from the root of the repository to update your helm chart.
helm upgrade tyk-pro values.yaml -n tyk
This chart implies there’s a ConfigMap with a profiles.json
definition in it. Please use tib.configMap.profiles
value
to set the name of this ConfigMap (tyk-tib-profiles-conf
by default).
Tyk Operator and Ingress
For a GitOps workflow used with a Tyk Self-Managed installation or setting the Tyk Gateway as a Kubernetes ingress controller, Tyk Operator enables you to manage API definitions, security policies and other Tyk features using Kubernetes manifest files. To get started go to Tyk Operator.
Install on AWS Marketplace
Tyk offers a flexible and powerful API management solution through Tyk Cloud on the AWS Marketplace. Tyk Cloud is an end-to-end managed API platform where both the control plane and gateways are installed on AWS for a seamless, fully cloud-hosted experience.
For those who need more deployment flexibility, Tyk Cloud also supports a Hybrid Gateway option. In this setup, the control plane remains hosted and managed by Tyk on AWS, while the gateways can be deployed on your preferred cloud provider or on-premises environment—allowing you to meet data locality and compliance needs without sacrificing control.
Available AWS Deployment Regions
You can deploy Tyk Cloud in the following AWS regions:
- Singapore:
aws-ap-southeast-1
- Frankfurt, Germany:
aws-eu-central-1
- London, UK:
aws-eu-west-2
- N. Virginia, USA:
aws-us-east-1
- Oregon, USA:
aws-us-west-2
- Australia:
aws-ap-southeast-2
Getting started with Tyk Cloud via the AWS Marketplace is quick and easy. Sign up today to access Tyk’s comprehensive API management tools designed to scale with your needs.
Install Tyk on AWS EC2
-
Spin up an EC2 instance, AWS Linux2 preferably, T2.Medium is fine
- add a public IP
- open up SG access to:
- 3000 for the Tyk Dashboard
- 8080 for the Tyk Gateway
- 22 TCP for SSH
-
SSH into the instance
ssh -i mykey.pem ec2-user@public-ec2-ip
-
Install Git, Docker, & Docker Compose Feel free to copy paste these
sudo yum update -y
sudo yum install git -y
sudo yum install -y docker
sudo service docker start
sudo usermod -aG docker ec2-user
sudo su
sudo curl -L "https://github.com/docker/compose/releases/download/1.25.5/docker-compose-$(uname -s)-$(uname -m)" -o /usr/local/bin/docker-compose
sudo chmod +x /usr/local/bin/docker-compose
sudo ln -s /usr/local/bin/docker-compose /usr/bin/docker-compose
docker ps
- Clone the Tyk Pro Docker repo
git clone https://github.com/TykTechnologies/tyk-pro-docker-demo
cd tyk-pro-docker-demo/
- Add the license key to
confs/tyk_analytics.conf
into thelicense_key variable
using “vi” or “nano”, etc
This is the most common place to have problems.
Look for extra spaces between quotes ("") and the license key. It will not work if there are any.
Inside tyk_analytics.conf
, license_key
should look something like this, with a real license however:
"license_key": "eyJhbGciOiJSUzI1NiIsInR5cCI...WQ",
- Run the containers via
docker-compose
docker-compose up -d
- Visit
http://<public-ec2-ip>:3000
and fill out the Bootstrap form! If you see any page besides the Bootstrap page, you have pasted the license key incorrectly
Enable SSL for the Gateway & Dashboard
- Add the following to
confs/tyk.conf
"policies.policy_connection_string": "https://tyk-dashboard:3000"
"db_app_conf_options.connection_string": "https://tyk-dashboard:3000"
"http_server_options": {
"use_ssl": true,
"certificates": [
{
"domain_name": "*.yoursite.com",
"cert_file": "./new.cert.cert",
"key_file": "./new.cert.key"
}
],
"ssl_insecure_skip_verify": true ### YOU ONLY NEED THIS IF YOU ARE USING SELF SIGNED CERTS
}
- Add the following to
confs/tyk_analytics.conf
"tyk_api_config.Host": "https://tyk-gateway"
"http_server_options": {
"use_ssl": true,
"certificates": [
{
"domain_name": "*.yoursite.com",
"cert_file": "./new.cert.cert",
"key_file": "./new.cert.key"
}
]
}
- Generate self-signed Certs: (Or bring your own CA signed)
openssl req -x509 -newkey rsa:4096 -keyout key.pem -out cert.pem -days 365 -nodes
- Mount your certs to containers through
docker-compose.yml
tyk-dashboard:
...
volumes:
- ./cert.pem:/opt/tyk-dashboard/new.cert.cert
- ./key.pem:/opt/tyk-dashboard/new.cert.key
tyk-gateway:
...
volumes:
- ./cert.pem:/opt/tyk-gateway/new.cert.cert
- ./key.pem:/opt/tyk-gateway/new.cert.key
- Restart your containers with the mounted files
docker-compose up -d tyk-dashboard tyk-gateway
- Download the bootstrap script onto EC2 machine
wget https://raw.githubusercontent.com/sedkis/tyk/master/scripts/bootstrap-ssl.sh
- Apply execute permissions to file:
chmod +x bootstrap.sh
- Run the bootstrap script
./bootstrap.sh localhost
- Done! use the generated user and password to log into The Tyk Dashboard
Install with Ansible
Requirements
Ansible is required to run the following commands.
Getting Started
-
clone the tyk-ansible repositry
$ git clone https://github.com/TykTechnologies/tyk-ansible
-
cd
into the directory$ cd tyk-ansible
-
Run initialisation script to initialise environment
$ sh scripts/init.sh
-
Modify
hosts.yml
file to update ssh variables to your server(s). You can learn more about the hosts file here -
Run ansible-playbook to install the following:
- Redis
- MongoDB or PostgreSQL
- Tyk Dashboard
- Tyk Gateway
- Tyk Pump
$ ansible-playbook playbook.yaml -t tyk-pro -t redis -t `mongodb` or `pgsql`
You can choose to not install Redis, MongoDB or PostgreSQL by removing the
-t redis
or-t mongodb
or-t pgsql
However Redis and MongoDB or PostgreSQL are a requirement and need to be installed for the Tyk Pro installation to run.
Note
For a production environment, we recommend that the Gateway, Dashboard and Pump are installed on separate machines. If installing multiple Gateways, you should install each on a separate machine. See Planning for Production For more details.
Supported Distributions
Distribution | Version | Supported |
---|---|---|
Amazon Linux | 2 | ✅ |
CentOS | 8 | ✅ |
CentOS | 7 | ✅ |
Debian | 10 | ✅ |
Debian | 9 | ✅ |
RHEL | 8 | ✅ |
RHEL | 7 | ✅ |
Ubuntu | 21 | ✅ |
Ubuntu | 20 | ✅ |
Ubuntu | 18 | ✅ |
Ubuntu | 16 | ✅ |
Variables
vars/tyk.yaml
Variable | Default | Comments |
---|---|---|
secrets.APISecret | 352d20ee67be67f6340b4c0605b044b7 |
API secret |
secrets.AdminSecret | 12345 |
Admin secret |
redis.host | Redis server host if different than the hosts url | |
redis.port | 6379 |
Redis server listening port |
redis.pass | Redis server password | |
redis.enableCluster | false |
Enable if redis is running in cluster mode |
redis.storage.database | 0 |
Redis server database |
redis.tls | false |
Enable if redis connection is secured with SSL |
mongo.host | MongoDB server host if different than the hosts url | |
mongo.port | 27017 |
MongoDB server listening port |
mongo.tls | false |
Enable if mongo connection is secured with SSL |
pgsql.host | PGSQL server host if different than the hosts url | |
pgsql.port | 5432 |
PGSQL server listening port |
pgsql.tls | false |
Enable if pgsql connection is secured with SSL |
dash.license | Dashboard license | |
dash.service.host | Dashboard server host if different than the hosts url | |
dash.service.port | 3000 |
Dashboard server listening port |
dash.service.proto | http |
Dashboard server protocol |
dash.service.tls | false |
Set to true to enable SSL connections |
gateway.service.host | Gateway server host if different than the hosts url | |
gateway.service.port | 8080 |
Gateway server listening port |
gateway.service.proto | http |
Gateway server protocol |
gateway.service.tls | false |
Set to true to enable SSL connections |
gateway.sharding.enabled | false |
Set to true to enable filtering (sharding) of APIs |
gateway.sharding.tags | The tags to use when filtering (sharding) Tyk Gateway nodes. Tags are processed as OR operations. If you include a non-filter tag (e.g. an identifier such as node-id-1 , this will become available to your Dashboard analytics) |
|
gateway.rpc.connString | Use this setting to add the URL for your MDCB or load balancer host | |
gateway.rpc.useSSL | true |
Set this option to true to use an SSL RPC connection |
gateway.rpc.sslInsecureSkipVerify | true |
Set this option to true to allow the certificate validation (certificate chain and hostname) to be skipped. This can be useful if you use a self-signed certificate |
gateway.rpc.rpcKey | Your organization ID to connect to the MDCB installation | |
gateway.rpc.apiKey | This the API key of a user used to authenticate and authorize the Gateway’s access through MDCB. The user should be a standard Dashboard user with minimal privileges so as to reduce any risk if the user is compromised. The suggested security settings are read for Real-time notifications and the remaining options set to deny | |
gateway.rpc.groupId | This is the zone that this instance inhabits, e.g. the cluster/data-center the Gateway lives in. The group ID must be the same across all the Gateways of a data-center/cluster which are also sharing the same Redis instance. This ID should also be unique per cluster (otherwise another Gateway cluster can pick up your keyspace events and your cluster will get zero updates). |
vars/redis.yaml
Variable | Default | Comments |
---|---|---|
redis_bind_interface | 0.0.0.0 |
Binding address of Redis |
Read more about Redis configuration here.
vars/mongodb.yaml
Variable | Default | Comments |
---|---|---|
bind_ip | 0.0.0.0 |
Binding address of MongoDB |
mongodb_version | 4.4 |
MongoDB version |
Read more about MongoDB configuration here.
vars/pgsql.yaml
Variable | Default | Comments |
---|---|---|
postgresql_databases[] | [] |
Array of DBs to be created |
postgresql_databases[].name | tyk_analytics |
Database name |
postgresql_users[] | [] |
Array of users to be created |
postgresql_users[0 ].name |
default |
User name |
postgresql_users[0 ].password |
topsecretpassword |
User password |
postgresql_global_config_options[] | [] |
Postgres service config options |
postgresql_global_config_options[1 ].option |
listen_addresses |
Listen address binding for the service |
postgresql_global_config_options[1 ].value |
* |
Default value to listen to all addresses |
postgresql_hba_entries[] | [] |
Host based authenticaiton list |
postgresql_hba_entries[4 ].type |
host |
Entry type |
postgresql_hba_entries[4 ].database |
tyk_analytics |
Which database this entry will give access to |
postgresql_hba_entries[4 ].user |
default |
What users this gain access from this entry |
postgresql_hba_entries[4 ].address |
0.0.0.0/0 |
What addresses this gain access from this entry |
postgresql_hba_entries[4 ].auth_method |
md5 |
What authentication method to to use for the users |
Read more about PostgreSQL configuration here.
Install using Bootstrap CLI
To list the available flags, execute tyk-analytics bootstrap -h
:
usage: tyk-analytics bootstrap [<flags>]
Bootstrap the Dashboard.
Flags:
-h, --help Show context-sensitive help (also try --help-long and --help-man).
--version Show application version.
--conf="tyk_analytics.conf"
Load a named configuration file.
--create-org Create a new organisation.
--reuse-org=REUSE-ORG Reuse the organisation with given ID.
--drop-org=DROP-ORG Drop the organisation with given ID.
Description
The bootstrap
command makes bootstrapping easier. It helps you to create organizations and users. The command needs a
config file path. By default, it looks at tyk_analytics.conf
in the directory where the tyk-analytics
binary is located.
For example:
tyk-analytics bootstrap
You can also give the path of a custom config file with the --conf
flag. For example:
tyk-analytics bootstrap --conf some-directory/custom.conf
The tool can work in both auto and interactive modes. You can use the flags while running the command or you can just run it without flags and use interactive mode.
Environment Variables
You can override the config values by environment variables. See how to configure an environment variable.
For example, you can override hostname, port, mongo url, redis host and redis port values by exporting the following variables:
- TYK_DB_HOSTCONFIG_HOSTNAME
- TYK_DB_LISTENPORT
- TYK_DB_MONGOURL
- TYK_DB_REDISHOST
- TYK_DB_REDISPORT
Install with Docker
Tyk has three containers that are available to set up a Docker installation:
All three are required for a full deployment. We recommend that each container is installed on a separate machine for optimum performance.
From v5.5.0 onwards, these images are based on distroless. This means that you will not be able to obtain a shell with docker run --rm -it tykio/tyk-gateway:v5.5.0 sh
. The image can be inspected with tools like dive or Docker Desktop.
We also have a Docker Tyk Pro Demo, which installs our full Self-Managed solution, which includes our Gateway, Dashboard, and analytics processing pipeline. This demo will run Tyk Self-Managed on your machine.
Install on Heroku
Install Tyk API Gateway on Heroku
A full Tyk Self-Managed installation can be deployed to Heroku dynos and workers using Heroku Container Registry and Runtime functionality. This guide will utilize Tyk Docker images with a small amount of customization as well as an external MongoDB service.
Prerequisites
- Docker daemon installed and running locally
- Heroku account, the free plan is sufficient for a basic PoC but not recommended for production usage
- Heroku CLI installed
- MongoDB service (such as Atlas, mLab, Compose or your own deployment), this guide is based on MongoDB Atlas but others should work as well
- Tyk License (note that in case of running multiple gateway dynos, license type must match)
- Checkout the Tyk quickstart repository from GitHub
- Python 2 or 3 in order to execute the bootstrap script
Creating Heroku Apps
We will create two Heroku apps, one for the Tyk Gateway (with Redis add-on attached to it) and another for the Dashboard and Pump.
Given Heroku CLI is installed and your Heroku account is available, log into it:
heroku login
Now create the Gateway app and note down its name:
heroku create
Creating app... done, ⬢ infinite-plains-14949
https://infinite-plains-14949.herokuapp.com/ | https://git.heroku.com/infinite-plains-14949.git
Note
--space
flag must be added to the command if the app is being created in a private space, see more details in the section on Heroku private spaces (below).
Provision a Redis add-on (we’ll use a hobby-dev
plan for demonstration purposes but that’s not suitable for production), replacing the app name with your own:
heroku addons:create heroku-redis:hobby-dev -a infinite-plains-14949
Creating heroku-redis:hobby-dev on ⬢ infinite-plains-14949... free
Your add-on should be available in a few minutes.
! WARNING: Data stored in hobby plans on Heroku Redis are not persisted.
redis-infinite-35445 is being created in the background. The app will restart when complete...
Use heroku addons:info redis-infinite-35445 to check creation progress
Use heroku addons:docs heroku-redis to view documentation
Once add-on provisioning is done, the info command (replacing the add-on name with your own) will show the following output:
heroku addons:info redis-infinite-35445
=== redis-infinite-35445
Attachments: infinite-plains-14949::REDIS
Installed at: Sun May 18 2018 14:23:21 GMT+0300 (EEST)
Owning app: infinite-plains-14949
Plan: heroku-redis:hobby-dev
Price: free
State: created
Time to create the Dasboard app and note down its name as well:
heroku create
Creating app... done, ⬢ evening-beach-40625
https://evening-beach-40625.herokuapp.com/ | https://git.heroku.com/evening-beach-40625.git
Since the Dashboard and Pump need access to the same Redis instance as the gateway, we’ll need to share the Gateway app’s add-on with this new app:
heroku addons:attach infinite-plains-14949::REDIS -a evening-beach-40625
Attaching redis-infinite-35445 to ⬢ evening-beach-40625... done
Setting REDIS config vars and restarting ⬢ evening-beach-40625... done, v3
To check that both apps have access to the same Redis add-on, we can utilize the heroku config
command and check for the Redis endpoint:
heroku config -a infinite-plains-14949 | grep REDIS_URL
heroku config -a evening-beach-40625 | grep REDIS_URL
Their outputs should match.
Deploy the Dashboard
It’s recommended to start with the Dashboard so in your Heroku quickstart clone run:
cd analytics
ls dashboard
bootstrap.sh Dockerfile.web entrypoint.sh tyk_analytics.conf
You will find it contains a Dockerfile.web
for the web dyno, a config file for the Dashboard, entrypoint script for the Docker container and a bootstrap script for seeding the dashboard instance with sample data. All these files are editable for your purposes but have sane defaults for a PoC.
Note
You can use the FROM
statement in Dockerfile.web
to use specific dashboard version and upgrade when needed instead of relying on the latest
tag.
The Dashboard configuration can be changed by either editing the tyk_analytics.conf
file or injecting them as environment variables via heroku config
. In this guide we’ll use the latter for simplicity of demonstration but there is merit to both methods.
First let’s set the license key:
heroku config:set TYK_DB_LICENSEKEY="your license key here" -a evening-beach-40625
Setting TYK_DB_LICENSEKEY and restarting ⬢ evening-beach-40625... done, v4
TYK_DB_LICENSEKEY: should show your license key here
Now the MongoDB endpoint (replacing with your actual endpoint):
heroku config:set TYK_DB_MONGOURL="mongodb://user:[email protected]:27017,mongosecondary.net:27017,mongotertiary.net:27017" -a evening-beach-40625
Setting TYK_DB_MONGOURL and restarting ⬢ evening-beach-40625... done, v5
TYK_DB_MONGOURL: mongodb://user:[email protected]:27017,mongosecondary.net:27017,mongotertiary.net:27017
And enable SSL for it if your service supports/requires this:
heroku config:set TYK_DB_MONGOUSESSL="true" -a evening-beach-40625
Setting TYK_DB_MONGOUSESSL and restarting ⬢ evening-beach-40625... done, v6
TYK_DB_MONGOUSESSL: true
Since the Tyk Dashboard needs to access gateways sometimes, we’ll need to specify the Gateway endpoint too, which is the Gateway app’s URL:
heroku config:set TYK_DB_TYKAPI_HOST="https://infinite-plains-14949.herokuapp.com" -a evening-beach-40625
heroku config:set TYK_DB_TYKAPI_PORT="443" -a evening-beach-40625
Setting TYK_DB_TYKAPI_HOST and restarting ⬢ evening-beach-40625... done, v7
TYK_DB_TYKAPI_HOST: https://infinite-plains-14949.herokuapp.com
Setting TYK_DB_TYKAPI_PORT and restarting ⬢ evening-beach-40625... done, v8
TYK_DB_TYKAPI_PORT: 443
This is enough for a basic Dashboard setup but we recommend also changing at least node and admin secrets with strong random values, as well as exploring other config options.
Since the Tyk Pump is also a part of this application (as a worker process), we’ll need to configure it too.
ls pump
Dockerfile.pump entrypoint.sh pump.conf
Same principles apply here as well. Here we’ll need to configure MongoDB endpoints for all the Pumps (this can also be done in the pump.conf
file):
heroku config:set PMP_MONGO_MONGOURL="mongodb://user:[email protected]:27017,mongosecondary.net:27017,mongotertiary.net:27017" -a evening-beach-40625
heroku config:set PMP_MONGO_MONGOUSESSL="true"
heroku config:set PMP_MONGOAGG_MONGOURL="mongodb://user:[email protected]:27017,mongosecondary.net:27017,mongotertiary.net:27017" -a evening-beach-40625
heroku config:set PMP_MONGOAGG_MONGOUSESSL="true"
With the configuration in place it’s finally time to deploy our app to Heroku.
First, make sure CLI is logged in to Heroku containers registry:
heroku container:login
Login Succeeded
Provided you’re currently in analytics
directory of the quickstart repo:
heroku container:push --recursive -a evening-beach-40625
=== Building web (/tyk-heroku-docker/analytics/dashboard/Dockerfile.web)
Sending build context to Docker daemon 8.192kB
Step 1/5 : FROM tykio/tyk-dashboard:v1.6.1
---> fdbc67b43139
Step 2/5 : COPY tyk_analytics.conf /opt/tyk-dashboard/tyk_analytics.conf
---> 89be9913798b
Step 3/5 : COPY entrypoint.sh /opt/tyk-dashboard/entrypoint.sh
---> c256152bff29
Step 4/5 : ENTRYPOINT ["/bin/sh", "-c"]
---> Running in bc9fe7a569c0
Removing intermediate container bc9fe7a569c0
---> f40e6b259230
Step 5/5 : CMD ["/opt/tyk-dashboard/entrypoint.sh"]
---> Running in 705273810eea
Removing intermediate container 705273810eea
---> abe9f10e8b21
Successfully built abe9f10e8b21
Successfully tagged registry.heroku.com/evening-beach-40625/web:latest
=== Building pump (/tyk-heroku-docker/analytics/pump/Dockerfile.pump)
Sending build context to Docker daemon 5.12kB
Step 1/5 : FROM tykio/tyk-pump-docker-pub:v0.5.2
---> 247c6b5795a9
Step 2/5 : COPY pump.conf /opt/tyk-pump/pump.conf
---> 1befeab8f092
Step 3/5 : COPY entrypoint.sh /opt/tyk-pump/entrypoint.sh
---> f8ad0681aa70
Step 4/5 : ENTRYPOINT ["/bin/sh", "-c"]
---> Running in 0c30d35b9e2b
Removing intermediate container 0c30d35b9e2b
---> b17bd6a8ed44
Step 5/5 : CMD ["/opt/tyk-pump/entrypoint.sh"]
---> Running in a16acb453b62
Removing intermediate container a16acb453b62
---> 47ac9f221d8d
Successfully built 47ac9f221d8d
Successfully tagged registry.heroku.com/evening-beach-40625/pump:latest
=== Pushing web (/tyk-heroku-docker/analytics/dashboard/Dockerfile.web)
The push refers to repository [registry.heroku.com/evening-beach-40625/web]
c60cf00e6e9b: Pushed
11d074829795: Pushed
8b72aa2b2acc: Pushed
ca2feecf234c: Pushed
803aafd71223: Pushed
43efe85a991c: Pushed
latest: digest: sha256:b857afaa69154597558afb2462896275ab667b729072fac224487f140427fa73 size: 1574
=== Pushing pump (/tyk-heroku-docker/analytics/pump/Dockerfile.pump)
The push refers to repository [registry.heroku.com/evening-beach-40625/pump]
eeddc94b8282: Pushed
37f3b3ce56ab: Pushed
4b61531ec7dc: Pushed
eca9efd615d9: Pushed
0f700064c5a1: Pushed
43efe85a991c: Mounted from evening-beach-40625/web
latest: digest: sha256:f45acaefa3b47a126dd784a888c89e420814ad3031d3d4d4885e340a59aec31c size: 1573
This has built Docker images for both dashboard and pump, as well as pushed them to Heroku registry and automatically deployed to the application.
Provided everything went well (and if not, inspect the application logs), you should be seeing the Dashboard login page at your app URL (e.g “https://evening-beach-40625.herokuapp.com/").
However, it doesn’t yet have any accounts. It order to populate it please run the dashboard/bootstrap.sh
script:
dashboard/bootstrap.sh evening-beach-40625.herokuapp.com
Creating Organization
ORGID: 5b016ca530867500050b9e90
Adding new user
USER AUTH: a0f7c1e878634a60599dc037489a880f
NEW ID: 5b016ca6dcd0056d702dc40e
Setting password
DONE
====
Login at https://evening-beach-40625.herokuapp.com/
User: [email protected]
Pass: test123
It will generate a default organization with random admin username and a specified password. The bootstrap script can be edited to suit your needs as well as just editing the user info in the dashboard.
If this was successful, you should be able to log into your dashboard now.
The last step in this app is to start the Pump worker dyno since by default only the web dyno is enabled:
heroku dyno:scale pump=1 -a evening-beach-40625
Scaling dynos... done, now running pump at 1:Free
At that point the dyno formation should look like this:
heroku dyno:scale -a evening-beach-40625
pump=1:Free web=1:Free
Deploy the Gateway
The process is very similar for the Tyk Gateway, except it doesn’t have a worker process and doesn’t need access to MongoDB.
cd ../gateway
ls
Dockerfile.web entrypoint.sh tyk.conf
All these files serve the same purpose as with the Dasboard and the Pump. Configuration can either be edited in tyk.conf
or injected with heroku config
.
To get things going we’ll need to set following options for the Dashboard endpoint (substituting the actual endpoint and the app name, now for the gateway app):
heroku config:set TYK_GW_DBAPPCONFOPTIONS_CONNECTIONSTRING="https://evening-beach-40625.herokuapp.com" -a infinite-plains-14949
heroku config:set TYK_GW_POLICIES_POLICYCONNECTIONSTRING="https://evening-beach-40625.herokuapp.com" -a infinite-plains-14949
Setting TYK_GW_DBAPPCONFOPTIONS_CONNECTIONSTRING and restarting ⬢ infinite-plains-14949... done, v4
TYK_GW_DBAPPCONFOPTIONS_CONNECTIONSTRING: https://evening-beach-40625.herokuapp.com
Setting TYK_GW_POLICIES_POLICYCONNECTIONSTRING and restarting ⬢ infinite-plains-14949... done, v5
TYK_GW_POLICIES_POLICYCONNECTIONSTRING: https://evening-beach-40625.herokuapp.com
Since the Redis configuration will be automatically discovered (it’s already injected by Heroku), we’re ready to deploy:
heroku container:push --recursive -a infinite-plains-14949
=== Building web (/tyk-heroku-docker/gateway/Dockerfile.web)
Sending build context to Docker daemon 6.144kB
Step 1/5 : FROM tykio/tyk-gateway:v2.6.1
---> f1201002e0b7
Step 2/5 : COPY tyk.conf /opt/tyk-gateway/tyk.conf
---> b118611dc36b
Step 3/5 : COPY entrypoint.sh /opt/tyk-gateway/entrypoint.sh
---> 68ad364030cd
Step 4/5 : ENTRYPOINT ["/bin/sh", "-c"]
---> Running in 859f4c15a0d2
Removing intermediate container 859f4c15a0d2
---> 5f8c0d1b378a
Step 5/5 : CMD ["/opt/tyk-gateway/entrypoint.sh"]
---> Running in 44c5e4c87708
Removing intermediate container 44c5e4c87708
---> 86a9eb509968
Successfully built 86a9eb509968
Successfully tagged registry.heroku.com/infinite-plains-14949/web:latest
=== Pushing web (/tyk-heroku-docker/gateway/Dockerfile.web)
The push refers to repository [registry.heroku.com/infinite-plains-14949/web]
b8a4c3e3f93c: Pushed
0b7bae5497cd: Pushed
e8964f363bf4: Pushed
379aae48d347: Pushed
ab2b28b92877: Pushed
021ee50b0983: Pushed
43efe85a991c: Mounted from evening-beach-40625/pump
latest: digest: sha256:d67b8f55d729bb56e06fe38e17c2016a36f2edcd4f01760c0e62a13bb3c9ed38 size: 1781
Inspect the logs (heroku logs -a infinite-plains-14949
) to check that deployment was successful, also the node should be registered by the Dashboard in “System Management” -> “Nodes and Licenses” section.
You’re ready to follow the guide on creating and managing your APIs with this Heroku deployment.
Note
To use the geographic log distribution feature in the Dashboard please supply the GeoLite2 DB in the gateway
directory, uncomment the marked line in Dockerfile.web
and set the analytics_config.enable_geo_ip
setting (or TYK_GW_ANALYTICSCONFIG_ENABLEGEOIP
env var) to true
.
Heroku Private Spaces
Most instructions are valid for Heroku Private Spaces runtime. However there are several differences to keep in mind.
Heroku app creation commands must include the private space name in the --space
flag, e.g.:
heroku create --space test-space-virginia
When deploying to the app, the container must be released manually after pushing the image to the app:
heroku container:push --recursive -a analytics-app-name
heroku container:release web -a analytics-app-name
heroku container:release pump -a analytics-app-name
Similarly, the Gateway:
heroku container:push --recursive -a gateway-app-name
heroku container:release web -a gateway-app-name
Please allow several minutes for the first deployment to start as additional infrastructure is being created for it. Next deployments are faster.
Private spaces maintain stable set of IPs that can be used for allowing fixed set of IPs on your upstream side (e.g. on an external database service). Find them using the following command:
heroku spaces:info --space test-space-virginia
Alternatively VPC peering can be used with the private spaces if external service supports it. This way exposure to external network can be avoided. For instance, see MongoDB Atlas guide for setting this up.
The minimal Heroku Redis add-on plan that installs into your private space is currently private-7
. Please refer to Heroku’s Redis with private spaces guide for more information.
Apps in private spaces don’t enable SSL/TLS by default. It needs to be configured in the app settings along with the domain name for it. If it’s not enabled, please make sure that configs that refer to corresponding hosts are using HTTP instead of HTTPS and related ports (80 for HTTP).
Gateway Plugins
In order to enable rich plugins for the Gateway, please set the following Heroku config option to either python
or lua
depending on the type of plugins used:
heroku config:set TYK_PLUGINS="python" -a infinite-plains-14949
Setting TYK_PLUGINS and restarting ⬢ infinite-plains-14949... done, v9
TYK_PLUGINS: python
After re-starting the Gateway, the logs should be showing something similar to this:
2018-05-18T13:13:50.272511+00:00 app[web.1]: Tyk will be using python plugins
2018-05-18T13:13:50.311510+00:00 app[web.1]: time="May 18 13:13:50" level=info msg="Setting PYTHONPATH to 'coprocess/python:middleware/python:event_handlers:coprocess/python/proto'"
2018-05-18T13:13:50.311544+00:00 app[web.1]: time="May 18 13:13:50" level=info msg="Initializing interpreter, Py_Initialize()"
2018-05-18T13:13:50.497815+00:00 app[web.1]: time="May 18 13:13:50" level=info msg="Initializing dispatcher"
Set this variable back to an empty value in order to revert back to the default behavior.
Upgrading or Customizing Tyk
Since this deployment is based on Docker images and containers, upgrading or making changes to the deployment is as easy as building a new image and pushing it to the registry.
Specifically, upgrading version of any Tyk components is done by editing the corresponding Dockerfile
and replacing the base image version tag. E.g. changing FROM tykio/tyk-gateway:v2.5.4
to FROM tykio/tyk-gateway:v2.6.1
will pull the Tyk gateway 2.6.1. We highly recommend specifying concrete version tags instead of latest
for better house keeping.
Once these changes have been made just run heroku container:push --recursive -a app_name
on the corresponding directory as shown previously in this guide. This will do all the building and pushing as well as gracefully deploying on your Heroku app.
Please refer to Heroku documentation on containers and registry for more information.
Install on Microsoft Azure
Azure is Microsoft’s cloud services platform. It supports both the running of Ubuntu Servers, as well as Docker and Docker-Compose.
For more details, see the Azure Documentation.
**Tyk Installation Options for Azure **
Azure allows you to install Tyk in the following ways:
On-Premises
- Via our Ubuntu Setup on an installed Ubuntu Server on Azure.
- Via our Docker Installation using Azure’s Docker support.
See our video for installing Tyk on Ubuntu via Azure:
We also have a blog post that walks you through installing Tyk on Azure.
Install to Google Cloud
GCP is Google’s Cloud services platform. It supports both the running of Ubuntu Servers and Docker.
For more details, see the Google Cloud Documentation.
**Tyk Installation Options for Google CLoud **
Google Cloud allows you to install Tyk in the following ways:
On-Premises
- Via our Ubuntu Setup on an installed Ubuntu Server within Google Cloud.
- Via our Docker Installation using Google Cloud’s Docker support.
Tyk Pump on GCP
When running Tyk Pump in GCP using Cloud Run it is available 24/7. However, since it is serverless you also need to ensure that the CPU always allocated option is configured to ensure availability of the analytics. Otherwise, for each request there will be a lag between the Tyk Pump container starting up and having the CPU allocated. Subsequently, the analytics would only be available during this time.
-
Configure Cloud Run to have the CPU always allocated option enabled. Otherwise, the Tyk Pump container needs to warm up, which takes approximately 1 min. Subsequently, by this time the stats are removed from Redis.
-
Update the Tyk Gateway configuration to keep the stats for 3 mins to allow Tyk Pump to process them. This value should be greater than the Pump purge delay to ensure the analytics data exists long enough in Redis to be processed by the Pump.
Install Tyk on Red Hat (RHEL / CentOS)
Select the preferred way of installing Tyk by selecting Shell or Ansible tab for instructions. There are 4 components which needs to be installed. Each can be installed via shell or ansible
Install Database
Using Shell
Supported Distributions
Distribution | Version | Supported |
---|---|---|
CentOS | 7 | ✅ |
RHEL | 9 | ✅ |
RHEL | 8 | ✅ |
RHEL | 7 | ✅ |
Install and Configure Dependencies
Redis
Tyk Gateway has a dependency on Redis. Follow the steps provided by Red Hat to make the installation of Redis, conducting a search for the correct version and distribution.
Storage Database
Tyk Dashboard has a dependency on a storage database that can be PostgreSQL or MongoDB.
Option 1: Install PostgreSQL
Check the PostgreSQL supported versions. Follow the steps provided by PostgreSQL to install it.
Configure PostgreSQL
Create a new role/user
sudo -u postgres createuser --interactive
The name of the role can be “tyk” and say yes to make it a superuser
Create a matching DB with the same name. Postgres authentication system assumes by default that for any role used to log in, that role will have a database with the same name which it can access.
sudo -u postgres createdb tyk
Add another user to be used to log into your operating system
sudo adduser tyk
Log in to your Database
sudo -u tyk psql
Update the user “tyk” to have a password
ALTER ROLE tyk with PASSWORD '123456';
Create a DB (my example is tyk_analytics)
sudo -u tyk createdb tyk_analytics
Option 2: Install MongoDB
Check the MongoDB supported versions. Follow the steps provided by MongoDB to install it.
Optionally initialize the database and enable automatic start:
# Optionally ensure that MongoDB will start following a system reboot
sudo systemctl enable mongod
# start MongoDB server
sudo systemctl start mongod
Using Ansible
You can install Tyk on RHEL or CentOS using our YUM repositories. Follow the guides and tutorials in this section to have Tyk up and running in no time.
The order is to install Tyk Dashboard, then Tyk Pump and then Tyk Gateway for a full stack.
Note
For a production environment, we recommend that the Tyk Gateway, Tyk Dashboard and Tyk Pump are installed on separate machines. If installing multiple Tyk Gateways, you should install each on a separate machine. See Planning for Production for more details.
Supported Distributions
Distribution | Version | Supported |
---|---|---|
CentOS | 7 | ✅ |
RHEL | 8 | ✅ |
RHEL | 7 | ✅ |
Requirements
Ansible - required for running the commands below.
Getting Started
-
clone the tyk-ansible repositry
$ git clone https://github.com/TykTechnologies/tyk-ansible
-
cd
into the directory
$ cd tyk-ansible
-
Run initialisation script to initialise environment
$ sh scripts/init.sh
-
Modify
hosts.yml
file to update ssh variables to your server(s). You can learn more about the hosts file here -
Run ansible-playbook to install the following:
- Redis
- MongoDB or PostgreSQL
- Tyk Dashboard
- Tyk Gateway
- Tyk Pump
$ ansible-playbook playbook.yaml -t tyk-pro -t redis -t `mongodb` or `pgsql`
You can choose to not install Redis, MongoDB or PostgreSQL by removing the
-t redis
or-t mongodb
or-t pgsql
However Redis and MongoDB or PostgreSQL are a requirement and need to be installed for the Tyk Pro installation to run.
Variables
vars/tyk.yaml
Variable | Default | Comments |
---|---|---|
secrets.APISecret | 352d20ee67be67f6340b4c0605b044b7 |
API secret |
secrets.AdminSecret | 12345 |
Admin secret |
redis.host | Redis server host if different than the hosts url | |
redis.port | 6379 |
Redis server listening port |
redis.pass | Redis server password | |
redis.enableCluster | false |
Enable if redis is running in cluster mode |
redis.storage.database | 0 |
Redis server database |
redis.tls | false |
Enable if redis connection is secured with SSL |
mongo.host | MongoDB server host if different than the hosts url | |
mongo.port | 27017 |
MongoDB server listening port |
mongo.tls | false |
Enable if mongo connection is secured with SSL |
pgsql.host | PGSQL server host if different than the hosts url | |
pgsql.port | 5432 |
PGSQL server listening port |
pgsql.tls | false |
Enable if pgsql connection is secured with SSL |
dash.license | Dashboard license | |
dash.service.host | Dashboard server host if different than the hosts url | |
dash.service.port | 3000 |
Dashboard server listening port |
dash.service.proto | http |
Dashboard server protocol |
dash.service.tls | false |
Set to true to enable SSL connections |
gateway.service.host | Gateway server host if different than the hosts url | |
gateway.service.port | 8080 |
Gateway server listening port |
gateway.service.proto | http |
Gateway server protocol |
gateway.service.tls | false |
Set to true to enable SSL connections |
gateway.sharding.enabled | false |
Set to true to enable filtering (sharding) of APIs |
gateway.sharding.tags | The tags to use when filtering (sharding) Tyk Gateway nodes. Tags are processed as OR operations. If you include a non-filter tag (e.g. an identifier such as node-id-1 , this will become available to your Dashboard analytics) |
|
gateway.rpc.connString | Use this setting to add the URL for your MDCB or load balancer host | |
gateway.rpc.useSSL | true |
Set this option to true to use an SSL RPC connection |
gateway.rpc.sslInsecureSkipVerify | true |
Set this option to true to allow the certificate validation (certificate chain and hostname) to be skipped. This can be useful if you use a self-signed certificate |
gateway.rpc.rpcKey | Your organization ID to connect to the MDCB installation | |
gateway.rpc.apiKey | This the API key of a user used to authenticate and authorize the Gateway’s access through MDCB. The user should be a standard Dashboard user with minimal privileges so as to reduce any risk if the user is compromised. The suggested security settings are read for Real-time notifications and the remaining options set to deny | |
gateway.rpc.groupId | This is the zone that this instance inhabits, e.g. the cluster/data-center the Gateway lives in. The group ID must be the same across all the Gateways of a data-center/cluster which are also sharing the same Redis instance. This ID should also be unique per cluster (otherwise another Gateway cluster can pick up your keyspace events and your cluster will get zero updates). |
vars/redis.yaml
Variable | Default | Comments |
---|---|---|
redis_bind_interface | 0.0.0.0 |
Binding address of Redis |
Read more about Redis configuration here.
vars/mongodb.yaml
Variable | Default | Comments |
---|---|---|
bind_ip | 0.0.0.0 |
Binding address of MongoDB |
mongodb_version | 4.4 |
MongoDB version |
Read more about MongoDB configuration here.
vars/pgsql.yaml
Variable | Default | Comments |
---|---|---|
postgresql_databases[] | [] |
Array of DBs to be created |
postgresql_databases[].name | tyk_analytics |
Database name |
postgresql_users[] | [] |
Array of users to be created |
postgresql_users[0 ].name |
default |
User name |
postgresql_users[0 ].password |
topsecretpassword |
User password |
postgresql_global_config_options[] | [] |
Postgres service config options |
postgresql_global_config_options[1 ].option |
listen_addresses |
Listen address binding for the service |
postgresql_global_config_options[1 ].value |
* |
Default value to listen to all addresses |
postgresql_hba_entries[] | [] |
Host based authenticaiton list |
postgresql_hba_entries[4 ].type |
host |
Entry type |
postgresql_hba_entries[4 ].database |
tyk_analytics |
Which database this entry will give access to |
postgresql_hba_entries[4 ].user |
default |
What users this gain access from this entry |
postgresql_hba_entries[4 ].address |
0.0.0.0/0 |
What addresses this gain access from this entry |
postgresql_hba_entries[4 ].auth_method |
md5 |
What authentication method to to use for the users |
Read more about PostgreSQL configuration here.
Install Dashboard
Using Shell
Tyk has its own signed RPMs in a YUM repository hosted by the kind folks at packagecloud.io, which makes it easy, safe and secure to install a trusted distribution of the Tyk Gateway stack.
This configuration should also work (with some tweaks) for CentOS.
Prerequisites
- Ensure port
3000
is open: This is used by the Dashboard to provide the GUI and the Classic Developer Portal. - Follow the steps provided in this link Getting started on Red Hat (RHEL / CentOS) to install and configure Tyk dependencies.
-
Set up YUM Repositories
First, install two package management utilities
yum-utils
and a file downloading toolwget
:sudo yum install yum-utils wget
Then install Python:
sudo yum install python3
-
Configure and Install the Tyk Dashboard
Create a file named
/etc/yum.repos.d/tyk_tyk-dashboard.repo
that contains the repository configuration settings for YUM repositoriestyk_tyk-dashboard
andtyk_tyk-dashboard-source
used to download packages from the specified URLs, including GPG key verification and SSL settings, on a Linux system.Make sure to replace
el
and8
in the config below with your Linux distribution and version:[tyk_tyk-dashboard] name=tyk_tyk-dashboard baseurl=https://packagecloud.io/tyk/tyk-dashboard/el/8/$basearch repo_gpgcheck=1 gpgcheck=0 enabled=1 gpgkey=https://packagecloud.io/tyk/tyk-dashboard/gpgkey sslverify=1 sslcacert=/etc/pki/tls/certs/ca-bundle.crt metadata_expire=300 [tyk_tyk-dashboard-source] name=tyk_tyk-dashboard-source baseurl=https://packagecloud.io/tyk/tyk-dashboard/el/8/SRPMS repo_gpgcheck=1 gpgcheck=0 enabled=1 gpgkey=https://packagecloud.io/tyk/tyk-dashboard/gpgkey sslverify=1 sslcacert=/etc/pki/tls/certs/ca-bundle.crt metadata_expire=300
We’ll need to update the YUM package manager’s local cache, enabling only the
tyk_tyk-dashboard
repository while disabling all other repositories--disablerepo='*' --enablerepo='tyk_tyk-dashboard'
, and confirm all prompts-y
.sudo yum -q makecache -y --disablerepo='*' --enablerepo='tyk_tyk-dashboard'
Install Tyk dashboard:
sudo yum install -y tyk-dashboard
-
Confirm Redis and MongoDB or PostgreSQL are running
Start Redis since it is always required by the Dashboard.
sudo service redis start
Then start either MongoDB or PostgreSQL depending on which one you are using.
sudo systemctl start mongod
sudo systemctl start postgresql-13
-
Configure Tyk Dashboard
We can set the Dashboard up with a similar setup command, the script below will get the Dashboard set up for the local instance. Make sure to use the actual DNS hostname or the public IP of your instance as the last parameter.
sudo /opt/tyk-dashboard/install/setup.sh --listenport=3000 --redishost=<Redis Hostname> --redisport=6379 --mongo=mongodb://<Mongo IP Address>:<Mongo Port>/tyk_analytics --tyk_api_hostname=$HOSTNAME --tyk_node_hostname=http://localhost --tyk_node_port=8080 --portal_root=/portal --domain="XXX.XXX.XXX.XXX"
Replace <Redis Hostname>
, <Mongo IP Address>
and <Mongo Port>
with your own values to run this script.
sudo /opt/tyk-dashboard/install/setup.sh --listenport=3000 --redishost=<Redis Hostname> --redisport=6379 --storage=postgres --connection_string=postgresql://<User>:<Password>@<PostgreSQL Hostname>:<PostgreSQL Port>/<PostgreSQL DB> --tyk_api_hostname=$HOSTNAME --tyk_node_hostname=http://localhost --tyk_node_port=8080 --portal_root=/portal --domain="XXX.XXX.XXX.XXX"
Replace <Redis Hostname>
,<PostgreSQL Hostname>
,<PostgreSQL Port>
, <PostgreSQL User>
, <PostgreSQL Password>
and <PostgreSQL DB>
with your own values to run the script.
With these values your are configuring the following:
--listenport=3000
: Tyk Dashboard (and Portal) to listen on port3000
.--redishost=<hostname>
: Tyk Dashboard should use the local Redis instance.--redisport=6379
: The Tyk Dashboard should use the default port.--domain="XXX.XXX.XXX.XXX"
: Bind the Dashboard to the IP or DNS hostname of this instance (required).--mongo=mongodb://<Mongo IP Address>:<Mongo Port>/tyk_analytics
: Use the local MongoDB (should always be the same as the Gateway).--storage=postgres
: In case, your preferred storage Database is PostgreSQL, use storage type “postgres” and specify connection string.--connection_string=postgresql://<User>:<Password>@<PostgreSQL Host Name>:<PostgreSQL Port>/<PostgreSQL DB>
: Use the PostgreSQL instance provided in the connection string (should always be the same as the gateway).--tyk_api_hostname=$HOSTNAME
: The Tyk Dashboard has no idea what hostname has been given to Tyk, so we need to tell it, in this instance we are just using the local HOSTNAME env variable, but you could set this to the public-hostname/IP of the instance.--tyk_node_hostname=http://localhost
: The Tyk Dashboard needs to see a Tyk node in order to create new tokens, so we need to tell it where we can find one, in this case, use the one installed locally.--tyk_node_port=8080
: Tell the Dashboard that the Tyk node it should communicate with is on port 8080.--portal_root=/portal
: We want the Portal to be shown on /portal of whichever domain we set for the Portal.
-
Start Tyk Dashboard
sudo service tyk-dashboard start
Note
To check the logs from the deployment run:
sudo journalctl -u tyk-dashboard
Notice how we haven’t actually started the gateway yet, because this is a Dashboard install, we need to enter a license first.
Note
When using PostgreSQL you may receive the error:
"failed SASL auth (FATAL: password authentication failed for user...)"
, follow these steps to address the issue:- Open the terminal or command prompt on your PostgreSQL server.
- Navigate to the location of the
pg_hba.conf
file. This file is typically located at/var/lib/pgsql/13/data/pg_hba.conf
. - Open the
pg_hba.conf
file using a text manipulation tool. - In the
pg_hba.conf
file, locate the entry corresponding to the user encountering the authentication error. This entry might resemble the following:
host all all <IP_address>/<netmask> scram-sha-256
- In the entry, find the METHOD column. It currently has the value scram-sha-256.
- Replace scram-sha-256 with md5, so the modified entry looks like this:
host all all <IP_address>/<netmask> md5
- Save the changes you made to the
pg_hba.conf
file. - Restart the PostgreSQL service to apply the modifications:
sudo systemctl restart postgresql-13
-
Enter Dashboard license
Add your license in
/var/opt/tyk-dashboard/tyk_analytics.conf
in thelicense
field.If all is going well, you will be taken to a Dashboard setup screen - we’ll get to that soon.
-
Restart the Dashboard process
Because we’ve just entered a license via the UI, we need to make sure that these changes get picked up, so to make sure things run smoothly, we restart the Dashboard process (you only need to do this once) and (if you have it installed) then start the gateway:
sudo service tyk-dashboard restart
-
Go to the Tyk Dashboard URL
Go to the following URL to access to the Tyk Dashboard:
127.0.0.1:3000
You should get to the Tyk Dashboard Setup screen:
-
Create your Organization and Default User
You need to enter the following:
- Your Organization Name
- Your Organization Slug
- Your User Email Address
- Your User First and Last Name
- A Password for your User
- Re-enter your user Password
Note
For a password, we recommend a combination of alphanumeric characters, with both upper and lower case letters.
Click Bootstrap to save the details.
-
Login to the Dashboard
You can now log in to the Tyk Dashboard from
127.0.0.1:3000
, using the username and password created in the Dashboard Setup screen.Configure your Developer Portal
To set up your Developer Portal follow our Self-Managed tutorial on publishing an API to the Portal Catalog.
Using Ansible
Getting Started
- clone the tyk-ansible repository
$ git clone https://github.com/TykTechnologies/tyk-ansible
cd
into the directory
$ cd tyk-ansible
- Run initialisation script to initialise environment
$ sh scripts/init.sh
-
Modify
hosts.yml
file to update ssh variables to your server(s). You can learn more about the hosts file here -
Run ansible-playbook to install
tyk-dashboard
$ ansible-playbook playbook.yaml -t tyk-dashboard
Supported Distributions
Distribution | Version | Supported |
---|---|---|
Amazon Linux | 2 | ✅ |
CentOS | 8 | ✅ |
CentOS | 7 | ✅ |
RHEL | 8 | ✅ |
RHEL | 7 | ✅ |
Variables
vars/tyk.yaml
Variable | Default | Comments |
---|---|---|
secrets.APISecret | 352d20ee67be67f6340b4c0605b044b7 |
API secret |
secrets.AdminSecret | 12345 |
Admin secret |
dash.license | Dashboard license | |
dash.service.host | Dashboard server host if different than the hosts url | |
dash.service.port | 3000 |
Dashboard server listening port |
dash.service.proto | http |
Dashboard server protocol |
dash.service.tls | false |
Set to true to enable SSL connections |
Install Pump
Using Shell
Tyk has it’s own signed RPMs in a YUM repository hosted by the kind folks at packagecloud.io, which makes it easy, safe and secure to install a trusted distribution of the Tyk Gateway stack.
This tutorial will run on an Amazon AWS Red Hat Enterprise Linux 7.1 instance. We will install Tyk Pump with all dependencies stored locally.
We’re installing on a t2.micro
because this is a tutorial, you’ll need more RAM and more cores for better performance.
This configuration should also work (with some tweaks) for CentOS.
Prerequisites
We are assuming that Redis and either MongoDB or SQL are installed (these are installed as part of the Tyk Gateway and Dashboard installation guides)
Step 1: Set up YUM Repositories
First, we need to install some software that allows us to use signed packages:
sudo yum install pygpgme yum-utils wget
Next, we need to set up the various repository configurations for Tyk and MongoDB:
Create a file named /etc/yum.repos.d/tyk_tyk-pump.repo
that contains the repository configuration below:
Make sure to replace el
and 7
in the config below with your Linux distribution and version:
[tyk_tyk-pump]
name=tyk_tyk-pump
baseurl=https://packagecloud.io/tyk/tyk-pump/el/7/$basearch
repo_gpgcheck=1
gpgcheck=1
enabled=1
gpgkey=https://keyserver.tyk.io/tyk.io.rpm.signing.key.2020
https://packagecloud.io/tyk/tyk-pump/gpgkey
sslverify=1
sslcacert=/etc/pki/tls/certs/ca-bundle.crt
metadata_expire=300
Finally we’ll need to update our local cache, so run:
sudo yum -q makecache -y --disablerepo='*' --enablerepo='tyk_tyk-pump'
Step 2: Install Packages
We’re ready to go, you can now install the relevant packages using yum:
sudo yum install -y tyk-pump
(You may be asked to accept the GPG key for our repos and when the package installs, hit yes to continue.)
Step 3: Configure Tyk Pump
If you don’t complete this step, you won’t see any analytics in your Dashboard, so to enable the analytics service, we need to ensure Tyk Pump is running and configured properly.
Configure Tyk Pump for MongoDB
Note
You need to replace <hostname>
for --redishost=<hostname>
, and <Mongo IP Address>
, <Mongo Port>
for
–mongo=mongodb://
sudo /opt/tyk-pump/install/setup.sh --redishost=<hostname> --redisport=6379 --mongo=mongodb://<IP Address>:<Mongo Port>/tyk_analytics
Configure Tyk Pump for SQL
Note
You need to replace <hostname>
for --redishost=<hostname>
, and <Postgres Host Name>
,<Port>
, <User>
, <Password>
, <DB>
for --postgres="host=<Postgres Host Name> port=<Port> user=<User> password=<Password> dbname=<DB>"
with your own values to run this script.
sudo /opt/tyk-pump/install/setup.sh --redishost=<hostname> --redisport=6379 --postgres="host=<Postgres Host Name> port=<Port> user=<User> password=<Password> dbname=<DB>"
Step 4: Start Tyk Pump
sudo service tyk-pump start
That’s it, the Pump should now be up and running.
You can verify if Tyk Pump is running and working by accessing the logs:
sudo journalctl -u tyk-pump
Using Ansible
Getting Started
- clone the tyk-ansible repositry
$ git clone https://github.com/TykTechnologies/tyk-ansible
cd
into the directory
$ cd tyk-ansible
- Run initialisation script to initialise environment
$ sh scripts/init.sh
-
Modify
hosts.yml
file to update ssh variables to your server(s). You can learn more about the hosts file here -
Run ansible-playbook to install
tyk-pump
$ ansible-playbook playbook.yaml -t tyk-pump
Supported Distributions
Distribution | Version | Supported |
---|---|---|
Amazon Linux | 2 | ✅ |
CentOS | 8 | ✅ |
CentOS | 7 | ✅ |
RHEL | 8 | ✅ |
RHEL | 7 | ✅ |
Install Gateway
Using Shell
Tyk has it’s own signed RPMs in a YUM repository hosted by the kind folks at packagecloud.io, which makes it easy, safe and secure to install a trusted distribution of the Tyk Gateway stack.
This tutorial will run on an Amazon AWS Red Hat Enterprise Linux 7.1 instance. We will install Tyk Gateway with all dependencies stored locally.
We’re installing on a t2.micro
because this is a tutorial, you’ll need more RAM and more cores for better performance.
This configuration should also work (with some tweaks) for CentOS.
Prerequisites
- Ensure port
8080
is open: this is used in this guide for Gateway traffic (API traffic to be proxied) - EPEL (Extra Packages for Enterprise Linux) is a free, community based repository project from Fedora which provides high quality add-on software packages for Linux distribution including RHEL, CentOS, and Scientific Linux. EPEL isn’t a part of RHEL/CentOS but it is designed for major Linux distributions. In our case we need it for Redis. Install EPEL using the instructions here.
Step 1: Set up YUM Repositories
First, we need to install some software that allows us to use signed packages:
sudo yum install pygpgme yum-utils wget
Next, we need to set up the various repository configurations for Tyk and MongoDB:
Step 2: Create Tyk Gateway Repository Configuration
Create a file named /etc/yum.repos.d/tyk_tyk-gateway.repo
that contains the repository configuration below https://packagecloud.io/tyk/tyk-gateway/install#manual-rpm:
[tyk_tyk-gateway]
name=tyk_tyk-gateway
baseurl=https://packagecloud.io/tyk/tyk-gateway/el/7/$basearch
repo_gpgcheck=1
gpgcheck=1
enabled=1
gpgkey=https://keyserver.tyk.io/tyk.io.rpm.signing.key.2020
https://packagecloud.io/tyk/tyk-gateway/gpgkey
sslverify=1
sslcacert=/etc/pki/tls/certs/ca-bundle.crt
metadata_expire=300
Step 3: Install Packages
We’re ready to go, you can now install the relevant packages using yum:
sudo yum install -y redis tyk-gateway
(you may be asked to accept the GPG key for our two repos and when the package installs, hit yes to continue)
Step 4: Start Redis
In many cases Redis will not be running, so let’s start those:
sudo service redis start
When Tyk is finished installing, it will have installed some init scripts, but it will not be running yet. The next step will be to setup the Gateway – thankfully this can be done with three very simple commands.
Using Ansible
Requirements
Ansible - required for running the commands below. Use the Shell tab for instructions to install Tyk from a shell.
Getting Started
- clone the tyk-ansible repositry
$ git clone https://github.com/TykTechnologies/tyk-ansible
cd
into the directory
$ cd tyk-ansible
- Run initialisation script to initialise environment
$ sh scripts/init.sh
-
Modify
hosts.yml
file to update ssh variables to your server(s). You can learn more about the hosts file here -
Run ansible-playbook to install
tyk-gateway
$ ansible-playbook playbook.yaml -t `tyk-gateway-pro` or `tyk-gateway-hybrid`
Supported Distributions
Distribution | Version | Supported |
---|---|---|
Amazon Linux | 2 | ✅ |
CentOS | 8 | ✅ |
CentOS | 7 | ✅ |
RHEL | 8 | ✅ |
RHEL | 7 | ✅ |
Variables
vars/tyk.yaml
Variable | Default | Comments |
---|---|---|
secrets.APISecret | 352d20ee67be67f6340b4c0605b044b7 |
API secret |
secrets.AdminSecret | 12345 |
Admin secret |
gateway.service.host | Gateway server host if different than the hosts url | |
gateway.service.port | 8080 |
Gateway server listening port |
gateway.service.proto | http |
Gateway server protocol |
gateway.service.tls | false |
Set to true to enable SSL connections |
gateway.sharding.enabled | false |
Set to true to enable filtering (sharding) of APIs |
gateway.sharding.tags | The tags to use when filtering (sharding) Tyk Gateway nodes. Tags are processed as OR operations. If you include a non-filter tag (e.g. an identifier such as node-id-1 , this will become available to your Dashboard analytics) |
|
gateway.rpc.connString | Use this setting to add the URL for your MDCB or load balancer host | |
gateway.rpc.useSSL | true |
Set this option to true to use an SSL RPC connection |
gateway.rpc.sslInsecureSkipVerify | true |
Set this option to true to allow the certificate validation (certificate chain and hostname) to be skipped. This can be useful if you use a self-signed certificate |
gateway.rpc.rpcKey | Your organization ID to connect to the MDCB installation | |
gateway.rpc.apiKey | This the API key of a user used to authenticate and authorize the Gateway’s access through MDCB. The user should be a standard Dashboard user with minimal privileges so as to reduce any risk if the user is compromised. The suggested security settings are read for Real-time notifications and the remaining options set to deny | |
gateway.rpc.groupId | This is the zone that this instance inhabits, e.g. the cluster/data-center the Gateway lives in. The group ID must be the same across all the Gateways of a data-center/cluster which are also sharing the same Redis instance. This ID should also be unique per cluster (otherwise another Gateway cluster can pick up your keyspace events and your cluster will get zero updates). |
Configure Tyk Gateway with the Dashboard
Prerequisites
This configuration assumes that you have already installed Tyk Dashboard, and have decided on the domain names for your Dashboard and your Portal. They must be different. For testing purposes, it is easiest to add hosts entries to your (and your servers) /etc/hosts
file.
Set up Tyk Gateway with Quick Start Script
You can set up the core settings for Tyk Gateway with a single setup script, however for more involved deployments, you will want to provide your own configuration file.
Note
You need to replace <hostname>
for --redishost=<hostname>
with your own value to run this script.
sudo /opt/tyk-gateway/install/setup.sh --dashboard=1 --listenport=8080 --redishost=<hostname> --redisport=6379
What we’ve done here is told the setup script that:
--dashboard=1
: We want to use the Dashboard, since Tyk Gateway gets all it’s API Definitions from the Dashboard service, as of v2.3 Tyk will auto-detect the location of the dashboard, we only need to specify that we should use this mode.--listenport=8080
: Tyk should listen on port 8080 for API traffic.--redishost=<hostname>
: Use Redis on the hostname: localhost.--redisport=6379
: Use the default Redis port.
Starting Tyk
The Tyk Gateway can be started now that it is configured. Use this command to start the Tyk Gateway:
sudo service tyk-gateway start
Pro Tip: Domains with Tyk Gateway
Tyk Gateway has full domain support built-in, you can:
- Set Tyk to listen only on a specific domain for all API traffic.
- Set an API to listen on a specific domain (e.g. api1.com, api2.com).
- Split APIs over a domain using a path (e.g. api.com/api1, api.com/api2, moreapis.com/api1, moreapis.com/api2 etc).
- If you have set a hostname for the Gateway, then all non-domain-bound APIs will be on this hostname + the
listen_path
.
Install Tyk on Debian or Ubuntu
Install Database
Using Shell
Requirements
Before installing the Tyk components in the order below, you need to first install Redis and MongoDB/SQL.
Getting Started
You should follow the online tutorial for installing MongoDb. We will be using version 4.0. As part of the Mongo installation you need to perform the following:
- Import the public key
- Create a list file
- Reload the package database
- Install the MongoDB packages
- Start MongoDB
- Check the
mongod
service is running
Install SQL
You should follow the online tutorial for installing PostgreSQL. We will be using version 13. As part of the PostgreSQL installation you need to perform the following:
- Create the file repository configuration
- Import the repository signing key
- Update the package lists
- Install the PostgreSQL packages
- Start PostgreSQL
- Check the
postgresql
service is running
See SQL configuration for details on installing SQL in a production environment.
Install Redis
$ sudo apt-get install -y redis-server
Install Tyk Pro on Ubuntu
Installing Tyk on Ubuntu is very straightforward using our APT repositories, follow the guides and tutorials in this section to have Tyk up and running in no time.
The suggested order would be to install Tyk Dashboard, then Tyk Pump and then Tyk Gateway for a full stack.
Note
For a production environment, we recommend that the Gateway, Dashboard and Pump are installed on separate machines. If installing multiple Gateways, you should install each on a separate machine. See Planning for Production For more details.
Using Ansible
Requirements
Ansible - required for running the commands below. Use the Shell tab for instructions to install Tyk from a shell.
Getting Started
- clone the tyk-ansible repositry
$ git clone https://github.com/TykTechnologies/tyk-ansible
cd
into the directory
$ cd tyk-ansible
- Run initialisation script to initialise environment
$ sh scripts/init.sh
-
Modify
hosts.yml
file to update ssh variables to your server(s). You can learn more about the hosts file here -
Run ansible-playbook to install the following:
- Redis
- MongoDB or PostgreSQL
- Tyk Dashboard
- Tyk Gateway
- Tyk Pump
$ ansible-playbook playbook.yaml -t tyk-pro -t redis -t `mongodb` or `pgsql`
You can choose to not install Redis, MongoDB or PostgreSQL by removing the -t redis
or -t mongodb
or -t pgsql
However Redis and MongoDB or PostgreSQL are a requirement and need to be installed for the Tyk Pro installation to run.
Supported Distributions
Distribution | Version | Supported |
---|---|---|
Debian | 10 | ✅ |
Debian | 9 | ✅ |
Ubuntu | 21 | ✅ |
Ubuntu | 20 | ✅ |
Ubuntu | 18 | ✅ |
Ubuntu | 16 | ✅ |
Variables
vars/tyk.yaml
Variable | Default | Comments |
---|---|---|
secrets.APISecret | 352d20ee67be67f6340b4c0605b044b7 |
API secret |
secrets.AdminSecret | 12345 |
Admin secret |
redis.host | Redis server host if different than the hosts url | |
redis.port | 6379 |
Redis server listening port |
redis.pass | Redis server password | |
redis.enableCluster | false |
Enable if redis is running in cluster mode |
redis.storage.database | 0 |
Redis server database |
redis.tls | false |
Enable if redis connection is secured with SSL |
mongo.host | MongoDB server host if different than the hosts url | |
mongo.port | 27017 |
MongoDB server listening port |
mongo.tls | false |
Enable if mongo connection is secured with SSL |
pgsql.host | PGSQL server host if different than the hosts url | |
pgsql.port | 5432 |
PGSQL server listening port |
pgsql.tls | false |
Enable if pgsql connection is secured with SSL |
dash.license | Dashboard license | |
dash.service.host | Dashboard server host if different than the hosts url | |
dash.service.port | 3000 |
Dashboard server listening port |
dash.service.proto | http |
Dashboard server protocol |
dash.service.tls | false |
Set to true to enable SSL connections |
gateway.service.host | Gateway server host if different than the hosts url | |
gateway.service.port | 8080 |
Gateway server listening port |
gateway.service.proto | http |
Gateway server protocol |
gateway.service.tls | false |
Set to true to enable SSL connections |
gateway.sharding.enabled | false |
Set to true to enable filtering (sharding) of APIs |
gateway.sharding.tags | The tags to use when filtering (sharding) Tyk Gateway nodes. Tags are processed as OR operations. If you include a non-filter tag (e.g. an identifier such as node-id-1 , this will become available to your Dashboard analytics) |
|
gateway.rpc.connString | Use this setting to add the URL for your MDCB or load balancer host | |
gateway.rpc.useSSL | true |
Set this option to true to use an SSL RPC connection |
gateway.rpc.sslInsecureSkipVerify | true |
Set this option to true to allow the certificate validation (certificate chain and hostname) to be skipped. This can be useful if you use a self-signed certificate |
gateway.rpc.rpcKey | Your organization ID to connect to the MDCB installation | |
gateway.rpc.apiKey | This the API key of a user used to authenticate and authorize the Gateway’s access through MDCB. The user should be a standard Dashboard user with minimal privileges so as to reduce any risk if the user is compromised. The suggested security settings are read for Real-time notifications and the remaining options set to deny | |
gateway.rpc.groupId | This is the zone that this instance inhabits, e.g. the cluster/data-center the Gateway lives in. The group ID must be the same across all the Gateways of a data-center/cluster which are also sharing the same Redis instance. This ID should also be unique per cluster (otherwise another Gateway cluster can pick up your keyspace events and your cluster will get zero updates). |
vars/redis.yaml
Variable | Default | Comments |
---|---|---|
redis_bind_interface | 0.0.0.0 |
Binding address of Redis |
Read more about Redis configuration here.
vars/mongodb.yaml
Variable | Default | Comments |
---|---|---|
bind_ip | 0.0.0.0 |
Binding address of MongoDB |
mongodb_version | 4.4 |
MongoDB version |
Read more about MongoDB configuration here.
vars/pgsql.yaml
Variable | Default | Comments |
---|---|---|
postgresql_databases[] | [] |
Array of DBs to be created |
postgresql_databases[].name | tyk_analytics |
Database name |
postgresql_users[] | [] |
Array of users to be created |
postgresql_users[0 ].name |
default |
User name |
postgresql_users[0 ].password |
topsecretpassword |
User password |
postgresql_global_config_options[] | [] |
Postgres service config options |
postgresql_global_config_options[1 ].option |
listen_addresses |
Listen address binding for the service |
postgresql_global_config_options[1 ].value |
* |
Default value to listen to all addresses |
postgresql_hba_entries[] | [] |
Host based authenticaiton list |
postgresql_hba_entries[4 ].type |
host |
Entry type |
postgresql_hba_entries[4 ].database |
tyk_analytics |
Which database this entry will give access to |
postgresql_hba_entries[4 ].user |
default |
What users this gain access from this entry |
postgresql_hba_entries[4 ].address |
0.0.0.0/0 |
What addresses this gain access from this entry |
postgresql_hba_entries[4 ].auth_method |
md5 |
What authentication method to to use for the users |
Read more about PostgreSQL configuration here.
Install Dashboard
Using Shell
Tyk has its own APT repositories hosted by the kind folks at packagecloud.io, which makes it easy, safe and secure to install a trusted distribution of the Tyk Gateway stack.
This tutorial has been tested on Ubuntu 16.04 & 18.04 with few if any modifications. We will install the Tyk Dashboard with all dependencies locally.
Prerequisites
- Have MongoDB/SQL and Redis installed - see here for details.
- Ensure port
3000
is available. This is used by the Tyk Dashboard to provide the GUI and the Developer Portal.
Step 1: Set up our APT Repositories
First, add our GPG key which signs our binaries:
curl -L https://packagecloud.io/tyk/tyk-dashboard/gpgkey | sudo apt-key add -
Run update:
sudo apt-get update
Since our repositories are installed via HTTPS, you will need to make sure APT supports this:
sudo apt-get install -y apt-transport-https
Now lets add the required repos and update again (notice the -a
flag in the second Tyk commands - this is important!):
echo "deb https://packagecloud.io/tyk/tyk-dashboard/ubuntu/ bionic main" | sudo tee /etc/apt/sources.list.d/tyk_tyk-dashboard.list
echo "deb-src https://packagecloud.io/tyk/tyk-dashboard/ubuntu/ bionic main" | sudo tee -a /etc/apt/sources.list.d/tyk_tyk-dashboard.list
sudo apt-get update
Note
bionic
is the code name for Ubuntu 18.04. Please substitute it with your particular ubuntu release, e.g. focal
.
What we’ve done here is:
- Added the Tyk Dashboard repository
- Updated our package list
Step 2: Install the Tyk Dashboard
We’re now ready to install the Tyk Dashboard. To install run:
sudo apt-get install -y tyk-dashboard
What we’ve done here is instructed apt-get
to install the Tyk Dashboard without prompting. Wait for the downloads to complete.
When the Tyk Dashboard has finished installing, it will have installed some init
scripts, but it will not be running yet. The next step will be to setup each application - thankfully this can be done with three very simple commands.
Verify the origin key (optional)
Debian packages are signed with the repository keys. These keys are verified at the time of fetching the package and is taken care of by the apt
infrastructure. These keys are controlled by PackageCloud, our repository provider. For an additional guarantee, it is possible to verify that the package was indeed created by Tyk by verifying the origin
certificate that is attached to the package.
First, you have to fetch Tyk’s signing key and import it.
wget https://keyserver.tyk.io/tyk.io.deb.signing.key
gpg --import tyk.io.deb.signing.key
Then, you have to either,
- sign the key with your ultimately trusted key
- trust this key ultimately
The downloaded package will be available in /var/cache/apt/archives
. Assuming you found the file tyk-gateway-2.9.4_amd64.deb
there, you can verify the origin signature.
gpg --verify d.deb
gpg: Signature made Wed 04 Mar 2020 03:05:00 IST
gpg: using RSA key F3781522A858A2C43D3BC997CA041CD1466FA2F8
gpg: Good signature from "Team Tyk (package signing) <[email protected]>" [ultimate]
Configure Tyk Dashboard
Prerequisites for MongoDB
You need to ensure the MongoDB and Redis services are running before proceeding.
Note
You need to replace <hostname>
for --redishost=<hostname>
, and <IP Address>
for --mongo=mongodb://<IP Address>/
with your own values to run this script.
You can set your Tyk Dashboard up with a helper setup command script. This will get the Dashboard set up for the local instance:
sudo /opt/tyk-dashboard/install/setup.sh --listenport=3000 --redishost=<hostname> --redisport=6379 --mongo=mongodb://<IP Address>/tyk_analytics --tyk_api_hostname=$HOSTNAME --tyk_node_hostname=http://localhost --tyk_node_port=8080 --portal_root=/portal --domain="XXX.XXX.XXX.XXX"
Note
Make sure to use the actual DNS hostname or the public IP of your instance as the last parameter.
What we have done here is:
--listenport=3000
: Told the Tyk Dashboard (and Portal) to listen on port 3000.--redishost=<hostname>
: The Tyk Dashboard should use the local Redis instance.--redisport=6379
: The Tyk Dashboard should use the default port.--domain="XXX.XXX.XXX.XXX"
: Bind the Tyk Dashboard to the IP or DNS hostname of this instance (required).--mongo=mongodb://<IP Address>/tyk_analytics
: Use the local MongoDB (should always be the same as the gateway).--tyk_api_hostname=$HOSTNAME
: The Tyk Dashboard has no idea what hostname has been given to Tyk, so we need to tell it, in this instance we are just using the local HOSTNAME env variable, but you could set this to the public-hostname/IP of the instance.--tyk_node_hostname=http://localhost
: The Tyk Dashboard needs to see a Tyk node in order to create new tokens, so we need to tell it where we can find one, in this case, use the one installed locally.--tyk_node_port=8080
: Tell the Tyk Dashboard that the Tyk node it should communicate with is on port 8080.--portal_root=/portal
: We want the portal to be shown on/portal
of whichever domain we set for the portal.
Prerequisites for SQL
You need to ensure the PostgreSQL and Redis services are running before proceeding.
Note
You need to replace <hostname>
for --redishost=<hostname>
, and <Postgres Host Name>
, <Port>
, <User>
, <Password>
, <DB>
for --connection_string="host=<Postgres Host Name> port=<Port> user=<User> password=<Password> dbname=<DB>"
with your own values to run this script.
You can set the Tyk Dashboard up with a helper setup command script. This will get the Dashboard set up for the local instance:
sudo /opt/tyk-dashboard/install/setup.sh --listenport=3000 --redishost=<hostname> --redisport=6379 --storage=postgres --connection_string="host=<Postgres Host Name> port=<Port> user=<User> password=<Password> dbname=<DB>" --tyk_api_hostname=$HOSTNAME --tyk_node_hostname=http://localhost --tyk_node_port=8080 --portal_root=/portal --domain="XXX.XXX.XXX.XXX"
Note
Make sure to use the actual DNS hostname or the public IP of your instance as the last parameter.
What we have done here is:
--listenport=3000
: Told the Tyk Dashboard (and Portal) to listen on port 3000.--redishost=<hostname>
: The Tyk Dashboard should use the local Redis instance.--redisport=6379
: The Tyk Dashboard should use the default port.--domain="XXX.XXX.XXX.XXX"
: Bind the dashboard to the IP or DNS hostname of this instance (required).--storage=postgres
: Use storage type postgres.--connection_string="host=<Postgres Host Name> port=<Port> user=<User> password=<Password> dbname=<DB>"
: Use the postgres instance provided in the connection string(should always be the same as the gateway).--tyk_api_hostname=$HOSTNAME
: The Tyk Dashboard has no idea what hostname has been given to Tyk, so we need to tell it, in this instance we are just using the local HOSTNAME env variable, but you could set this to the public-hostname/IP of the instance.--tyk_node_hostname=http://localhost
: The Tyk Dashboard needs to see a Tyk node in order to create new tokens, so we need to tell it where we can find one, in this case, use the one installed locally.--tyk_node_port=8080
: Tell the dashboard that the Tyk node it should communicate with is on port 8080.--portal_root=/portal
: We want the portal to be shown on/portal
of whichever domain we set for the portal.
Step 1: Enter your Tyk Dashboard License
Add your license in /opt/tyk-dashboard/tyk_analytics.conf
in the license
field.
Step 2: Start the Tyk Dashboard
Start the dashboard service, and ensure it will start automatically on system boot.
sudo systemctl start tyk-dashboard
sudo systemctl enable tyk-dashboard
Step 3: Install your Tyk Gateway
Follow the Gateway installation instructions to connect to your Dashboard instance before you continue on to step 4.
Step 4: Bootstrap the Tyk Dashboard with an initial User and Organization
Go to:
127.0.0.1:3000
You should get to the Tyk Dashboard Setup screen:
Step 5 - Create your Organization and Default User
You need to enter the following:
- Your Organization Name
- Your Organization Slug
- Your User Email Address
- Your User First and Last Name
- A Password for your User
- Re-enter your user Password
Note
For a password, we recommend a combination of alphanumeric characters, with both upper and lower case letters.
Click Bootstrap to save the details.
Step 6 - Login to the Tyk Dashboard
You can now log in to the Tyk Dashboard from 127.0.0.1:3000
, using the username and password created in the Dashboard Setup screen.
Configure your Developer Portal
To set up your Developer Portal follow our Self-Managed tutorial on publishing an API to the Portal Catalog.
Using Ansible
Getting Started
- clone the tyk-ansible repositry
$ git clone https://github.com/TykTechnologies/tyk-ansible
cd
into the directory
$ cd tyk-ansible
- Run initialisation script to initialise environment
$ sh scripts/init.sh
-
Modify
hosts.yml
file to update ssh variables to your server(s). You can learn more about the hosts file here -
Run ansible-playbook to install
tyk-dashboard
$ ansible-playbook playbook.yaml -t tyk-dashboard
Supported Distributions
Distribution | Version | Supported |
---|---|---|
Debian | 10 | ✅ |
Debian | 9 | ✅ |
Ubuntu | 21 | ✅ |
Ubuntu | 20 | ✅ |
Ubuntu | 18 | ✅ |
Ubuntu | 16 | ✅ |
Variables
vars/tyk.yaml
Variable | Default | Comments |
---|---|---|
secrets.APISecret | 352d20ee67be67f6340b4c0605b044b7 |
API secret |
secrets.AdminSecret | 12345 |
Admin secret |
dash.license | Dashboard license | |
dash.service.host | Dashboard server host if different than the hosts url | |
dash.service.port | 3000 |
Dashboard server listening port |
dash.service.proto | http |
Dashboard server protocol |
dash.service.tls | false |
Set to true to enable SSL connections |
Install Pump
Using Shell
This tutorial has been tested Ubuntu 16.04 & 18.04 with few if any modifications.
Prerequisites
- You have installed Redis and either MongoDB or SQL.
- You have installed the Tyk Dashboard.
Step 1: Set up our APT repositories
First, add our GPG key which signs our binaries:
curl -L https://packagecloud.io/tyk/tyk-pump/gpgkey | sudo apt-key add -
Run update:
sudo apt-get update
Since our repositories are installed via HTTPS, you will need to make sure APT supports this:
sudo apt-get install -y apt-transport-https
Now lets add the required repos and update again (notice the -a
flag in the second Tyk commands - this is important!):
echo "deb https://packagecloud.io/tyk/tyk-pump/ubuntu/ bionic main" | sudo tee /etc/apt/sources.list.d/tyk_tyk-pump.list
echo "deb-src https://packagecloud.io/tyk/tyk-pump/ubuntu/ bionic main" | sudo tee -a /etc/apt/sources.list.d/tyk_tyk-pump.list
sudo apt-get update
Note
bionic
is the code name for Ubuntu 18.04. Please substitute it with your particular ubuntu release, e.g. focal
.
What you’ve done here is:
- Added the Tyk Pump repository
- Updated our package list
Step 2: Install the Tyk Pump
You’re now ready to install the Tyk Pump. To install it, run:
sudo apt-get install -y tyk-pump
What you’ve done here is instructed apt-get
to install Tyk Pump without prompting. Wait for the downloads to complete.
When Tyk Pump has finished installing, it will have installed some init
scripts, but it will not be running yet. The next step will be to setup each application using three very simple commands.
Verify the origin key (optional)
Debian packages are signed with the repository keys. These keys are verified at the time of fetching the package and is taken care of by the apt
infrastructure. These keys are controlled by PackageCloud, our repository provider. For an additional guarantee, it is possible to verify that the package was indeed created by Tyk by verifying the origin
certificate that is attached to the package.
First, you have to fetch Tyk’s signing key and import it.
wget https://keyserver.tyk.io/tyk.io.deb.signing.key
gpg --import tyk.io.deb.signing.key
Then, you have to either,
- sign the key with your ultimately trusted key
- trust this key ultimately
The downloaded package will be available in /var/cache/apt/archives
. Assuming you found the file tyk-gateway-2.9.3_amd64.deb
there, you can verify the origin signature.
gpg --verify d.deb
gpg: Signature made Wed 04 Mar 2020 03:05:00 IST
gpg: using RSA key F3781522A858A2C43D3BC997CA041CD1466FA2F8
gpg: Good signature from "Team Tyk (package signing) <[email protected]>" [ultimate]
Step 3: Configure Tyk Pump
If you don’t complete this step, you won’t see any analytics in your Dashboard, so to enable the analytics service, we need to ensure Tyk Pump is running and configured properly.
Option 1: Configure Tyk Pump for MongoDB
Note
You need to replace <hostname>
for --redishost=<hostname>
, and <IP Address>
for --mongo=mongodb://<IP Address>/
with your own values to run this script.
sudo /opt/tyk-pump/install/setup.sh --redishost=<hostname> --redisport=6379 --mongo=mongodb://<IP Address>/tyk_analytics
Option 2: Configure Tyk Pump for SQL
Note
You need to replace <hostname>
for --redishost=<hostname>
, and <Postgres Host Name>
,<Port>
, <User>
, <Password>
, <DB>
for --postgres="host=<Postgres Host Name> port=<Port> user=<User> password=<Password> dbname=<DB>"
with your own values to run this script.
sudo /opt/tyk-pump/install/setup.sh --redishost=<hostname> --redisport=6379 --postgres="host=<Postgres Host Name> port=<Port> user=<User> password=<Password> dbname=<DB>"
Step 4: Start Tyk Pump
sudo service tyk-pump start
sudo service tyk-pump enable
You can verify if Tyk Pump is running and working by tailing the log file:
sudo tail -f /var/log/upstart/tyk-pump.log
Using Ansible
Install Tyk Pump Through Ansible
Getting Started
- clone the tyk-ansible repositry
$ git clone https://github.com/TykTechnologies/tyk-ansible
cd
into the directory
$ cd tyk-ansible
- Run initialisation script to initialise environment
$ sh scripts/init.sh
-
Modify
hosts.yml
file to update ssh variables to your server(s). You can learn more about the hosts file here -
Run ansible-playbook to install
tyk-pump
$ ansible-playbook playbook.yaml -t tyk-pump
Supported Distributions
Distribution | Version | Supported |
---|---|---|
Debian | 10 | ✅ |
Debian | 9 | ✅ |
Ubuntu | 21 | ✅ |
Ubuntu | 20 | ✅ |
Ubuntu | 18 | ✅ |
Ubuntu | 16 | ✅ |
Install Gateway
Using Shell
Tyk has it’s own APT repositories hosted by the kind folks at packagecloud.io, which makes it easy, safe and secure to install a trusted distribution of the Tyk Gateway stack.
This tutorial has been tested on Ubuntu 16.04 & 18.04 with few if any modifications.
Please note however, that should you wish to write your own plugins in Python, we currently have a Python version dependency of 3.4. Python-3.4 ships with Ubuntu 14.04, however you may need to explicitly install it on newer Ubuntu Operating System releases.
Prerequisites
- Ensure port
8080
is available. This is used in this guide for Gateway traffic (API traffic to be proxied). - You have MongoDB and Redis installed.
- You have installed firstly the Tyk Dashboard, then the Tyk Pump.
Step 1: Set up our APT Repositories
First, add our GPG key which signs our binaries:
curl -L https://packagecloud.io/tyk/tyk-gateway/gpgkey | sudo apt-key add -
Run update:
sudo apt-get update
Since our repositories are installed via HTTPS, you will need to make sure APT supports this:
sudo apt-get install -y apt-transport-https
Create a file /etc/apt/sources.list.d/tyk_tyk-gateway.list
with the following contents:
deb https://packagecloud.io/tyk/tyk-gateway/ubuntu/ bionic main
deb-src https://packagecloud.io/tyk/tyk-gateway/ubuntu/ bionic main
Note
bionic
is the code name for Ubuntu 18.04. Please substitute it with your particular ubuntu release, e.g. focal
.
Now you can refresh the list of packages with:
sudo apt-get update
What we’ve done here is:
- Added the Tyk Gateway repository
- Updated our package list
Step 2: Install the Tyk Gateway
We’re now ready to install the Tyk Gateway. To install it, run:
sudo apt-get install -y tyk-gateway
What we’ve done here is instructed apt-get to install the Tyk Gateway without prompting, wait for the downloads to complete.
When Tyk has finished installing, it will have installed some init scripts, but will not be running yet. The next step will be to set up the Gateway - thankfully this can be done with three very simple commands, however it does depend on whether you are configuring Tyk Gateway for use with the Dashboard or without (the Community Edition).
Verify the origin key (optional)
Debian packages are signed with the repository keys. These keys are verified at the time of fetching the package and is taken care of by the apt
infrastructure. These keys are controlled by PackageCloud, our repository provider. For an additional guarantee, it is possible to verify that the package was indeed created by Tyk by verifying the origin
certificate that is attached to the package.
First, you have to fetch Tyk’s signing key and import it.
wget https://keyserver.tyk.io/tyk.io.deb.signing.key
gpg --import tyk.io.deb.signing.key
Then, you have to either,
- sign the key with your ultimately trusted key
- trust this key ultimately
The downloaded package will be available in /var/cache/apt/archives
. Assuming you found the file tyk-gateway-2.9.4_amd64.deb
there, you can verify the origin signature.
gpg --verify d.deb
gpg: Signature made Wed 04 Mar 2020 03:05:00 IST
gpg: using RSA key F3781522A858A2C43D3BC997CA041CD1466FA2F8
gpg: Good signature from "Team Tyk (package signing) <[email protected]>" [ultimate]
Configure Tyk Gateway with Dashboard
Prerequisites
This configuration assumes that you have already installed the Tyk Dashboard, and have decided on the domain names for your Dashboard and your Portal. They must be different. For testing purposes, it is easiest to add hosts entries to your (and your servers) /etc/hosts
file.
Set up Tyk
You can set up the core settings for Tyk Gateway with a single setup script, however for more involved deployments, you will want to provide your own configuration file.
Note
You need to replace <hostname>
for --redishost=<hostname>
with your own value to run this script.
sudo /opt/tyk-gateway/install/setup.sh --dashboard=1 --listenport=8080 --redishost=<hostname> --redisport=6379
What we’ve done here is told the setup script that:
--dashboard=1
: We want to use the Dashboard, since Tyk Gateway gets all it’s API Definitions from the Dashboard service, as of v2.3 Tyk will auto-detect the location of the dashboard, we only need to specify that we should use this mode.--listenport=8080
: Tyk should listen on port 8080 for API traffic.--redishost=<hostname>
: Use Redis on your hostname.--redisport=6379
: Use the default Redis port.
Starting Tyk
The Tyk Gateway can be started now that it is configured. Use this command to start the Tyk Gateway:
sudo service tyk-gateway start
sudo service tyk-gateway enable
Pro Tip: Domains with Tyk Gateway
Tyk Gateway has full domain support built-in, you can:
- Set Tyk to listen only on a specific domain for all API traffic.
- Set an API to listen on a specific domain (e.g. api1.com, api2.com).
- Split APIs over a domain using a path (e.g. api.com/api1, api.com/api2, moreapis.com/api1, moreapis.com/api2 etc).
- If you have set a hostname for the Gateway, then all non-domain-bound APIs will be on this hostname + the
listen_path
.
Using Ansible
Getting Started
- clone the tyk-ansible repositry
$ git clone https://github.com/TykTechnologies/tyk-ansible
cd
into the directory
$ cd tyk-ansible
- Run initialisation script to initialise environment
$ sh scripts/init.sh
-
Modify
hosts.yml
file to update ssh variables to your server(s). You can learn more about the hosts file here -
Run ansible-playbook to install
tyk-gateway
$ ansible-playbook playbook.yaml -t `tyk-gateway-pro` or `tyk-gateway-hybrid`
Supported Distributions
Distribution | Version | Supported |
---|---|---|
Debian | 10 | ✅ |
Debian | 9 | ✅ |
Ubuntu | 21 | ✅ |
Ubuntu | 20 | ✅ |
Ubuntu | 18 | ✅ |
Ubuntu | 16 | ✅ |
Variables
vars/tyk.yaml
Variable | Default | Comments |
---|---|---|
secrets.APISecret | 352d20ee67be67f6340b4c0605b044b7 |
API secret |
secrets.AdminSecret | 12345 |
Admin secret |
gateway.service.host | Gateway server host if different than the hosts url | |
gateway.service.port | 8080 |
Gateway server listening port |
gateway.service.proto | http |
Gateway server protocol |
gateway.service.tls | false |
Set to true to enable SSL connections |
gateway.sharding.enabled | false |
Set to true to enable filtering (sharding) of APIs |
gateway.sharding.tags | The tags to use when filtering (sharding) Tyk Gateway nodes. Tags are processed as OR operations. If you include a non-filter tag (e.g. an identifier such as node-id-1 , this will become available to your Dashboard analytics) |
|
gateway.rpc.connString | Use this setting to add the URL for your MDCB or load balancer host | |
gateway.rpc.useSSL | true |
Set this option to true to use an SSL RPC connection |
gateway.rpc.sslInsecureSkipVerify | true |
Set this option to true to allow the certificate validation (certificate chain and hostname) to be skipped. This can be useful if you use a self-signed certificate |
gateway.rpc.rpcKey | Your organization ID to connect to the MDCB installation | |
gateway.rpc.apiKey | This the API key of a user used to authenticate and authorize the Gateway’s access through MDCB. The user should be a standard Dashboard user with minimal privileges so as to reduce any risk if the user is compromised. The suggested security settings are read for Real-time notifications and the remaining options set to deny | |
gateway.rpc.groupId | This is the zone that this instance inhabits, e.g. the cluster/data-center the Gateway lives in. The group ID must be the same across all the Gateways of a data-center/cluster which are also sharing the same Redis instance. This ID should also be unique per cluster (otherwise another Gateway cluster can pick up your keyspace events and your cluster will get zero updates). |
Explore Demos and Proof of Concepts
Kubernetes Demo
The tyk-k8s-demo repository allows you to start up an entire Tyk Stack
with all its dependencies as well as other tools that can integrate with Tyk.
The repository will spin up everything in Kubernetes using helm
and bash magic
to get you started.
Purpose Minimize the amount of effort needed to start up the Tyk infrastructure and show examples of how Tyk can be set up in k8s using different deployment architectures as well as different integrations.
Prerequisites
Required Packages
You will need the following tools to be able to run this project.
- Kubectl - CLI tool for controlling Kubernetes clusters
- Helm - Helps manage Kubernetes applications through Helm charts
- jq - CLI for working with JSON output and manipulating it
- git - CLI used to obtain the project from GitHub
- Terraform (only when using
--cloud
flag)
Tested on Linux/Unix based systems on AMD64 and ARM architectures
License Requirements
-
Tyk OSS: No license required as it is open-source.
-
Licensed Products: Sign up here using the button below, and choose “Get in touch” to receive a guided evaluation of the Tyk Dashboard and your temporary license.
Get started
How to use the license key
Once you obtained the license key, create a .env
file using the example provided and update it with your licenses as follows:
git clone https://github.com/TykTechnologies/tyk-k8s-demo.git
cd tyk-k8s-demo
cp .env.example .env
Depending on the deployments you would like to install set values of the LICENSE
, MDCB_LICENSE
, and PORTAL_LICENSE
inside the .env
file.
Minikube
If you are deploying this demo on Minikube, you will need to enable the ingress addon. You can do so by running the following commands:
minikube start
minikube addons enable ingress
Quick Start
./up.sh --deployments portal,operator-httpbin tyk-stack
This quick start command will start up the entire Tyk stack along with the Tyk Enterprise Portal, Tyk Operator, and httpbin CRD example.
Possible deployments
tyk-stack
: A comprehensive Tyk Self Managed setup for a single regiontyk-cp
: Tyk control plane in a multi-region Tyk deploymenttyk-dp
: Data plane of hybrid gateways that connect to either Tyk Cloud or a Tyk Control Plane, facilitating scalable deploymentstyk-gateway
: Open Source Software (OSS) version of Tyk, self-managed and suitable for single-region deployments
Dependencies Options
Redis Options
redis
: Bitnami Redis deploymentredis-cluster
: Bitnami Redis Cluster deploymentredis-sentinel
: Bitnami Redis Sentinel deployment
Storage Options
mongo
: Bitnami Mongo database deployment as a Tyk backendpostgres
: Bitnami Postgres database deployment as a Tyk backend
Supplementary Deployments Please see this page for Tyk deployments compatibility charts.
- cert-manager: deploys cert-manager.
- datadog: deploys Datadog agent and starts up Tyk Pump to push analytics data from the Tyk platform to Datadog. It will also create a Datadog dashboard for you to view the analytics.
- elasticsearch: deploys
Elasticsearch and starts up Tyk pump to push analytics data from the Tyk platform to Elasticsearch.
- elasticsearch-kibana: deploys the Elasticsearch deployment as well as a Kibana deployment and creates a Kibana dashboard for you to view the analytics.
- Jaeger: deploys the Jaeger operator, a Jaeger instance, and the OpenTelemetry collector and configures the Tyk deployment to send telemetry data to Jaeger through the OpenTelemetry collector.
- k6: deploys a Grafana K6 Operator.
- k6-slo-traffic: deploys a k6 CRD to generate a load of traffic to seed analytics data.
- keycloak: deploys the Keycloak Operator and a Keycloak instance.
- keycloak-dcr: starts up a Keycloak Dynamic Client Registration example.
- keycloak-jwt: starts up a Keycloak JWT Authentication example with Tyk.
- keycloak-sso: starts up a Keycloak SSO example with the Tyk Dashboard.
- newrelic: deploys New Relic and starts up a Tyk Pump to push analytics data from the Tyk platform to New Relic.
- opa: enables Open Policy Agent to allow for Dashboard APIs governance.
- opensearch: deploys OpenSearch and starts up Tyk Pump to push analytics data from the Tyk platform to OpenSearch.
- operator: deploys the Tyk Operator and its dependency cert-manager.
- operator-federation: starts up Federation v1 API examples using the tyk-operator.
- operator-graphql: starts up GraphQL API examples using the tyk-operator.
- operator-httpbin: starts up an API examples using the tyk-operator.
- operator-jwt-hmac: starts up API examples using the tyk-operator to demonstrate JWT HMAC auth.
- operator-udg: starts up Universal Data Graph API examples using the tyk-operator.
- portal: deploys the Tyk Enterprise Developer Portal as well as its dependency PostgreSQL.
- prometheus: deploys Prometheus and starts up Tyk Pump to push analytics data from the Tyk platform to Prometheus.
- prometheus-grafana: deploys the Prometheus deployment as well as a Grafana deployment and creates a Grafana dashboard for you to view the analytics.
- vault: deploys Vault Operator and a Vault instance.
If you are running a POC and would like an example of how to integrate a specific tool, you are welcome to submit a feature request
Example
./up.sh \
--storage postgres \
--deployments prometheus-grafana,k6-slo-traffic \
tyk-stack
The deployment process takes approximately 10 minutes, as the installation is sequential and some dependencies take time to initialize. Once the installation is complete, the script will output a list of all the services that were started, along with instructions on how to access them. Afterward, the k6 job will begin running in the background, generating traffic for 15 minutes. To monitor live traffic, you can use the credentials provided by the script to access Grafana or the Tyk Dashboard
Bash Script Usage
Start Tyk deployment
Create and start up the deployments
Usage:
./up.sh [flags] [command]
Available Commands:
tyk-stack
tyk-cp
tyk-dp
tyk-gateway
Flags:
-v, --verbose bool set log level to debug
--dry-run bool set the execution mode to dry run. This will dump the kubectl and helm commands rather than execute them
-n, --namespace string namespace the tyk stack will be installed in, defaults to 'tyk'
-f, --flavor enum k8s environment flavor. This option can be set 'openshift' and defaults to 'vanilla'
-e, --expose enum set this option to 'port-forward' to expose the services as port-forwards or to 'load-balancer' to expose the services as load balancers or 'ingress' which exposes services as a k8s ingress object
-r, --redis enum the redis mode that tyk stack will use. This option can be set 'redis', 'redis-sentinel' and defaults to 'redis-cluster'
-s, --storage enum database the tyk stack will use. This option can be set 'mongo' (amd only) and defaults to 'postgres'
-d, --deployments string comma separated list of deployments to launch
-c, --cloud enum stand up k8s infrastructure in 'aws', 'gcp' or 'azure'. This will require Terraform and the CLIs associate with the cloud of choice
-l, --ssl bool enable ssl on deployments
Stop Tyk deployment
Shutdown deployment
Usage:
./down.sh [flags]
Flags:
-v, --verbose bool set log level to debug
-n, --namespace string namespace the tyk stack will be installed in, defaults to 'tyk'
-p, --ports bool disconnect port connections only
-c, --cloud enum tear down k8s cluster stood up
Clusters
You can get the repository to create demo clusters for you on AWS, GCP, or Azure. That can be set using the --cloud
flag
and requires the respective cloud CLI to be installed and authorized on your system. You will also need to specify the
CLUSTER_LOCATION
, CLUSTER_MACHINE_TYPE
, CLUSTER_NODE_COUNT
, and GCP_PROJECT
(for GCP only) parameters in the .env file.
You can find examples of .env files here:
For more information about cloud CLIs:
- AWS:
- GCP:
- gcloud
GOOGLE_APPLICATION_CREDENTIALS
environment variable per documentation from Google
- Azure:
Customization
This repository can also act as a guide to help you get set up with Tyk. If you just want to know how to set up a specific
tool with Tyk, you can run the repository with the --dry-run
and --verbose
flags. This will output all the commands that
the repository will run to stand up any installation. This can help debug as well as figure out what
configuration options are required to set these tools up.
Furthermore, you can also add any Tyk environment variables to your .env
file and those variables will be mapped to
their respective Tyk deployments.
Example:
...
TYK_MDCB_SYNCWORKER_ENABLED=true
TYK_MDCB_SYNCWORKER_HASHKEYS=true
TYK_GW_SLAVEOPTIONS_SYNCHRONISERENABLED=true
Variables
The script has defaults for minimal settings in this env file,
and it will give errors if something is missing.
You can also add or change any Tyk environment variables in the .env
file,
and they will be mapped to the respective extraEnvs
section in the helm charts.
Variable | Default | Comments |
---|---|---|
DASHBOARD_VERSION | v5.5 |
Dashboard version |
GATEWAY_VERSION | v5.5 |
Gateway version |
MDCB_VERSION | v2.7 |
MDCB version |
PUMP_VERSION | v1.11 |
Pump version |
PORTAL_VERSION | v1.10 |
Portal version |
TYK_HELM_CHART_PATH | tyk-helm |
Path to charts, can be a local directory or a helm repo |
TYK_USERNAME | [email protected] |
Default password for all the services deployed |
TYK_PASSWORD | topsecretpassword |
Default password for all the services deployed |
LICENSE | Dashboard license | |
MDCB_LICENSE | MDCB license | |
PORTAL_LICENSE | Portal license | |
TYK_WORKER_CONNECTIONSTRING | MDCB URL for worker connection | |
TYK_WORKER_ORGID | Org ID of dashboard user | |
TYK_WORKER_AUTHTOKEN | Auth token of dashboard user | |
TYK_WORKER_USESSL | true |
Set to true when the MDCB is serving on a TLS connection |
TYK_WORKER_SHARDING_ENABLED | false |
Set to true to enable API Sharding |
TYK_WORKER_SHARDING_TAGS | API Gateway segmentation tags | |
TYK_WORKER_GW_PORT | 8081 |
Set the gateway service port to use |
TYK_WORKER_OPERATOR_CONNECTIONSTRING | Set the dashboard URL for the operator to be able to manage APIs and Policies | |
DATADOG_APIKEY | Datadog API key | |
DATADOG_APPKEY | Datadog Application key. This is used to create a dashboard and create a pipeline for the Tyk logs | |
DATADOG_SITE | datadoghq.com |
Datadog site. Change to datadoghq.eu if using the European site |
GCP_PROJECT | The GCP project for terraform authentication on GCP | |
CLUSTER_LOCATION | Cluster location that will be created on AKS, EKS, or GKE | |
CLUSTER_MACHINE_TYPE | Machine type for the cluster that will be created on AKS, EKS, or GKE | |
CLUSTER_NODE_COUNT | Number of nodes for the cluster that will be created on AKS, EKS, or GKE | |
INGRESS_CLASSNAME | nginx |
The ingress classname to be used to associate the k8s ingress objects with the ingress controller/load balancer |
Docker Demo
Purpose
With tyk-demo repository, using docker-compose, you can set up quickly a complete Tyk stack, including dependencies and integrations.
Minimize the amount of effort needed to start up the Tyk infrastructure and show end-to-end complete examples of how to set up various capabilities in Tyk as well as different integrations.
Key Features
- Full Tyk stack deployment
- Pre-configured demo APIs
- Analytics and monitoring tools
- Integration with common third-party services
Watch the video What Is Tyk Demo for an overview and learn about the key features from our experts -
Prerequisites
-
Docker compose Make sure you have docker compose and that docker is running on your machine.
-
License key This Demo deploys and runs the full Tyk platform which is a licensed product. Please sign up using the button below, to obtain a license key. In the link, choose “Get in touch” to get a guided evaluation of the Tyk Dashboard and receive your temporary license.
Quick Start
The following steps will enable you to quickly get started:
- Clone the repository:
git clone https://github.com/TykTechnologies/tyk-demo.git
- Navigate to the directory:
cd tyk-demo
- Add license key to .env file:
DASHBOARD_LICENCE=<your license key>
- Run the setup script:
./up.sh
- Access Tyk Dashboard: http://localhost:3000
To complete the instruction above we have a tutorial video of tyk demo that covers:
- Downloading and starting tyk-demo
- Setting up your license
- Logging in to Tyk Dashboard
Docker Compose Setup
Who is this page for?
This is the guide we recommend for a easy quick start. The instructions are the ones shared with you when you register to a free trial.
You can also use this guide for your PoC since it spins up a full Tyk Self Managed stack for you using our project Docker Pro Demo, however, if you are interested in learning Tyk, there’s an option for Tyk Demo which is a project that spins up full Tyk stack that includes a prepopulate API definitions of all kinds, with various middleware options and can also spin up supporting tools such as Prometheus, Keycloak (IDP) etc.
What’s included?
The Tyk Pro Docker Demo is our Self-Managed solution, which includes our Gateway, Dashboard, and analytics processing pipeline. This demo will run Tyk Self-Managed on your machine, which contains 5 containers: Tyk Gateway, Tyk Dashboard, Tyk Pump, Redis and MongoDB. This demo is great for proof of concept and demo purposes, but if you want to test performance, you will need to move each component to a separate machine.
Warning
This demo is NOT intended for production use or performance testing, since it uses docker compose and the configuration files are not specifically tuned for performance testing or high loads. Please visit the Planning for Production page to learn how to configure settings for optimal performance.
Note
The Tyk Pro Docker demo does not provide access to the Developer Portal.
Prerequisites
- Our Tyk Pro Docker demo on GitHub
- A Tyk Pro trial license
Steps for Installation
- Clone the GitHub repo
Clone the Docker demo repo from GitHub to a location on your machine.
- Edit your hosts file
You need to add the following to your hosts file:
127.0.0.1 www.tyk-portal-test.com
127.0.0.1 www.tyk-test.com
- Add your developer license
From your installation folder:
Create an .env
file - cp .env.example .env.
Then add your license string to TYK_DB_LICENSEKEY
.
- Initialise the Docker containers
With MongoDB
Run the following command from your installation folder:
docker-compose up
With PostgreSQL
Run the following command from your installation folder:
docker-compose -f ./docker-compose.yml -f ./docker-compose.postgres.yml up
This will will download and setup the five Docker containers. This may take some time and will run in non-daemonised mode so you can see all the output.
- Bootstrap the Tyk installation
Go to http://localhost:3000 in your browser. You will be presented with the Bootstrap UI to create your first organization and admin user.
- Create your organization and default user
You need to enter the following:
- Your Organization Name
- Your Organization Slug
- Your User Email Address
- Your User First and Last Name
- A Password for your User
- Re-enter your user Password
Note
For a password, we recommend a combination of alphanumeric characters, with both upper and lower case letters.
Click Bootstrap to save the details.
- log in to the Tyk Dashboard
You can now log in to the Tyk Dashboard from 127.0.0.1:3000
, using the username and password created in the Dashboard
Setup screen.
Removing the demo installation
To delete all containers as well as remove all volumes from your host:
With MongoDB
docker-compose down -v
With PostgreSQL:
docker-compose -f ./docker-compose.yml -f ./docker-compose.postgres.yml down -v
Using Windows
Tyk Pro on Windows using Docker Desktop
The Tyk Pro Docker demo is our full On-Premises Pro solution, which includes our Gateway, Dashboard, and analytics processing pipeline. This demo will run Tyk Self-Managed Pro on your machine, which contains 5 containers: Tyk Gateway, Tyk Dashboard, Tyk Pump, Redis and MongoDB. This demo is great for proof of concept and demo purposes, but if you want to test performance, you will need to move each component to a separate machine.
Warning
This demo is NOT designed for production use or performance testing.
Note
You use this at your own risk. Tyk is not supported on the Windows platform. However you can test it as a proof of concept using our Pro Demo Docker installation.
Prerequisites
- MS Windows 10 Pro
- Docker Desktop for Windows running with a signed in Docker ID
- Git for Windows
- PowerShell running as administrator
- Postman for Windows
- Our Pro Demo Docker GitHub repo
- A free Tyk Self-Managed Developer license
Step 1 - Clone the Repo
Clone the repo above to a location on your machine.
Step 2 - Edit your hosts file
You need to add the following to your Windows hosts file:
127.0.0.1 www.tyk-portal-test.com
127.0.0.1 www.tyk-test.com
Step 3 - Add your Developer License
You should have received your free developer license via email. Copy the license key in the following location from your \confs\tyk_analytics.conf
file:
{
...
"license_key": "<LICENSE-KEY>"
...
}
Step 4 - Run the Docker Compose File
From PowerShell, run the following command from your installation folder:
docker-compose up
This will will download and setup the five Docker containers. This may take some time and will display all output.
Step 5 - Test the Tyk Dashboard URL
Go to:
127.0.0.1:3000
You should get to the Tyk Dashboard Setup screen:
Step 6 - Create your Organization and Default User
You need to enter the following:
- Your Organization Name
- Your Organization Slug
- Your User Email Address
- Your User First and Last Name
- A Password for your User
- Re-enter your user Password
Note
For a password, we recommend a combination of alphanumeric characters, with both upper and lower case letters.
Click Bootstrap to save the details.
You can now log in to the Tyk Dashboard from 127.0.0.1:3000
, using the username and password created in the Dashboard Setup screen.
Step 7 - Set up a Portal Catalog
This creates a portal catalog for your developer portal. For the Authorization
Header, the Value you need to enter is the access_key
value from the create user request. In the body add the org_id
value created in Step One.
- Request: POST
- URL:
127.0.0.1:3000/api/portal/catalogue
- Header: Key
Authorzation
ValueSECRET_VALUE
- Body (raw set to application/json):
Sample Request
{ "org_id": "5d07b4b0661ea80001b3d40d" }
Sample Response
{
"Status": "OK",
"Message": "5d07b4b0661ea80001b3d40d",
"Meta": null
}
Step 8 - Create your default Portal Pages
This creates the default home page for your developer portal. For the Authorization
Header, the Value you need to enter is the access_key
value from the create user request.
- Request: POST
- URL:
127.0.0.1:3000/api/portal/catalogue
- Header: Key
Authorzation
ValueSECRET_VALUE
- Body (raw set to application/json):
Sample Request
{
"fields": {
"JumboCTALink": "#cta",
"JumboCTALinkTitle": "Your awesome APIs, hosted with Tyk!",
"JumboCTATitle": "Tyk Developer Portal",
"PanelOneContent": "Panel 1 content.",
"PanelOneLink": "#panel1",
"PanelOneLinkTitle": "Panel 1 Button",
"PanelOneTitle": "Panel 1 Title",
"PanelThereeContent": "",
"PanelThreeContent": "Panel 3 content.",
"PanelThreeLink": "#panel3",
"PanelThreeLinkTitle": "Panel 3 Button",
"PanelThreeTitle": "Panel 3 Title",
"PanelTwoContent": "Panel 2 content.",
"PanelTwoLink": "#panel2",
"PanelTwoLinkTitle": "Panel 2 Button",
"PanelTwoTitle": "Panel 2 Title",
"SubHeading": "Sub Header"
},
"is_homepage": true,
"slug": "home",
"template_name": "",
"title": "Tyk Developer Portal"
}
Sample Response
{
"Status": "OK",
"Message": "5d07b4b0661ea80001b3d40d",
"Meta": null
}
Step 9 - Setup the Portal URL
This creates the developer portal URL. For the Authorization
Header, the Value you need to enter is the secret
value from your /confs/tyk_analytics.conf
.
- Request: POST
- URL:
127.0.0.1:3000/api/portal/configuration
- Header: Key
Authorzation
ValueSECRET_VALUE
- Body (raw set to application/json):
Sample Request
{SECRET_VALUE}
Sample Response
{
"Status": "OK",
"Message": "5d07b4b0661ea80001b3d40d",
"Meta": null
}
Tyk Pro on Windows using WSL
The Tyk Pro Docker demo is our full Self-Managed solution, which includes our Gateway, Dashboard, and analytics processing pipeline. This demo will run Tyk Self-Managed on your machine, which contains 5 containers: Tyk Gateway, Tyk Dashboard, Tyk Pump, Redis and MongoDB. This demo is great for proof of concept and demo purposes, but if you want to test performance, you will need to move each component to a separate machine.
Warning
This demo is NOT designed for production use or performance testing.
Note
You use this at your own risk. Tyk is not supported on the Windows platform. However you can test it as a proof of concept using our Pro Demo Docker installation.
Prerequisites
- MS Windows 10 Pro with Windows Linux Subsystem enabled
- Docker Desktop for Windows running with a signed in Docker ID
- Git for Windows
- PowerShell running as administrator
- Postman for Windows
- Our Pro Demo Docker GitHub repo
- A free Tyk Self-Managed Developer license
- Optional: Ubuntu on Windows
Step 1 - Clone the Repo
Clone the repo above to a location on your machine.
Step 2 - Edit your hosts file
You need to add the following to your Windows hosts file:
127.0.0.1 www.tyk-portal-test.com
127.0.0.1 www.tyk-test.com
Step 3 - Configure file permissions In order to mount the files, you need to allow Docker engine has access to your Drive. You can do that by going to the Docker settings, Shared Drives view, and manage the access. If after all you will get issue regarding path permissions, you will need to create a separate user specifically for the docker according to this instructions https://github.com/docker/for-win/issues/3385#issuecomment-571267988
Step 4 - Add your Developer License
You should have received your free developer license via email. Copy the license key in the following location from your \confs\tyk_analytics.conf
file:
"license_key": ""
Step 5 - Run the Docker Compose File
From PowerShell, run the following command from your installation folder:
docker-compose up
This will will download and setup the five Docker containers. This may take some time and will display all output.
NOTE
If you are getting issues related to errors when mounting files, you may need to modify
docker-compose.yml
file, and change configs paths from related to absolute, and from linux format to windows format, like this:
volumes:
- C:\Tyk\confs\tyk_analytics.conf:/opt/tyk-dashboard/tyk_analytics.conf
Step 6 - Got to the Dashboard URL
Go to:
127.0.0.1:3000
You should get to the Tyk Dashboard Setup screen:
Step 7 - Create your Organization and Default User
You need to enter the following:
- Your Organization Name
- Your Organization Slug
- Your User Email Address
- Your User First and Last Name
- A Password for your User
- Re-enter your user Password
Note
For a password, we recommend a combination of alphanumeric characters, with both upper and lower case letters.
Click Bootstrap to save the details.
You can now log in to the Tyk Dashboard from 127.0.0.1:3000
, using the username and password created in the Dashboard Setup screen.
Configure your Developer Portal
To set up your Developer Portal follow our Self-Managed tutorial on publishing an API to the Portal Catalog.
Planning for Production
So you want to deploy Tyk to production?
There’s a few things worth noting that can ensure high performance of your Tyk Gateway nodes. Here are some of the basic things we do for load testing to make sure machines don’t run out of resources.
Load Testing Best Practices
Performance Expectations
Our performance testing plan focused on replicating the setup of our customers, and tried not to optimize for “benchmarks”: so no supercomputers and no sub-millisecond inner DC latency. Instead, we tested on a super-low performance 2 CPU Linode machine, with 50ms latency between Tyk and upstream. For testing, we used Tyk Gateway in Multi-Cloud mode, with default config. Test runner was using [Locust][2] framework and [Boomer][3] for load generation.
With the optimizations outlined below, and using our distributed rate limiter, Tyk can easily handle ~3,000 requests per second with analytics, key authentication, and quota checks enabled.
In the test below, Tyk v2.7 evaluates each request through its access control list, rate limiter, quota evaluator, and analytics recorder across a single test token and still retains a latency firmly under 70 milliseconds:
Performance changes based on use case
A popular use case for Tyk that we’ve seen crop up is as an interstitial API Gateway for microservices that are making service-to-service calls. Now, with these APIs, rate limiting and quotas are not usually needed: only authentication and analytics. If we run the same tests again with rate limits disabled, and quotas disabled, then we see a different performance graph:
Here we have pushed the test to 3,000 requests per second, and we can see that Tyk copes just fine. With only a few spikes past the 100ms line, we can clearly see solid performance right up to 3,000 requests per second with acceptable latency.
Vanilla Tyk
If you were to just test Tyk as a pass-through auth proxy, we can see that 4k RPS (requests per second) is easily handled:
This configuration has analytics recording disabled, but we are still authenticating the inbound request. As you can see, we easily handle the 4k RPS mark and we can go further with more optimization.
Change all the shared secrets
Ensure that these are changed before deploying to production. The main secrets to consider are:
tyk.conf
:
secret
node_secret
tyk_analytics.conf
:
admin_secret
shared_node_secret
typ_api_config.secret
GW secret
and DB tyk_api_config.secret
must match
GW node_secret
and DB shared_node_secret
must match
Use the public/private key message security!
Tyk makes use of public-key message verification for messages that are sent from the Dashboard to the Gateways, these messages can include:
- Zeroconfig Dashboard auto-discovery details
- Cluster reload messages
- Cluster configuration getters/setters for individual Gateways in a cluster
These keys are also used for plugin security, so it is important to use them if you are deploying code to your Gateway. The public key that ships with your Gateways is used to verify the manifest and files that come with any plugin bundle that gets downloaded by the bundle downloader.
Change your Control Port
To secure your Tyk installation, you can configure the following settings in your tyk.conf:
control_api_hostname
- Set the hostname to which you want to bind the REST API.
control_api_port
- This allows you to run the Gateway Control API on a separate port, and protect it behind a firewall if needed.
If you change these values, you need to update the equivalent fields in the dashboard conf file tyk_analytics.conf
: tyk_api_config.Host
and tyk_api_config.Port
Connecting multiple gateways to a single dashboard
Please note that, for a Self-Managed installation, the number of gateway nodes you may register with your dashboard concurrently will be subject to the terms of your license.
Each gateway node must be configured in the same way, with the exception being if you want to shard your gateways. Each gateway node in the cluster will need connectivity to the same Redis server & persistent database.
Other Dashboard Security Considerations
In addition to changing the default secrets (see Change all the shared secrets) if you change the Control API port (see Change your Control Port), you also need to change the connection string settings in your tyk_analytics.conf
file.
Ensure you are matching only the URL paths that you want to match
We recommend that you configure Tyk Gateway to use exact URL path matching and to enforce strict route matching to avoid accidentally invoking your unsecured /health
endpoint when a request is made to /customer/{customer_id}/account/health
…
Unless you want to make use of Tyk’s flexible listen path and endpoint path matching modes and understand the need to configure patterns carefully, you should enable TYK_GW_HTTPSERVEROPTIONS_ENABLESTRICTROUTES
, TYK_GW_HTTPSERVEROPTIONS_ENABLEPATHPREFIXMATCHING
and TYK_GW_HTTPSERVEROPTIONS_ENABLEPATHSUFFIXMATCHING
.
Health checks are expensive
To keep real-time health-check data and make it available to the Health-check API, Tyk needs to record information for every request, in a rolling window - this is an expensive operation and can limit throughput - you have two options: switch it off, or get a box with more cores.
Selecting the appropriate log level
Tyk provides multiple log levels: error, warn, info, debug. Setting higher log levels consumes more computing resources and would have an impact on the Tyk component. Tyk installations default to log level info unless modified by config files or environment variables.
It is recommended to set to debug only for the duration of troubleshooting as it adds heavier resource overheads. In high performance use cases for Tyk Gateway, consider setting a log level lower than info to improve overall throughput.
Use the optimization settings
The below settings will ensure connections are effectively re-used, removes a transaction from the middleware run that enforces org-level rules, enables the new rate limiter (by disabling sentinel rate limiter) and sets Tyk up to use an in-memory cache for session-state data to save a round-trip to Redis for some other transactions.
Most of the changes below should be already in your tyk.conf
by default:
"close_connections": false,
"proxy_close_connections": false,
"enforce_org_quotas": false,
"enforce_org_data_detail_logging": false,
"experimental_process_org_off_thread": true,
"enable_sentinel_rate_limiter": false,
"local_session_cache": {
"disable_cached_session_state": false
},
"max_idle_connections_per_host": 500
In Tyk v2.7 we optimized the connection pool between Tyk and your Upstream. In previous releases max_idle_connections_per_host
option, was capped at 100. From v2.7 you have been able to set it to any value.
max_idle_connections_per_host
limits the number of keep-alive connections between clients and Tyk. If you set this value too low, then Tyk will not re-use connections and you will have to open a lot of new connections to your upstream.
If you set this value too high, you may encounter issues when slow clients occupy your connection and you may reach OS limits.
You can calculate the right value using a straightforward formula:
If the latency between Tyk and your Upstream is around 50ms, then a single connection can handle 1s / 50ms = 20 requests. So if you plan to handle 2000 requests per second using Tyk, the size of your connection pool should be at least 2000 / 20 = 100. For example, on low-latency environments (like 5ms), a connection pool of 100 connections will be enough for 20k RPS.
Protect Redis from overgrowing
Please read carefully through this doc to make an aware decision about the expiration of your keys in Redis, after which they will be removed from Redis. If you don’t set the lifetime, a zero default means that keys will stay in Redis until you manually delete them, which is no issue if you have a process outside Tyk Gateway to handle it. If you don’t - and especially in scenarios that your flow creates many keys or access tokens for every user or even per call - your Redis can quickly get cluttered with obsolete tokens and eventually affect the performance of the Tyk Gateway.
Analytics Optimizations
If using a Redis cluster under high load it is recommended that analytics are distributed among the Redis shards. This can be configured by setting the analytics_config.enable_multiple_analytics_keys parameter to true. Furthermore, analytics can also be disabled for an API using the do_not_track configuration parameter. Alternatively, tracking for analytics can be disabled for selected endpoints using the do not track endpoint plugin.
Protobuf Serialisation
In Tyk Gateway, using protobuf serialisation, instead of msgpack can increase performance for sending and processing analytics.
Note: protobuf is not currently supported in MDCB deployment.
If using Tyk Cloud platform under high load, it is also recommended that analytics are stored within a local region. This means that a local Tyk Pump instance can send the analytics to a localised data sink, such as PostgreSQL or MongoDB (no need for the hybrid pump). This can reduce traffic costs since your analytics would not be sent across regions.
Use the right hardware
Tyk is CPU-bound: you will get exponentially better performance the more cores you throw at Tyk - it’s that simple. Tyk will automatically spread itself across all cores to handle traffic, but if expensive operations like health-checks are enabled, then those can cause keyspace contention, so again, while it helps, health-checks do throttle throughput.
Resource limits
Make sure your host operating system has resource limits set to handle an appropriate number of connections.
You can increase the maximum number of files available to the kernel by modifying /etc/sysctl.conf
.
fs.file-max=160000
Please note that a single file, with associated inode & dcache consumes approximately 1KB RAM. As such, setting fs.file-max=160000
will consume a maximum of 160MB ram.
The changes will apply after a system reboot, but if you do not wish to reboot quite yet, you can apply the change for the current session using echo 160000 > /proc/sys/fs/file-max
.
File Handles / File Descriptors
Now we need to configure the file handles available to your Tyk services.
systemd
Override your systemd
unit files for each of the Tyk services using systemctl edit {service_name}
.
- Gateway
systemctl edit tyk-gateway.service
- Dashboard
systemctl edit tyk-dashboard.service
- Pump
systemctl edit tyk-pump.service
- Multi Data-Center Bridge
systemctl edit tyk-sink.service
You may then add LimitNOFILE=80000
to the [Service]
directive as follows:
[Service]
LimitNOFILE=80000
After making these changes, you’ll need to restart your service, for example:
systemctl restart tyk-gateway.service
Docker
You may set ulimits in a container using the --ulimit
option. See Docker documentation for detail on setting <em>ulimits</em>
docker run --ulimit nofile=80000:80000 \
-it --name tyk-gateway \
tykio/tyk-gateway:latest
File modification at runtime
Understanding what files are created or modified by the Dashboard and Gateway during runtime can be important if you are running infrastructure orchestration systems such as Puppet, which may erroneously see such changes as problems which need correcting.
- Both the Gateway and Dashboard will create a default configuration file if one is not found.
- Dashboard will write the license into the configuration file if you add it via the UI.
- From Tyk v2.3 onwards it has been possible for a Dashboard to remotely change the config of a Gateway. This will cause the Gateway’s configuration file to update.
Evaluate Performance Benchmarks
An API Gateway serves as the single point of entry into your ecosystem, introducing an extra hop in the process. Because of this, performance is critical. Tyk was built with speed in mind from day one, which is why it’s written in Go, a language known for its efficiency and performance.
Resources to Explore Tyk’s Performance:
-
Tyk Performance Benchmarks
Discover how Tyk Gateway performs across:- The full Tyk feature set
- Multiple cloud environments
- CPU scalability
- Head-to-head comparisons with competitors
-
Performance Tuning Your Gateway
A step-by-step guide to fine-tuning your Gateway for maximum performance. -
Manual Performance Testing on AWS
Best practices for setting up and running manual performance tests on AWS to ensure your Gateway is optimized.
Database Management
Visit the following pages to see how to configure the Database for Production:
Please consult the data storage configuration guide for further information relating to how to configure Tyk’s data storage across different database engines.
Redis
Supported Versions
- Tyk 5.3 supports Redis 6.2.x, 7.0.x, and 7.2.x
- Tyk 5.2.x and earlier supports Redis 6.0.x and Redis 6.2.x only.
Split out Your Databases
This is a no-brainer, but keep Redis and MongoDB off the system running the Gateway, they both use lots of RAM, and with Redis and the Gateway constantly communicating you will be facing resource contention on the CPU for a marginal decrease in latency.
So in our setup, we recommend that Redis and MongoDB/PostgreSQL live on their own systems, separate from your Tyk Gateway. If you like, run them together on the same box, that’s up to you.
The network topology we like to use is:
- Two or more Tyk Gateway nodes (load balanced, each Gateway installed on separate machines).
- A separate MongoDB or PostgreSQL cluster
- A separate Redis server with fail-over or cluster
- One Tyk Dashboard node installed on a separate machine
- One Tyk Pump node installed on a separate machine that handles data transitions
If you are making use of the Tyk Caching feature, then it is possible to use a secondary Redis server or Redis cluster to store cache data. This can be very useful in high-traffic APIs where latency is at a premium.
Make sure you have enough Redis connections
Tyk makes heavy use of Redis in order to provide a fast and reliable service, in order to do so effectively, it keeps a passive connection pool ready. For high-performance setups, this pool needs to be expanded to handle more simultaneous connections, otherwise you may run out of Redis connections.
Tyk also lets you set a maximum number of open connections, so that you don’t over-commit connections to the server.
To set your maximums and minimums, edit your tyk.conf
and tyk_analytics.conf
files to include:
"storage": {
...
"optimisation_max_idle": 2000,
"optimisation_max_active": 4000,
...
},
Set the max_idle
value to something large, we usually leave it at around 2000
for HA deployments, and then set your max_active
to your upper limit (as in, how many additional connections over the idle pool should be used).
Protection of Redis data
Tyk uses Redis to store API tokens and OAuth clients, so it is advisable to not treat Redis instances as ephemeral. The exception to this is when you are using Tyk Multi Data Center Bridge, but you will still need to retain the master Redis instance.
You must ensure that Redis is persisted, or at least in a configuration where it is easy to restore or failover. So, for example, with Elasticache, making sure there are many read-replicas and regular snapshots can ensure that your data survives a failure.
Redis Encryption
Redis supports SSL/TLS encryption from version 6 as an optional feature, enhancing the security of data in transit. To configure TLS or mTLS connections between an application and Redis, consider the following settings in Tyk’s configuration files:
-
storage.use_ssl
: Set this to true to enable TLS encryption for the connection. -
storage.ssl_secure_skip_verify
: A flag that, when set to true, instructs the application not to verify the Redis server’s TLS certificate. This is not recommended for production due to the risk ofman-in-the-middle
attacks.
From Tyk 5.3, additional options are available for more granular control:
-
storage.ca_file
: Path to the Certificate Authority (CA) file for verifying the Redis server’s certificate. -
storage.cert_file
andstorage.key_file
: Paths to your application’s certificate and private key files, necessary for mTLS where both parties verify each other’s identity. -
storage.max_version
andstorage.min_version
: Define the acceptable range of TLS versions, enhancing security by restricting connections to secure TLS protocols (1.2 or 1.3).
Setting up an Insecure TLS Connection
- Enable TLS: By setting
"use_ssl": true
, you encrypt the connection. - Skip Certificate Verification: Setting
"ssl_secure_skip_verify": true
bypasses the server’s certificate verification, suitable only for non-production environments.
Setting up a Secure TLS Connection
- Ensure
use_ssl
is set totrue
. - Set
ssl_secure_skip_verify
tofalse
to enforce certificate verification against the CA specified inca_file
. - Specify the path to the CA file in
ca_file
for server certificate verification. - Adjust
min_version
andmax_version
to secure TLS versions, ideally 1.2 and 1.3.
Setting up a Mutual TLS (mTLS) Connection
- Follow the steps for a secure TLS connection.
- Provide paths for
cert_file
andkey_file
for your application’s TLS certificate and private key, enabling Redis server to verify your application’s identity.
Example Gateway Configuration
"storage": {
"type": "redis",
"host": "server1",
"port": 6379,
"use_ssl": true,
"ssl_secure_skip_verify": false,
"ca_file": "/path/to/ca.crt",
"cert_file": "/path/to/client.crt",
"key_file": "/path/to/client.key",
"max_version": "1.3",
"min_version": "1.2"
}
Capping Analytics Tyk Gateways can generate a lot of analytics data. Be sure to read about capping your Dashboard analytics
Redis Sizing Guidelines
The average single request analytics record (without detailed logging turned on) is around 1KB.
In terms of Redis, in addition to key storage itself, it should be able to hold the last 10 seconds of analytics data, preferably more, in the case of a Tyk Pump failure. So if you have 100 requests per second, you will need approximately 6MB for storing 60 seconds of data. Be aware that if detailed logging is turned on, this can grow by a magnitude of 10.
Note
MDCB and Multi-Cloud clients - the Gateways write the data to a temporary Redis list and periodically send the analytics directly to the MDCB server, which, similar to Pump, processes them for purging to MongoDB or PostgreSQL.
Redis RAM Calculator You can calculate your Redis RAM requirements by entering your known values in the middle section of the calculator settings below:
MongoDB
Supported Versions
MongoDB is our default storage option. We support the following versions:
- MongoDB 5.0.x, 6.0.x, 7.0.x (with
mongo-go
driver).
Note: mongo-go
driver has been available since Tyk 5.0.2 and is the default from Tyk 5.3.0.
MongoDB 3.x to 4.4.x
Prior to Tyk 5.0.2, Tyk used the mgo
driver which supported MongoDB 3.x to 4.4.x, but we no longer test MongoDB versions prior to 5.0 since they are EOL.
We can not guarantee full compatibility with these versions of MongoDB for Tyk and recommend upgrading to a supported MongoDB version. In particular, when using Tyk OAS APIs with Tyk 5.3.0 onwards, the minimum supported version of MongoDB is 5.0.
You can also use the following as a drop-in replacement for MongoDB:
- Amazon DocumentDB 3.6 and 4 engine
- Azure Cosmos DB for MongoDB 3.6 and 4 engine
Choose a MongoDB driver
From Tyk 5.0.2, we added an option to use the official MongoDB Go driver to connect to MongoDB.
We recommend using the mongo-go driver if you are using MongoDB 4.4.x+. For MongoDB versions prior to 4.4, please use the mgo driver.
With the mongo-go driver, we support the latest versions of MongoDB (5.0.x, v6.0.x, and v7.0.x) and also features such as the “+srv” connection string and SCRAM-SHA-256. For more details, visit the MongoDB doc:
You can configure which driver to use with the MongoDB driver option:
Split out your DB
This is a no-brainer, but keep Redis and MongoDB off the system running the Gateway, they both use lots of RAM, and with Redis and the Gateway constantly communicating you will be facing resource contention on the CPU for a marginal decrease in latency.
So in our setup, we recommend that Redis and MongoDB/PostgreSQL live on their own systems, separate from your Tyk Gateway. If you like, run them together on the same box, that’s up to you.
The network topology we like to use is:
- Two or more Tyk Gateway nodes (load balanced, each Gateway installed on separate machines).
- A separate MongoDB or PostgreSQL cluster
- A separate Redis server with fail-over or cluster
- One Tyk Dashboard node installed on a separate machine
- One Tyk Pump node installed on a separate machine that handles data transitions
Special notes for DocumentDB
Note
If you are using DocumentDB, capped collections are not supported. See here for more details.
Special notes for MongoDB Atlas In order to integrate with MongoDB Atlas, make sure the IP firewall connections are whitelisted on the Atlas side, and then use the following Tyk Dashboard configurations to connect:
- TYK_DB_MONGOURL=mongodb://admin:[email protected]:27017,tykdb-shard-00-01.h42pp.mongodb.net:27017,tykdb-shard-00-02.h42pp.mongodb.net:27017/tyk_analytics?authSource=admin - TYK_DB_ENABLECLUSTER=false - TYK_DB_MONGOUSESSL=true
More information on these configuration variables here.
MongoDB Sizing Guidelines
The aggregate record size depends on the number of APIs and Keys you have. Each counter size ~50b, and every aggregated value has its own counter.
So an hourly aggregate record is computed like this: 50 * active_apis + 50 * api_versions + 50 * active_api_keys + 50 * oauth_keys, etc.
The average aggregate record size (created hourly) on our cloud is about ~ 40KB (a single record includes all the aggregate stats mentioned above).
So for 1 million requests per day, it will generate 1KB * 1M request stats (1GB) + 24 * 40KB aggregate stats (~1MB).
Per month: 30GB request logs + 30MB aggregate logs
MongoDB Working Data
Working data in terms of MongoDB is the data you query most often. The graphs displayed on the Tyk Dashboard, except for the Log browser, use aggregated data.
So if you rely only on this kind of analytic data, you will not experience issues with working data and memory issues. It is literally hundreds of MBs.
Even if you use the Log browser, its usage access is usually quite random, and it is unlikely that you check requests for every request. So it can’t be called working data. And it is ok to store it on disk, and allow MongoDB to do the disk lookups to fetch the data.
Note, that in order to do fast queries, even from the disk, MongoDB uses indexes. MongoDB recommends that indexes should fit into memory, and be considered working data, but only the part of the index which is commonly used. For example the last month of data.
For an aggregate collection, the average index size is 6% from the overall collection. For requests stats it is around 30%.
MongoDB Sizing Example If you serve 1 million requests per day, and require fast access to the last seven days of request logs (usually way less, and the performance of the log viewer is not a concern), with 3 months of aggregated logs, the memory requirements for MongoDB can be as follows:
Request_logs_index ( 30% * (1GB * 7) ) + aggregated(3month * 30MB) ~= 2.1GB + 90MB = ~ 2.2GB
In addition to storing working data in memory, MongoDB also requires space for some internal data structures. In general multiplying the resulting number by 2x should be enough. In the above example, your MongoDB server should have around 4.4GB of available memory.
Audit Log storage
From Tyk Dashboard v5.7+, audit log can be configured to be stored in the database. If you choose to store the audit logs in database, you need to account for additional storage for audit logs in the database setup. The size of this table will depend on the number of operations recorded, with each record averaging 1350 to 1450 bytes.
Audit Log Considerations
- Data Generation: The total size of the audit log table will depend on the number of API operations, administrative actions, and system events that are being logged.
- Daily Estimate: For example, logging 100,000 operations per day results in 135MB to 145MB of additional data daily.
- Storage Growth: Over time, this can significantly impact your storage requirements, especially in high-traffic environments or systems with comprehensive logging enabled.
Recommendations for Housekeeping the Audit Log Table
-
Implement Data Retention Policies: Define a clear retention period based on business and regulatory requirements, such as 30, 90, or 180 days. Remove older logs that exceed the retention policy to prevent excessive storage growth.
-
Archive Older Logs: For long-term storage or compliance purposes, move older logs to external systems such as a data lake, object storage (e.g., S3), or a data warehouse.
-
Monitor Growth Trends: Use monitoring tools to track the size and growth rate of the audit log table. Adjust retention policies or resources proactively based on observed trends.
-
Plan for Resource Scaling: Audit log storage can significantly impact overall database size, especially in high-traffic environments. Plan for storage and resource scaling based on daily log growth estimates.
Example Calculation:
- Daily Logs: 100,000 operations/day
- Average Record Size: 1400 bytes
- Storage Growth: 100,000 × 1400 bytes/day = 140MB/day
For 90 days: 140MB × 90 = ~12.6GB
MongoDB Database Storage Calculator You can calculate your MongoDB storage requirements by entering your known values in the middle section of the calculator settings below:
PostgreSQL
How you configure your PostgreSQL installation depends on whether you are installing Tyk from fresh using PostgreSQL, or are migrating from an existing MongoDB instance.
Supported Versions
From Tyk 4.0, you can use PostgreSQL as your datastore. We support the following versions:
- PostgreSQL version 12.x, 13.x, 14.x, 15.x, 16.x
You can also use the following as a drop in replacement for PostgreSQL:
Note
In a production environment, we only support the PostgreSQL versions listed above.
For POC, you can also use the following as replacement:
- SQLite 3.x
Migrating from an existing MongoDB instance
For v4.0 we have provided a migration command that will help you migrate all data from the main storage layer (APIs, Policies, Users, UserGroups, Webhooks, Certificates, Portal Settings, Portal Catalogs, Portal Pages, Portal CSS etc.).
Note
The migration tool will not migrate any Logs, Analytics or Uptime analytics data.
- Make sure your new SQL platform and the existing MongoDB instance are both running
- Configure the
main
part ofstorage
section of yourtyk-analytics.conf
:
{
...
"storage": {
...
"main": {
"type": "postgres",
"connection_string": "user=root password=admin database=tyk-demo-db host=tyk-db port=5432"
}
}
}
- Run the following command:
./tyk-analytics migrate-sql
You will see output listing the transfer of each database table. For example: Migrating 'tyk_apis' collection. Records found: 7
.
- You can now remove your
mongo_url
(orTYK_DB_MONGOURL
environment variable) from yourtyk-analytics.conf
- Restart your Tyk Dashboard
PostgreSQL Sizing Guidelines
The aggregate record size depends on the number of APIs and Keys you have. Each counter size ~50b, and every aggregated value has its own counter.
So an hourly aggregate record is computed like this: 50 * active_apis + 50 * api_versions + 50 * active_api_keys + 50 * oauth_keys, etc.
The average aggregate record size (created hourly) on our cloud is about ~ 40KB (a single record includes all the aggregate stats mentioned above).
So for 1 million requests per day, it will generate 1KB * 1M request stats (1GB) + 24 * 40KB aggregate stats (~1MB).
Per month: 30GB request logs + 30MB aggregate logs
PostgreSQL Database Storage Calculator You can calculate your PostgreSQL storage requirements by entering your known values in the middle section of the calculator settings below:
Ensure High Availability
Ensuring high availability is essential for delivering a reliable API experience, especially when maintaining service level agreements (SLAs) for your clients. Whether it involves limiting round-trip times, guaranteeing timely responses, creating self-healing architectures, or isolating failing services, high availability measures ensure that your infrastructure remains resilient under pressure.
Tyk provides a comprehensive suite of features to help you achieve these goals. Circuit breakers allow you to detect and mitigate failures before they cascade, while enforced timeouts ensure that slow requests do not compromise overall system performance. With tailored configurations for both OAS and Classic deployments, Tyk empowers you to build robust, fail-safe API environments that prioritize uptime and enforce SLA requirements.
Circuit Breakers
A circuit breaker is a protective mechanism that helps to maintain system stability by preventing repeated failures and overloading of services that are erroring. When a network or service failure occurs, the circuit breaker prevents further calls to that service, allowing the affected service time to recover while ensuring that the overall system remains functional. It is a critical component in ensuring the resilience and reliability of a distributed system.
Tyk’s circuit breaker can be configured at the endpoint level, where it monitors the rate of failure responses (HTTP 500 or higher) received from the upstream service. If that failure rate exceeds the configured threshold, the circuit breaker will trip and Tyk will block further requests to that endpoint (returning HTTP 503 Service temporarily unavailable
) until the end of a recovery (cooldown) time period.
Tyk can trigger events when the circuit breaker trips and when it resets. These events can be used for monitoring, alerting, or automation of recovery processes.
When to use a circuit breaker
Protection of critical API endpoints
Circuit breakers can be used to safeguard essential API endpoints from overloading, ensuring their availability and performance. By implementing circuit breakers, users can prevent these endpoints from being overwhelmed, maintaining their reliability and responsiveness.
Handling temporary issues
Circuit breakers can help handle temporary issues in the system, such as temporary outages or performance degradation, by opening and closing the circuit when conditions are unfavorable, allowing the system to recover and resume normal operation.
Implementing retry logic
Circuit breakers can be used to automatically manage the retry of failed requests after a hold-off period, increasing the chances of successful execution.
Implementing fallback mechanisms
Circuit breakers can trigger alternative workflows or fallback mechanisms when the primary system fails, ensuring uninterrupted service delivery despite system failures.
How the circuit breaker works
Similarly to the circuit breaker in an electrical installation, Tyk’s circuit breaker middleware monitors the flow and trips (breaks the connection) if it detects errors. Whilst the electrical circuit breaker monitors the flow of electricity and trips if it detects overcurrent (e.g. a short-circuit), Tyk’s monitors the responses back from the upstream service and trips if it detects too many failures.
From the perspective of the circuit breaker middleware, a failure is considered any response with HTTP status code 500
or above.
The circuit breaker is rate-based, meaning that it counts the number of failure responses received in a rolling sample window and trips if the failure rate exceeds the configured threshold.
The rolling sample window is set to 10 seconds and the circuit breaker is designed to trip only if a user-configurable minimum number of samples (requests) fail within the window period.
Thus, if the sample size is set to 100 and the failure rate is set to 0.5 (50%) then the circuit breaker will trip only when there have been a minimum of 100 requests made in the past 10 seconds of which at least 50 have failed (returned an HTTP 500
or higher error).
Once the breaker has been tripped it will remain open, blocking calls to the endpoint until a configurable cooldown (or return-to-service) period has elapsed. While the breaker is open, requests to the endpoint will return HTTP 503 Service temporarily unavailable
.
Half-open mode
In some scenarios the upstream service might recover more quickly than the configured cooldown period. The middleware supports a half-open mode that facilitates an early return-to-service so that API clients do not have to wait until the end of the cooldown before the circuit breaker is reset.
In the half-open mode, Tyk will periodically issue requests to the upstream service to check whether the path has been restored (while continuing to block client requests). If the Gateway detects that the path has been reconnected, the circuit breaker will be automatically reset (following the electrical circuit analogy, the circuit breaker is closed) and requests will be passed to the upstream again.
Configuring the circuit breaker
The circuit breaker is configured using only three parameters:
- sample size
- error rate threshold
- cooldown period
The threshold is a ratio of the number of failures received in the sample window. For example, if the sample window size is 100 requests and you wish to trip the circuit breaker if there are 15 failures in any 100 requests, the threshold should be set to 15/100 = 0.15
.
The cooldown period is the time that the circuit breaker will remain open after the error rate threshold has been met and the breaker has been tripped.
There is also an option to enable or disable the half-open state if this would be damaging to your system.
Note
If you are using the Service Discovery module, every time the breaker trips, Tyk will attempt to refresh the Gateway list.
Using the circuit breaker with multiple upstream hosts
The circuit breaker works at the endpoint level independent of the number of upstream hosts are servicing the requests. Thus, if you have multiple upstream targets for an API, the sample and failure counts are accumulated across all upstream requests. If the failure rate exceeds the threshold, the circuit breaker will trip even if only some of your upstream hosts are failing. Operating in half-open mode will of course cause the breaker to reset if a responsive upstream receives a request, but the BreakerTripped
(or BreakerTriggered
) event should alert you to the fact that at least one host is failing.
Using the circuit breaker with multiple Tyk Gateways
Circuit breakers operate on a single Tyk Gateway, they do not centralise or pool back-end data. This ensures optimum speed of response and resilience to Gateway failure. Subsequently, in a load balanced environment where multiple Tyk Gateways are used, some traffic can spill through even after the circuit breaker has tripped on one Gateway as other Gateways continue to serve traffic to the upstream before their own breakers trip.
Circuit breaker events
The circuit breaker automatically controls the flow of requests to the upstream services quickly and efficiently, but it is equally important to alert you to the fact that there is an issue and to confirm when traffic will recommence once the issue is resolved. Tyk’s Event system provides the method by which the circuit breaker can alert you to these occurrences.
- When the circuit breaker trips (from closed to open), Tyk will generate a
BreakerTripped
event - When the breaker resets (from open to closed), whether at the end of the cooldown period or if connection is restored while in half-open mode, Tyk will generate a
BreakerReset
event - In addition to these, whenever the circuit breaker changes state (from closed to open or vice versa), Tyk will generate a
BreakerTriggered
event
For the generic BreakerTriggered
event, the state change will be indicated in the Status
field in the webhook template as follows:
- when a breaker trips
CircuitEvent = 0
- when a breaker resets
CircuitEvent = 1
API-level circuit breaker
Tyk does not have an API-level circuit breaker that can be applied across all endpoints. If you are using the Tyk Dashboard, however, then you are able to use an Open Policy Agent to append a circuit breaker to every API/Service using the regex .*
path.
If you’re using Tyk OAS APIs, then you can find details and examples of how to configure the circuit breaker middleware here.
If you’re using Tyk Classic APIs, then you can find details and examples of how to configure the circuit breaker middleware here.
Using the Circuit Breaker middleware with Tyk OAS APIs
Tyk’s circuit breaker middleware is configured at the endpoint level, where it monitors the rate of failure responses (HTTP 500 or higher) received from the upstream service. If that failure rate exceeds the configured threshold, the circuit breaker will trip and Tyk will block further requests to that endpoint (returning HTTP 503 Service temporarily unavailable
) until the end of a recovery (cooldown) time period.
When working with Tyk OAS APIs the circuit breaker is configured in the Tyk OAS API Definition. You can do this via the Tyk Dashboard API or in the API Designer.
If you’re using the legacy Tyk Classic APIs, then check out the Tyk Classic page.
Configuring the Circuit Breaker in the Tyk OAS API Definition
The design of the Tyk OAS API Definition takes advantage of the operationId
defined in the OpenAPI Document that declares both the path and method for which the middleware should be added. Endpoint paths
entries (and the associated operationId
) can contain wildcards in the form of any string bracketed by curly braces, for example /status/{code}
. These wildcards are so they are human readable and do not translate to variable names. Under the hood, a wildcard translates to the “match everything” regex of: (.*)
.
The circuit breaker middleware (circuitBreaker
) can be added to the operations
section of the Tyk OAS Extension (x-tyk-api-gateway
) in your Tyk OAS API Definition for the appropriate operationId
(as configured in the paths
section of your OpenAPI Document).
The circuitBreaker
object has the following configuration:
enabled
: enable the middleware for the endpointthreshold
: the proportion of requests that can error before the breaker is tripped, this must be a value between 0.0 and 1.0sampleSize
: the minimum number of requests that must be received during the rolling sampling window before the circuit breaker can tripcoolDownPeriod
: the period for which the breaker will remain open after being tripped before returning to service (seconds)halfOpenStateEnabled
: if set totrue
then the circuit breaker will operate in half-open mode once it has been tripped
|
|
In this example Tyk OAS API Definition the circuit breaker has been configured to monitor requests to the GET /status/200
endpoint.
It will configure the circuit breaker so that if a minimum of 10 requests (sampleSize
) to this endpoint are received during the rolling sampling window then it will calculate the ratio of failed requests (those returning HTTP 500
or above) within that window.
- if the ratio of failed requests exceeds 50% (
threshold = 0.5
) then the breaker will be tripped - after it has tripped, the circuit breaker will remain open for 60 seconds (
coolDownPeriod
) - further requests to
GET /status/200
will returnHTTP 503 Service temporarily unavailable
- the circuit breaker will operate in half-open mode (
halfOpenStateEnabled = true
) so when the threshold has been reached and the breaker is tripped, Tyk will periodically poll the upstream service to test if it has become available again
The configuration above is a complete and valid Tyk OAS API Definition that you can import into Tyk to try out the circuit breaker.
Configuring the Circuit Breaker in the API Designer
Adding the circuit breaker to your API endpoints is easy when using the API Designer in the Tyk Dashboard, simply follow these steps:
Step 1: Add an endpoint
From the API Designer add an endpoint that matches the path and method to which you want to apply the middleware.
Step 2: Select the Circuit Breaker middleware
Select ADD MIDDLEWARE and choose the Circuit Breaker middleware from the Add Middleware screen.
Step 3: Configure the middleware
Set the circuit breaker configuration parameters so that Tyk can protect your upstream service if it experiences failure:
- threshold failure rate for the proportion of requests that can error before the breaker is tripped (a value between 0.0 and 1.0)
- the minimum number of requests that must be received during the rolling sampling window before the circuit breaker can trip
- the cooldown period for which the breaker will remain open after being tripped before returning to service (in seconds)
- optionally enable half-open mode for upstream services with variable recovery times
Select ADD MIDDLEWARE to apply the change to the middleware configuration.
Step 4: Save the API
Select SAVE API to apply the changes to your API.
Using the Circuit Breaker middleware with Tyk Classic APIs
Tyk’s circuit breaker middleware is configured at the endpoint level, where it monitors the rate of failure responses (HTTP 500 or higher) received from the upstream service. If that failure rate exceeds the configured threshold, the circuit breaker will trip and Tyk will block further requests to that endpoint (returning HTTP 503 Service temporarily unavailable
) until the end of a recovery (cooldown) time period.
When working with Tyk Classic APIs the circuit breaker is configured in the Tyk Classic API Definition. You can do this via the Tyk Dashboard API or in the API Designer.
If you’re using the newer Tyk OAS APIs, then check out the Tyk OAS page.
If you’re using Tyk Operator then check out the configuring the Circuit Breaker in Tyk Operator section below.
Configuring the Circuit Breaker in the Tyk Classic API Definition
To configure the circuit breaker you must add a new circuit_breakers
object to the extended_paths
section of your API definition, with the following configuration:
path
: the endpoint pathmethod
: the endpoint HTTP methodthreshold_percent
: the proportion of requests that can error before the breaker is tripped, this must be a value between 0.0 and 1.0samples
: the minimum number of requests that must be received during the rolling sampling window before the circuit breaker can tripreturn_to_service_after
: the period for which the breaker will remain open after being tripped before returning to service (seconds)disable_half_open_state
: by default the Tyk circuit breaker will operate in half-open mode when working with Tyk Classic APIs, set this totrue
if you want Tyk to wait the full cooldown period before closing the circuit
For example:
|
|
In this example the circuit breaker has been configured to monitor HTTP GET
requests to the /status/200
endpoint. It will configure a sampling window (samples
) of 10 requests and calculate the ratio of failed requests (those returning HTTP 500 or above) within that window. If the ratio of failed requests exceeds 50% (threshold_percent = 0.5
) then the breaker will be tripped. After it has tripped, the circuit breaker will remain open for 60 seconds (return_to_service_after
). The circuit breaker will operate in half-open mode (disable_half_open_state = false
) so when open, Tyk will periodically poll the upstream service to test if it has become available again.
When the breaker has tripped, it will return HTTP 503 Service temporarily unavailable
in response to any calls to GET /status/200
.
Configuring the Circuit Breaker in the API Designer
You can use the API Designer in the Tyk Dashboard to configure the circuit breaker middleware for your Tyk Classic API by following these steps.
Step 1: Add an endpoint for the path and select the Circuit Breaker plugin
From the Endpoint Designer add an endpoint that matches the path for which you want to deploy the circuit breaker. Select the Circuit Breaker plugin.
Step 2: Configure the circuit breaker
You can set up the various configurations options for the breaker in the drawer by clicking on it:
- Trigger threshold percentage: The percentage of requests that can error before the breaker is tripped, this must be a value between 0.0 and 1.0
- Sample size (requests): The number of samples to take for a circuit breaker window
- Return to service in (s): The cool-down period of the breaker to return to service (seconds)
Step 3: Save the API
Use the save or create buttons to save the changes and activate the middleware.
Step 4: Optionally configure webhooks to respond to the circuit breaker events
The Dashboard supports the separate BreakerTripped
and BreakerReset
events, but not the combined BreakerTriggered
event type. You should use API Designer > Advanced Options to add a Webhook plugin to your endpoint for each event.
Configuring the Circuit Breaker in Tyk Operator
The example API Definition below configures an API to listen on path /httpbin-timeout-breaker
and forwards requests upstream to http://httpbin.org. A hard timeout value of 2 seconds is configured for path /delay/{delay_seconds}
. This will return a 504 Gateway Timeout
response to the client if the upstream response is not received before expiry of the timer.
|
|
A circuit breaker has been configured to monitor HTTP GET
requests to the /status/500
endpoint. It will configure a sampling window (samples) of 4 requests and calculate the ratio of failed requests (those returning HTTP 500 or above) within that window. If the ratio of failed requests exceeds 50% (threshold_percent = 0.5) then the breaker will be tripped. After it has tripped, the circuit breaker will remain open for 10 seconds (return_to_service_after). The circuit breaker will operate using the default half-open mode so when open, Tyk will periodically poll the upstream service to test if it has become available again.
When the breaker has tripped, it will return HTTP 503 Service temporarily unavailable in response to any calls to GET /status/500.
Enforced Timeouts
In any system, a task or operation takes a certain period of time to complete. When a client makes a request to the Tyk Gateway, it will be dependent upon the responsiveness of the upstream service before it can continue. If the upstream service is suffering from resource overload or congestion the response may be returned too late leading to unacceptable experience for the end user or even to instability in the system.
Tyk’s Enforced Timeout middleware can be used to apply a maximum time that the Gateway will wait for a response before it terminates (or times out) the request. If the timeout expires, then Tyk will notify the client with an HTTP 504 Gateway Timeout
error.
This feature helps to maintain system stability and prevents unresponsive or long-running tasks from affecting the overall performance of the system. The enforced timeout can be customized and configured to suit specific requirements, providing control over resource allocation and ensuring optimal system functionality.
When to use an enforced timeout
Resource management
The enforced timeout can be implemented to manage system resources efficiently, particularly in high-traffic environments, preventing long-running tasks from monopolising resources, ensuring fair distribution and optimal performance.
Task prioritization
Prioritizing critical tasks by setting timeouts based on their expected time-to-complete helps to ensure that essential tasks are completed by reducing the impact of non-responsive upstream services.
Security measures
Limiting task durations can help protect against potential security breaches or malicious activities by setting time constraints on user sessions or API requests.
Time-sensitive operations
For time-sensitive tasks, enforced timeouts can guarantee timely completion and avoid delays or missed deadlines.
How the enforced timeout middleware works
The enforced timeout middleware is enabled and configured at the endpoint level.
The configuration is very simple, the only option being the duration of the timeout (which is declared in seconds) after which the upstream request will be terminated and an HTTP 504 Gateway Timeout
error returned to the client.
Note
If you are using the Service Discovery option, if an enforced timeout is triggered, the service discovery module will refresh the host / host list.
If you’re using Tyk OAS APIs, then you can find details and examples of how to configure the enforced timeout middleware here.
If you’re using Tyk Classic APIs, then you can find details and examples of how to configure the enforced timeout middleware here.
Using the Enforced Timeout middleware with Tyk OAS APIs
Tyk’s enforced timeout middleware is configured at the endpoint level, where it sets a limit on the response time from the upstream service. If the upstream takes too long to respond to a request, Tyk will terminate the request and return 504 Gateway Timeout
to the client.
When working with Tyk OAS APIs the enforced timeout is configured in the Tyk OAS API Definition. You can do this via the Tyk Dashboard API or in the API Designer.
If you’re using the legacy Tyk Classic APIs, then check out the Tyk Classic page.
Configuring an enforced timeout in the Tyk OAS API Definition
The design of the Tyk OAS API Definition takes advantage of the operationId
defined in the OpenAPI Document that declares both the path and method for which the middleware should be added. Endpoint paths
entries (and the associated operationId
) can contain wildcards in the form of any string bracketed by curly braces, for example /status/{code}
. These wildcards are so they are human readable and do not translate to variable names. Under the hood, a wildcard translates to the “match everything” regex of: (.*)
.
The enforced timeout middleware (enforceTimeout
) can be added to the operations
section of the Tyk OAS Extension (x-tyk-api-gateway
) in your Tyk OAS API Definition for the appropriate operationId
(as configured in the paths
section of your OpenAPI Document).
The enforceTimeout
object has the following configuration:
enabled
: enable the middleware for the endpointvalue
: the duration of the upstream request timer
For example:
|
|
In this example Tyk OAS API definition, the enforced timeout has been configured to monitor requests to the GET /status/200
endpoint. It will configure a timer that will expire (timeout
) 3 seconds after the request is proxied to the upstream service. If the upstream response is not received before the expiry of the timer, that request will be terminated and Tyk will return 504 Gateway Timeout
to the client.
The configuration above is a complete and valid Tyk OAS API Definition that you can import into Tyk to try out the enforced timeout.
Configuring an enforced timeout in the API Designer
Adding the enforced timeout to your API endpoints is easy when using the API Designer in the Tyk Dashboard, simply follow these steps:
Step 1: Add an endpoint
From the API Designer add an endpoint that matches the path and method to which you want to apply the middleware.
Step 2: Select the Enforce Timeout middleware
Select ADD MIDDLEWARE and choose the Enforce Timeout middleware from the Add Middleware screen.
Step 3: Configure the middleware
Set the timeout duration that you wish to enforce for requests to the endpoint.
Select ADD MIDDLEWARE to apply the change to the middleware configuration.
Step 4: Save the API
Select SAVE API to apply the changes to your API.
Using the Enforced Timeout middleware with Tyk Classic APIs
Tyk’s enforced timeout middleware is configured at the endpoint level, where it sets a limit on the response time from the upstream service. If the upstream takes too long to respond to a request, Tyk will terminate the request and return 504 Gateway Timeout
to the client.
When working with Tyk Classic APIs the enforced timeout is configured in the Tyk Classic API Definition. You can do this via the Tyk Dashboard API or in the API Designer.
If you’re using the newer Tyk OAS APIs, then check out the Tyk OAS page.
If you’re using Tyk Operator then check out the configuring an enforced timeout in Tyk Operator section below.
Configuring an enforced timeout in the Tyk Classic API Definition
To configure an enforced timeout you must add a new hard_timeouts
object to the extended_paths
section of your API definition.
It has the following configuration:
path
: the endpoint pathmethod
: the endpoint HTTP methodtimeout
: the duration of the upstream request timer
For example:
{
"hard_timeouts": [
{
"path": "/status/200",
"method": "GET",
"timeout": 3
}
]
}
In this example the enforced timeout has been configured to monitor requests to the GET /status/200
endpoint. It will configure a timer that will expire (timeout
) 3 seconds after the request is proxied to the upstream service.
If the upstream response is not received before the expiry of the timer, that request will be terminated and Tyk will return 504 Gateway Timeout
to the client.
Configuring an enforced timeout in the API Designer
You can use the API Designer in the Tyk Dashboard to configure the enforced timeout middleware for your Tyk Classic API by following these steps.
Step 1: Add an endpoint for the path and select the Enforced Timeout plugin
From the Endpoint Designer add an endpoint that matches the path for which you want to deploy the enforced timeout. Select the Enforced timeout plugin.
Step 2: Configure the timeout
Then enter the timeout to be enforced for the endpoint (in seconds):
Step 3: Save the API
Use the save or create buttons to save the changes and activate the middleware.
Configuring an enforced timeout in Tyk Operator
The process for configuring the middleware in Tyk Operator is similar to that explained in configuring an enforced timeout in the Tyk Classic API Definition. It is possible to configure an enforced timeout using the hard_timeouts
object within the extended_paths
section of the API Definition.
The example API Definition below configures an API to listen on path /httpbin-timeout-breaker
and forwards requests upstream to http://httpbin.org. A hard timeout value of 2 seconds is configured for path /delay/{delay_seconds}
. This will return a 504 Gateway Timeout
response to the client if the upstream response is not received before expiry of the timer.
|
|
We can test the example using the curl command as shown below:
curl http://localhost:8081/httpbin-timeout/delay/3 -i
HTTP/1.1 504 Gateway Timeout
Content-Type: application/json
X-Generator: tyk.io
Date: Fri, 09 Aug 2024 07:43:48 GMT
Content-Length: 57
{
"error": "Upstream service reached hard timeout."
}
Set Up Liveness Health Checks
Health checks are extremely important in determining the status of an application - in this instance, the Tyk Gateway. Without them, it can be hard to know the actual state of the Gateway.
Depending on your configuration, the Gateway could be using a few components:
- The Tyk Dashboard.
- RPC
- Redis (compulsory).
Any of these components could go down at any given point and it is useful to know if the Gateway is currently usable or not. A good usage of the health check endpoint is for the configuration of a load balancer to multiple instances of the Gateway or as a Kubernetes liveness probe.
The following component status will not be returned:
- MongDB or SQL
- Tyk Pump
Note
Health check is implemented as per the Health Check Response Format for HTTP APIs RFC
An example of the response from this API is as follows:
{
"status": "pass",
"version": "v3.1.1",
"description": "Tyk GW",
"details": {
"redis": {
"status": "pass",
"componentType": "datastore",
"time": "2020-05-19T03:42:55+01:00"
},
"dashboard": {
"status": "pass",
"componentType": "system",
"time": "2020-05-19T03:42:55+01:00"
},
"rpc": {
"status": "pass",
"componentType": "system",
"time": "2020-05-19T03:42:55+01:00"
}
}
}
Status Levels
The following status levels can be returned in the JSON response.
-
pass: Indicates that all components required for the Gateway to work 100% are available, and there is no impact on your traffic.
-
warn: Indicates that one of the components is having an outage but your Gateway is able to keep processing traffic. The impact is medium (i.e. no quotas are applied, no analytics, no RPC connection to MDCB).
-
fail: Indicates that Redis AND the Tyk Dashboard are unavailable, and can and indicate other failures. The impact is high (i.e. no configuration changes are available for API/policies/keys, no quotas are applied, and no analytics).
Configure health check
By default, the liveness health check runs on the /hello
path. But
it can be configured to run on any path you want to set. For example:
health_check_endpoint_name: "status"
This configures the health check to run on /status
instead of /hello
.
Refresh Interval
The Health check endpoint will refresh every 10 seconds.
HTTP error code
The Health check endpoint will always return a HTTP 200 OK
response if the polled health check endpoint is available on your Tyk Gateway. If HTTP 200 OK
is not returned, your Tyk Gateway is in an error state.
For MDCB installations the /hello
endpoint can be polled in either your Management or Worker Gateways. It is recommended to use the /hello
endpoint behind a load balancer for HA purposes.
Health check examples
The following examples show how the Health check endpoint returns
Pass Status
The following is returned for a pass
status level for the Open Source Gateway:
$ http :8080/hello
HTTP/1.1 200 OK
Content-Length: 156
Content-Type: application/json
Date: Wed, 14 Apr 2021 17:36:09 GMT
{
"description": "Tyk GW",
"details": {
"redis": {
"componentType": "datastore",
"status": "pass",
"time": "2021-04-14T17:36:03Z"
}
},
"status": "pass",
"version": "v3.1.1"
}
Redis outage
$ http :8080/hello
HTTP/1.1 200 OK
Content-Length: 303
Content-Type: application/json
Date: Wed, 14 Apr 2021 14:58:06 GMT
{
"description": "Tyk GW",
"details": {
"dashboard": {
"componentType": "system",
"status": "pass",
"time": "2021-04-14T14:58:03Z"
},
"redis": {
"componentType": "datastore",
"output": "storage: Redis is either down or was not configured",
"status": "fail",
"time": "2021-04-14T14:58:03Z"
}
},
"status": "warn",
"version": "v3.1.2"
}
Dashboard outage
$ http :8080/hello
HTTP/1.1 200 OK
Content-Length: 292
Content-Type: application/json
Date: Wed, 14 Apr 2021 15:52:47 GMT
{
"description": "Tyk GW",
"details": {
"dashboard": {
"componentType": "system",
"output": "dashboard is down? Heartbeat is failing",
"status": "fail",
"time": "2021-04-14T15:52:43Z"
},
"redis": {
"componentType": "datastore",
"status": "pass",
"time": "2021-04-14T15:52:43Z"
}
},
"status": "warn",
"version": "v3.1.2"
}
Dashboard and Redis outage
$ http :8080/hello
HTTP/1.1 200 OK
Content-Length: 354
Content-Type: application/json
Date: Wed, 14 Apr 2021 17:53:33 GMT
{
"description": "Tyk GW",
"details": {
"dashboard": {
"componentType": "system",
"output": "dashboard is down? Heartbeat is failing",
"status": "fail",
"time": "2021-04-14T17:53:33Z"
},
"redis": {
"componentType": "datastore",
"output": "storage: Redis is either down or was not configured",
"status": "fail",
"time": "2021-04-14T17:53:33Z"
}
},
"status": "fail",
"version": "v3.1.2"
}
MDCB Worker Gateway RPC outage
$ http :8080/hello
HTTP/1.1 200 OK
Content-Length: 333
Content-Type: application/json
Date: Wed, 14 Apr 2021 17:21:24 GMT
{
"description": "Tyk GW",
"details": {
"redis": {
"componentType": "datastore",
"output": "storage: Redis is either down or was not configured",
"status": "fail",
"time": "2021-04-14T17:21:16Z"
},
"rpc": {
"componentType": "system",
"output": "Could not connect to RPC",
"status": "fail",
"time": "2021-04-14T17:21:16Z"
}
},
"status": "fail",
"version": "v3.1.2"
}
Load Balancing
Tyk supports native round-robin load-balancing in its proxy. This means that Tyk will rotate requests through a list of target hosts as requests come in. This can be very useful in microservice architectures where clusters of specialized services are launched for high availability.
Setting up load balancing is done on a per API basis, and is defined in the API Definition file/object:
-
proxy.enable_load_balancing
: Set this value totrue
to have a Tyk node distribute traffic across a list of servers. -
proxy.target_list
: A list of upstream targets (can be one or many hosts):
"target_list": [
"http://10.0.0.1",
"http://10.0.0.2",
"http://10.0.0.3",
"http://10.0.0.4"
]
Note
You must fill in the target_list
section.
See Service Discovery to see how you can integrate a service discovery system such as Consul or etcd with Tyk and enable dynamic load balancing support.
Configure load balancing and weighting via the Dashboard
To set up load balancing via the Dashboard, from the Core Settings tab in the API Designer select Enable round-robin load balancing from the API Settings options:
You can now add your Load Balancing Upstream targets and apply weighting to it. For example, for testing purposes, you can send 10% (set weighting to 1
) of traffic to a beta environment, and 90% (set weighting to 9
)to the production environment.
Note
Weighting is new from v1.10 of the Dashboard
Configure load balancing via Tyk Operator
Load balancing is configured within Tyk Operator, using the following configuration parameters within the proxy configuration block:
enable_load_balancing
: Set totrue
to activate load balancingtarget_list
: Specifies a list of upstream targets
An example is shown below:
|
|
gRPC load balancing
You can also perform gRPC Load balancing.
Service Discovery
Service Discovery is a very useful feature for when you have a dynamically changing upstream service set.
For example, you have ten Docker containers that are running the same service, and you are load balancing between them, if one or more fail, a new service will spawn but probably on a different IP address.
Now the Gateway would need to either be manually reconfigured, or, more appropriately, detect the failure and reconfigure itself.
This is what the service discovery module does.
We recommend using the SD module in conjunction with the circuit breaker features, as this makes detection and discovery of failures at the gateway level much more dynamic and responsive.
Service Discovery: Dashboard
The Service Discovery settings are located in the Core tab from the API Designer.
Configuring Service Discovery via the Dashboard
Select Enable service discovery to enable the discovery module.
Once enabled, you will have all the options to configure your Service Discovery endpoints:
The settings are as follows:
-
Service discovery options: New Functionality
-
Query endpoint: The endpoint to call, this would probably be your Consul, etcd or Eureka K/V store.
-
Target path: Use this setting to set a target path to append to the discovered endpoint, since many SD services only provide host and port data, it is important to be able to target a specific resource on that host, setting this value will enable that.
-
Data path: The namespace of the data path, so for example if your service responds with:
{
"action": "get",
"node": {
"key": "/services/single",
"value": "http://httpbin.org:6000",
"modifiedIndex": 6,
"createdIndex": 6
}
}
Then your namespace would be `node.value`.
- Are the values nested?: Sometimes the data you are retrieving is nested in another JSON object, e.g. this is how etcd responds with a JSON object as a value key:
{
"action": "get",
"node": {
"key": "/services/single",
"value": "{"hostname": "http://httpbin.org", "port": "80"}",
"modifiedIndex": 6,
"createdIndex": 6
}
}
In this case, the data actually lives within this string-encoded JSON object, so in this case, you set the value to checked
, and use a combination of the data path and parent data path (below).
- Parent data path: This is the namespace of the where to find the nested value, in the above example, it would be
node.value
. You would then change the data path setting to behostname
, since this is where the hostname data resides in the JSON string. Tyk automatically assumes that the data_path in this case is in a string-encoded JSON object and will try to deserialise it.
Tyk will decode the JSON string and then apply the data path namespace to that object in order to find the value.
- Port data path: In the above nested example, we can see that there is a separate
port
value for the service in the nested JSON. In this case you can set the port data path value and Tyk will treat data path as the hostname and zip them together (this assumes that the hostname element does not end in a slash or resource identifier such as/widgets/
).
In the above example, the port data path would be port
.
-
Is port information separate from the hostname?: New Functionality
-
Does the endpoint provide a target list?: If you are using load balancing, set this value to true and Tyk will treat the data path as a list and inject it into the target list of your API Definition.
-
Cache timeout: Tyk caches target data from a discovery service, in order to make this dynamic you can set a cache value when the data expires and new data is loaded. Setting it too low will cause Tyk to call the SD service too often, setting it too high could mean that failures are not recovered from quickly enough.
Service Discovery Config: API Definition
Service discovery is configured on a per-API basis, and is set up in the API Object under the proxy
section of your API Definition:
enable_load_balancing: true,
service_discovery: {
use_discovery_service: true,
query_endpoint: "http://127.0.0.1:4001/v2/keys/services/multiobj",
use_nested_query: true,
parent_data_path: "node.value",
data_path: "array.hostname",
port_data_path: "array.port",
use_target_list: true,
cache_timeout: 10,
target_path: "/append-this-api-path/"
},
Settings are as follows:
service_discovery.use_discovery_service
: Set this totrue
to enable the discovery module.service_discovery.query_endpoint
: The endpoint to call, this would probably be your Consul, etcd or Eureka K/V store.service_discovery.data_path
: The namespace of the data path so, for example, if your service responds with:
{
"action": "get",
"node": {
"key": "/services/single",
"value": "http://httpbin.org:6000",
"modifiedIndex": 6,
"createdIndex": 6
}
}
Then your namespace would be node.value
.
service_discovery.use_nested_query
: Sometimes the data you are retrieving is nested in another JSON object, e.g. this is how etcd responds with a JSON object as a value key:
{
"action": "get",
"node": {
"key": "/services/single",
"value": "{"hostname": "http://httpbin.org", "port": "80"}",
"modifiedIndex": 6,
"createdIndex": 6
}
}
In this case, the data actually lives within this string-encoded JSON object, so in this case, you set the use_nested_query
to true
, and use a combination of the data_path
and parent_data_path
(below)
service_discovery.parent_data_path
: This is the namespace of the where to find the nested value, in the above example, it would benode.value
. You would then change thedata_path
setting to behostname
, since this is where the host name data resides in the JSON string. Tyk automatically assumes that thedata_path
in this case is in a string-encoded JSON object and will try to deserialise it.
Tyk will decode the JSON string and then apply the data_path
namespace to that object in order to find the value.
service_discovery.port_data_path
: In the above nested example, we can see that there is a separateport
value for the service in the nested JSON. In this case you can set theport_data_path
value and Tyk will treatdata_path
as the hostname and zip them together (this assumes that the hostname element does not end in a slash or resource identifier such as/widgets/
).
In the above example, the port_data_path
would be port
.
-
service_discovery.use_target_list
: If you are using load balancing, set this value totrue
and Tyk will treat the data path as a list and inject it into the target list of your API Definition. -
service_discovery.cache_timeout
: Tyk caches target data from a discovery service, in order to make this dynamic you can set a cache value when the data expires and new data is loaded. Setting it too low will cause Tyk to call the SD service too often, setting it too high could mean that failures are not recovered from quickly enough. -
service_discovery.target_path
: Use this setting to set a target path to append to the discovered endpoint, since many SD services only provide host and port data, it is important to be able to target a specific resource on that host, setting this value will enable that.
Service Discovery Examples
Mesosphere Example
For integrating service discovery with Mesosphere, you can use the following configuration parameters:
isNested = false
isTargetList = true
endpointReturnsList = false
portSeperate = true
dataPath = "host"
parentPath = "tasks"
portPath = "ports"
Eureka Example
For integrating service discovery with Eureka, you can use the following configuration parameters (this assumes that the endpoint will return JSON and not XML, this is achieved by creating an API Definition that injects the header that requests the data type and using this API Definition as the endpoint):
isNested = false
isTargetList = true
endpointReturnsList = false
portSeperate = true
dataPath = "hostName"
parentPath = "application.instance"
portPath = "port.$"
Etcd Example
For integrating with etcd, you can use the following configurations:
isNested = false
isTargetList = false
endpointReturnsList = false
portSeperate = false
dataPath = "node.value"
parentPath = ""
portPath = ""
Zookeeper Example
For this, you need to spin up a REST server that communicates with the Zookeeper instance. Here is one open source project, ZooREST, that does just that: https://github.com/Difrex/zoorest
With Zookeeper and ZooREST running, test the query endpoint. Don’t forget the +json
:
$ curl http://zoorest:8889/v1/get/zk_tyk+json
{
"data": {
"path": "httpbin.org"
},
"error": "",
"path": "/zk_tyk",
"state": "OK",
"zkstat": {}
}
Then, you can use the following Tyk SD configurations:
isNested = false
isTargetList = false
endpointReturnsList = false
portSeperate = false
dataPath = "data.path"
parentPath = ""
portPath = ""
Consul Example
For integrating service discovery with Consul, you can use the following configuration parameters:
isNested = false
isTargetList = true
endpointReturnsList = true
portSeperate = true
dataPath = "Address"
parentPath = ""
portPath = "ServicePort"
Linkerd Example
Note
This configuration is a Tyk Community Contribution.
To integrate Tyk with Linkerd perform the following:
Configure Linkerd
For integrating with Linkerd, you need to add the following configuration to your linkerd.yaml
file, located in the config/
directory:
routers:
- protocol: http
identifier:
kind: io.l5d.header.token
header: Custom-Header
Then, in your Tyk Dashboard:
-
Select your API from the System Management > APIs section and click Edit.
-
From the Core Settings tab, set the Target URL to the Linkerd http server
host:port
address. -
From the Endpoint Designer tab click Global Version Settings enter
Custom-Header
in the Add this header: field and the value of the Linkerdapp-id
in the Header value field. -
Click Update to save your changes.
This is needed since Tyk appends a “Host” header when proxying the request and the “Host” header is also the default header expected by Linkerd.
For further Linkerd information, see:
Linkerd - HTTP proxy documentation (Alternatives Section)
Linkered - Header Token Identifier documentation
The original Community Contribution
Conduct Uptime Tests
As of v1.9 Tyk supports a kind of built-in “uptime awareness” of the underlying services and hosts that it is managing traffic for by actively polling user-defined endpoints at set intervals.
Tyk uptime awareness is not meant to replace traditional uptime monitoring tools, in fact, it is designed to supplement them by offering a way to bypass unhealthy nodes when they are down as part of Tyk’s role as an API Gateway.
Compatibility
Uptime tests is only available for Tyk Self-Managed users. It is not available on Tyk Cloud.
How do the uptime tests work?
When uptime tests are added into a Tyk cluster, a single Gateway will elect itself as primary. Gateways remain as primary using a dead man’s switch, by keeping a key active in Redis. Primaries are re-elected or confirmed every few seconds. If one Gateway stops or fails, another can detect the failure and elect itself as the primary.
The primary Gateway will then run the uptime tests allocated to the cluster (shard group).
The Gateway running the uptime test will have a worker pool defined so that it can execute tests simultaneously every few seconds determined by a Gateway-configurable interval loop. Depending on how many uptime tests are being run, this worker pool should be increased or decreased as needed.
Initial configuration
To configure uptime tests, add the relevant section to your tyk.conf
:
"uptime_tests": {
"disable": false, // disable uptime tests on the node completely
"poller_group":"",
"config": {
"enable_uptime_analytics": true,
"failure_trigger_sample_size": 3,
"time_wait": 300,
"checker_pool_size": 50
}
}
disable
: When set tofalse
this tells Tyk to run uptime tests, if you do not want any uptime tests to run on a Gateway, set it totrue
and they will be disabled on those Gateways (this could be useful if you are running uptime tests in a separate group of Tyk instances).poller_group
: This field is used to define a different group of uptime tests. All the gateways that have the samepoller_group
, will be candidate to be elected as the primary Gateway of its group. This could be useful if you are running uptime tests in a segmented or sharded group of Tyk instances.enable_uptime_analytics
: Tyk supports the recording of the data that is generated by the uptime tests, these can then be tabulated in the dashboard. Set totrue
to enable uptime analytics. However, since uptime tests run constantly, they can generate large amounts of data, for some users who do not wish to manage this data, they can disable it by setting this value tofalse
.failure_trigger_sample_size
: Here we tell Tyk to trigger aHostDown
orHostUp
event after the test has failed or passed a set number of times;3
in this example. Setting the number to higher values can protect against false positives, but can increase lead incident time due to the verification.time_wait
: The number of seconds between running tests. In this example it is set to300
seconds.checker_pool_size
: The worker pool for uptime tests. In this example we have configured Tyk to keep50
idle workers in memory to send tests to, in other words, with this configuration, you are pretty much guaranteed asynchronous testing for up to 50 tests.
Configure with the API Definition
Uptime test check lists sit within API configurations, so in your API Definition add a section for the tests:
uptime_tests: {
check_list: [
{
"url": "http://google.com/"
},
{
"url": "http://posttestserver.com/post.php?dir=uptime-checker",
"method": "POST",
"headers": {
"this": "that",
"more": "beans"
},
"body": "VEhJUyBJUyBBIEJPRFkgT0JKRUNUIFRFWFQNCg0KTW9yZSBzdHVmZiBoZXJl"
}
]
},
Uptime tests are not versioned.
In the above example there are two forms for the Uptime test, a “quick” form, which assumes a GET request:
{
"url": "http://google.com/"
}
Or a long form, which allows for a full request to be checked or mocked:
{
"url": "http://posttestserver.com/post.php?dir=tyk-checker-target-test&beep=boop",
"method": "POST",
"headers": {
"this": "that",
"more": "beans"
},
"body": "VEhJUyBJUyBBIEJPRFkgT0JKRUNUIFRFWFQNCg0KTW9yZSBzdHVmZiBoZXJl",
"timeout": 1000
}
body
: Thebody
is Base64 encoded.timeout
: Thetimeout
in milli seconds.
Configure with the Dashboard
To add an uptime test using the dashboard is very simple. Make sure that you have fulfilled the prerequisite configuration in your Gateway to enable the tester.
Step 1: Select the Uptime Tests tab
From the API Designer select the Uptime Tests tab:
Step 2: Click Add
Click Add to add a test:
Step 3: Enter Path Details
From the Path Details pop-up, complete the details and click Add to add the test:
Events
Uptime and downtime events
When Tyk detects downtime on a test, it will trigger a system event called HostDown
, when that host returns to service, it will trigger HostUp
. These events are triggered in the same event system as other Tyk Events, and therefore can have any kind of action performed:
- A logger action
- A web hook to a notification URL
- A custom JS script for complex API interactions
Please see the section on the event system on how to add event handlers to your API Definition.
Since tests are on a URL-by-URL basis, you could potentially see multiple HostDown
events for a single host where multiple endpoints are being tested.
Load balancing and Service Discovery
Downtime detection and service availability
If you have configured Tyk to use round-robin load balancing, you can enable an option in the proxy
section of your API Definition that will check the hostname of the outbound Tyk request (to your service) against the downtime list to see if the server is active, if the host is marked as “down” Tyk will skip to the next host in its list before making the request:
Note, the fully qualified host, including the port, needs to be exactly the same between the uptime test config and the RRLB entry in order for Tyk to link the two together.
ie: www.myapi.com:3000
...
"proxy": {
...
"check_host_against_uptime_tests": true,
...
}
...
Manage Multi-Environment and Distributed Setups
Store Configuration with Key-Value Store
Using external Key Value storage with Tyk
With Tyk Gateway you can store configuration data (typically authentication secrets or upstream server locations) in Key-Value (KV) systems such as Vault, and Consul and then reference these values during configuration of the Tyk Gateway or APIs deployed on the Gateway.
When to use external Key-Value storage
Simplify migration of APIs between environments
Easily manage and update secrets and other configuration across multiple environments (e.g., development, staging, production) without modifying the configuration files.
Ensure separation of concerns
Securely store sensitive information like API keys, passwords, and certificates in a centralised location. Not everybody needs access to these secrets: authorized people can maintain them and just pass along the reference used to access them from the KV store.
Support per-machine variables
Storing local settings within the Tyk Gateway’s configuration file allows you to have per instance variables, such as a machine ID, and inject these into API requests and responses using transformation middleware.
How external Key-Value storage works
There are two parts to external Key-Value storage - the KV store and the Tyk configuration object (API definition or Tyk Gateway config file).
- The key-value data that you wish to reference should be added to the storage
- References should be included within the Tyk configuration object that identify the location (KV store) and Key
- When Tyk Gateway initialises it will resolve any external KV references in its configuration, retrieving and applying the values from those references
- When Tyk Gateway loads (or reloads) APIs it will resolve any external KV references in the API definitions, retrieving and applying the values from those references
Most Key-Value references are only retrieved when the configuration object (Gateway or API) is loaded, as explained above: changes to the externally stored value will not be detected until a subsequent gateway hot-reload.
The exception to this is for specific transformation middleware where the value will be retrieved for each call to the API, during the processing of the API request or response.
Note
If Tyk Gateway cannot communicate with the KV store, it will log an error and will treat the referenced key value as empty, continuing to load the Gateway or API, or to process the transformation middleware as appropriate.
Supported storage options
Tyk Gateway supports the following locations for storage of key-value data, providing flexibility to choose the most suitable approach for your deployment and the data you are storing:
Consul
HashiCorp Consul is a service networking solution that is used to connect and configure applications across dynamic, distributed infrastructure. Consul KV is a simple Key-Value store provided as a core feature of Consul that can be used to store and retrieve Tyk Gateway configuration across multiple data centers.
- to retrieve the value assigned to a
KEY
in Consul you will useconsul://KEY
or$secret_consul.KEY
notation depending on the location of the reference
Vault
Vault from Hashicorp is a tool for securely accessing secrets. It provides a unified interface to any secret while providing tight access control and recording a detailed audit log. Tyk Gateway can use Vault to manage and retrieve sensitive secrets such as API keys and passwords.
- to retrieve the value assigned to a
KEY
in Vault you will usevault://KEY
or$secret_vault.KEY
notation depending on the location of the reference
Tyk Gateway config file
The secrets
section in the Tyk Gateway configuration file allows you to store settings that are specific to a single Tyk Gateway instance. This is useful for storing instance-specific configuration to be injected into API middleware or if you prefer using configuration files.
- to retrieve the value assigned to a
KEY
in thesecrets
config you will usesecrets://KEY
or$secret_conf.KEY
notation depending on the location of the reference
Environment variables
Tyk Gateway can access data declared in environment variables. This is a simple and straightforward way to manage secrets, especially in containerised environments like Docker or Kubernetes.
- if you want to set the local “secrets” section (equivalent to the
secrets
section in the Gateway config file) using environment variables, you should use the following notation:TYK_GW_SECRETS=key:value,key2:value2
- if you’re using a different key value secret store not explicitly supported by Tyk but can map it to
TYK_GW_SECRETS
then this will allow you to access those KV data - to retrieve the value assigned to an environment variable
VAR_NAME
you will useenv://VAR_NAME
or$secret_env.VAR_NAME
notation depending on the location of the reference
How to access the externally stored data
You can configure Tyk Gateway to retrieve values from KV stores in the following places:
- Tyk Gateway configuration file (
tyk.conf
) - API definitions
Note
You can use keys from different KV stores (e.g. Consul and environment variables) in the same configuration object (Gateway config or API definition).
From the Tyk Gateway configuration file
In Tyk Gateway’s configuration file (tyk.conf
), you can retrieve values from KV stores for the following fields:
secret
node_secret
storage.password
cache_storage.password
security.private_certificate_encoding_secret
db_app_conf_options.connection_string
policies.policy_connection_string
To reference the Value assigned to a Key in one of the KV stores from the Gateway configuration file use the following notation:
- Consul:
consul://path/to/key
- Vault:
vault://path/to/secret.key
tyk.conf
secrets:secrets://key
- Environment variables:
env://key
For example, if you create a Key-Value pair in Vault with the key shared-secret
in secret gateway-dashboard
within directory tyk-secrets/
then you could use the Value as the node_secret
in your Gateway config by including the following in your tyk.conf
file:
{
"node_secret":"vault://tyk-secrets/gateway-dashboard.shared-secret"
}
When the Gateway starts, Tyk will read the Value from Vault and use this as the node_secret
, which is used to secure connection to the Tyk Dashboard.
Note that all of these references are read (and replaced with the values read from the KV location) on Gateway start when loading the tyk.conf
file.
From API Definitions
From Tyk Gateway v5.3.0 onwards, you can store any string field from the API definition in any of the supported KV storage options; for earlier versions of Tyk Gateway only the Target URL and Listen Path fields and certain transformation middleware configurations were supported.
Target URL and Listen Path
To reference the Value assigned to a Key in one of the KV stores for Target URL or Listen Path use the following notation:
- Consul:
consul://path/to/key
- Vault:
vault://path/to/secret.key
- Tyk config secrets:
secrets://key
- Environment variables:
env://key
These references are read (and replaced with the values read from the KV location) when the API is loaded to the Gateway (either when Gateway restarts or when there is a hot-reload).
For example, if you define an environment variable (Key) UPSTREAM_SERVER_URL
with the Value http://httpbin.org/
then within your API definition you could use the Value for the Target URL for your Tyk OAS API as follows:
{
"x-tyk-api-gateway": {
"upstream": {
"url": "env://UPSTREAM_SERVER_URL"
}
}
}
When the Gateway starts, Tyk will read the Value from the environment variable and use this as the Target URL.
Note
Prior to Tyk Gateway v5.3.0, environment variables used for the Target URL or Listen Path had to be named TYK_SECRET_{KEY_NAME}
. They were referred to in the API definition using env://{KEY_NAME}
excluding the TYK_SECRET_
prefix.
From v5.3.0 onward, environment variables can have any KEY_NAME
, and the full name should be provided in the API definition reference. The pre-v5.3.0 naming convention is still supported for backward compatibility, but only for these two fields.
Transformation middleware
Key-value references can be included in the following middleware, with the values retrieved dynamically when the middleware is called (during processing of an API request or response):
- request body transform
- request header transform
- URL rewrite
- response body transform
- response header transform
To reference the Value assigned to a Key in one of the KV stores from these middleware use the following notation:
- Consul:
$secret_consul.key
- Vault:
$secret_vault.key
- Tyk config secrets:
$secret_conf.key
- Environment variables:
$secret_env.key
orenv://key
(see here)
This notation is used to avoid ambiguity in the middleware parsing (for example where a KV secret is used in a URL rewrite path).
For example, if you create a Key-Value pair in Consul with the Key user_id
then you could use the Value in the rewriteTo
upstream address in the URL rewrite middleware for your Tyk OAS API by including the following in your API definition:
{
"x-tyk-api-gateway": {
"middleware": {
"operations": {
"anythingget": {
"urlRewrite": {
"enabled": true,
"pattern": ".*",
"rewriteTo": "/api/v1/users/$secret_consul.user_id",
}
}
}
}
}
}
When a call is made to GET /anything
, Tyk will retrieve the Value assigned to the user_id
Key in Consul and rewrite the Target URL for the request to /api/v1/users/{user_id}
.
These references are read (and replaced with the values read from the KV location) during the processing of the API request or response.
Using environment variables with transformation middleware
There are some subtleties with the use of environment variables as KV storage for the transformation middleware.
- Request and Response Body Transforms support only the
$secret_env.{KEY_NAME}
format. - Request and Response Header Transforms support both
env://{KEY_NAME}
and$secret_env.{KEY_NAME}
formats. - URL Rewrite supports the
env://{KEY_NAME}
format for both thepattern
andrewriteTo
fields. TherewriteTo
field also supports$secret_env.{KEY_NAME}
format.
Notes
Due to the way that Tyk Gateway processes the API definition, when you use transformation middleware with the $secret_env
format, it expects the environment variable to be named TYK_SECRET_{KEY_NAME}
and to be referenced from the API definition using $secret_env.{KEY_NAME}
.
For example, if you create a Gateway environment variable TYK_SECRET_NEW_UPSTREAM=http://new.upstream.com
, then in a request body transform middleware, you would reference it as follows:
{
"custom_url": "$secret_env.NEW_UPSTREAM"
}
To configure the URL rewrite rewriteTo
field using this variable you could use either:
{
"rewriteTo": "env://TYK_SECRET_NEW_UPSTREAM"
}
or
{
"rewriteTo": "$secret_env.NEW_UPSTREAM"
}
Other string
fields
To reference the Value assigned to a Key in one of the KV stores from the API Definition use the following notation:
- Consul:
consul://key
- Vault:
vault://secret.key
- Tyk config secrets:
secrets://key
- Environment variables:
env://key
These references are read (and replaced with the values read from the KV location) when the API is loaded to the Gateway (either when Gateway restarts or when there is a hot-reload).
Notes
When accessing KV references from the /tyk-apis
directory on Consul or Vault, you should not provide the path/to/
the key except for Target URL and Listen Path (as described above).
For example, if you create a Key-Value pair in the secrets
section of the tyk.conf
file with the Key auth_header_name
:
{
"secrets": {
"auth_header_name": "Authorization"
}
}
Then within your API definition you could use the Value for the authentication header name as follows:
{
"x-tyk-api-gateway": {
"components": {
"securitySchemes": {
"authToken": {
"type": "apiKey",
"in": "header",
"name": "secrets://auth_header_name"
}
}
}
}
}
When the Gateway starts, Tyk will read the Value from the secrets
section in the Gateway config file and use this to identify the header where Tyk Gateway should look for the Authentication token in requests to your Tyk OAS API.
Using Consul as a KV store
HashiCorp Consul is a service networking solution that is used to connect and configure applications across dynamic, distributed infrastructure. Consul KV is a simple Key-Value (KV) store provided as a core feature of Consul that can be used to store and retrieve Tyk Gateway configuration across multiple data centers.
How to configure Tyk to access Consul
Configuring Tyk Gateway to read values from Consul is straightforward - you simply configure the connection in your Tyk Gateway config file (tyk.conf
) by adding the kv
section as follows:
{
"kv": {
"consul": {
"address": "localhost:8025",
"scheme": "http",
"datacenter": "dc-1",
"http_auth": {
"username": "",
"password": ""
},
"wait_time": 10,
"token": "",
"tls_config": {
"address": "",
"ca_path": "",
"ca_file": "",
"cert_file": "",
"key_file": "",
"insecure_skip_verify": false
}
}
}
}
Key | Description |
---|---|
address | The location of the Consul server |
scheme | The URI scheme for the Consul server, e.g. http |
datacenter | Consul datacenter (agent) identifier |
http_auth | Username and password for Tyk to log into Consul using HTTP Basic Auth (if required by your Consul service) |
wait_time | Limits how long a watch will block in milliseconds (if enabled in your Consul service) |
token | Used to provide a per-request access token to Consul (if required by your Consul service) |
tls_config | Configuration for TLS connection to Consul (if enabled in your Consul service) |
Alternatively, you can configure it using the equivalent environment variables.
Where to store data in Consul
When you want to reference KV data from Tyk Gateway config or transform middleware, you can store your KV pairs wherever you like within the Consul KV store. You can provide the Consul path to the key in the reference using the notation appropriate to the calling location.
From Tyk Gateway 5.3.0, you can reference KV data from any string
field in the API definition. For these you should create a folder named tyk-apis
in the root of your Consul KV store and store all keys in a flat structure there (sub-directories not currently supported). You should not include the tyk-apis
path in the reference so, for example, given a key-value pair "foo":"bar"
stored in tyk-apis
in Consul, you would reference this from the API definition using consul://foo
.
How to access data stored in Consul
The notation used to refer to a KV pair stored in Consul depends upon the location of the reference as follows.
Tyk Gateway configuration file
As described here, from Tyk Gateway’s configuration file (tyk.conf
) you can retrieve values from Consul using the following notation:
consul://path/to/KEY
API definition
The Target URL and Listen Path key-value pairs can be stored in any directory in the Consul KV store as they are accessed using a different mechanism than other fields in the API definition. If storing these in a sub-directory, you can retrieve the values from Consul by providing the directory path within Consul KV using the following notation:
consul://path/to/KEY
For certain transformation middleware because the secret resolution happens during the request context, a different notation is used to retrieve values from Consul:
$secret_consul.KEY
From Tyk Gateway v5.3.0 onwards, you can store KV pairs to be used in any string
field in the API definition in the Consul KV store. You can retrieve these values from Consul, noting that you do not provide the directory path (/tyk-apis
) when accessing data for these fields, using the following notation:
consul://KEY
Using Vault as a KV store
Vault from Hashicorp is a tool for securely accessing secrets. It provides a unified interface to any secret while providing tight access control and recording a detailed audit log. Tyk Gateway can use Vault to manage and retrieve sensitive secrets such as API keys and passwords.
How to configure Tyk to access Vault
Configuring Tyk Gateway to read values from Vault is straightforward - you simply configure the connection in your Tyk Gateway config file (tyk.conf
) by adding the kv
section as follows:
{
"kv": {
"vault": {
"address": "http://localhost:1023",
"agent_address": "",
"max_retries": 3,
"timeout": 30,
"token": "",
"kv_version": 2
}
}
}
Key | Description |
---|---|
address | The address of the Vault server, which must be a complete URL such as http://www.vault.example.com |
agent_address | The address of the local Vault agent, if different from the Vault server, must be a complete URL |
max_retries | The maximum number of attempts Tyk will make to retrieve the value if Vault returns an error |
timeout | The maximum time that Tyk will wait for a response from Vault (in nanoseconds, if set to 0 (default) will be interpreted as 60 seconds) |
token | The Vault root access token |
kv_version | The version number of Vault, usually defaults to 2 |
Alternatively, you can configure it using the equivalent environment variables.
How key-value data is stored in Vault
In traditional systems secrets are typically stored individually, each with their own unique key. Vault, however, allows for a more flexible approach where multiple keys can be grouped together and stored under a single secret. This grouping allows for better organization and management of related secrets, making it easier to retrieve and manage them collectively.
When retrieving data from Vault, you use the dot notation (secret.key
) to access the value from a specific key within a secret.
Example of storing key value data in Vault
If you want to store a secret named tyk
with a key gw
and value 123
in Vault then, from the command line, you would:
- Enable the
kv
secrets engine in Vault under the pathmy-secret
using:
vault secrets enable -version=2 -path=my-secret kv
- Create a secret
tyk
with the keygw
and value123
in Vault:
vault kv put my-secret/tyk gw=123
To retrieve the secret from Vault using the command line you would use the following command (there is no need to append /data
to the secret path):
curl \
--header "X-Vault-Token: <your_vault_token>" \
--request GET \
https://vault-server.example.com/v1/my-secret/tyk?lease=true
This would return a response along these lines, note that the response contains all the keys stored in the secret (here there are also keys called excited
and foo
):
{
"request_id": "0c7e44e1-b71d-2102-5349-b5c60c13fb02",
"lease_id": "",
"lease_duration": 0,
"renewable": false,
"data": {
"gw": "123",
"excited": "yes",
"foo": "world",
},
"metadata":{
"created_time": "2019-08-28T14:18:44.477126Z",
"deletion_time": "",
"destroyed": false,
"version": 1
},
"auth": ...
}
As explained below, you could retrieve this value from within your Tyk Gateway config file using:
TYK_GW_SECRET=vault://my-secret/tyk.gw
Where to store data in Vault
When you want to reference KV data from Tyk Gateway config or transform middleware, you can store your Vault secrets wherever you like within the KV store. You can provide the Vault path to the key in the reference using the notation appropriate to the calling location.
From Tyk Gateway 5.3.0, you can reference KV data from any string
field in the API definition. For these you should create a folder named tyk-apis
in the root of your Vault KV store and store all secrets in a flat structure there (sub-directories not currently supported). You should not include the tyk-apis
path in the reference so, for example, given a key-value pair "foo":"bar"
stored in a secret named my-secret
in /tyk-apis
in Vault, you would reference this from the API definition using vault://my-secret.foo
.
How to access data stored in Vault
The notation used to refer to a key-value pair stored in Vault depends upon the location of the reference as follows.
Tyk Gateway configuration file
As described here, from Tyk Gateway’s configuration file (tyk.conf
) you can retrieve values from Vault using the following notation:
vault://path/to/secret.KEY
API definition
The Target URL and Listen Path key-value pairs can be stored in any directory in the Vault KV store as they are accessed using a different mechanism than other fields in the API definition. If storing these in a sub-directory, you can retrieve the values from Vault by providing the directory path within Consul KV using the following notation:
vault://path/to/secret.KEY
For certain transformation middleware because the secret resolution happens during the request context, a different notation is used to retrieve values from Vault:
$secret_vault.KEY
From Tyk Gateway v5.3.0 onwards, you can store KV pairs to be used in any string
field in the API definition in the Vault KV store. You can retrieve these values from Vault, noting that you do not provide the directory path (/tyk-apis
) when accessing data for these fields, using the following notation:
vault://KEY
Monitor and Observe Your Setup
A common question that gets asked is how to monitor the Tyk components.
Tyk Gateway
The Gateway & Redis are the only components that will have a high on-demand performance requirement, which needs to scale with your API traffic.
Tyk Gateway CPU Utilization
Tyk Gateway is CPU bound. It will have better performance the more cores you throw at Tyk. Tyk will automatically spread itself across all available cores to handle the traffic. Be sure to limit the cores in a Kubernetes deployment otherwise, the Gateway will attempt to consume all cores in a node.
Performance benchmarks on how Tyk performs across different CPU architectures, environments and sizes here.
A healthy and performant Tyk Gateway should have a CPU utilization of under 60%. If the average CPU utilization is above 60%, then we recommend you scale your Tyk Gateway services. A higher figure than 60% introduces risk because if one Gateway fails, the traffic spillover to healthy nodes might be overwhelming and result in a cascading failure.
Liveness Health Check
Health checks are extremely important in determining the status of our Tyk Components. Depending on your setup and configuration, the statuses of the following components will be returned: Gateway, Dashboard, Redis and RPC.
The health check endpoint is an expensive operation and can throttle throughput so it’s important to find an optimal plan if you want to take advantage of this endpoint. The endpoint refreshes every 10 seconds and does not return statuses on the primary database (MongoDB or PostgreSQL) and the Tyk Pump component.
curl -X GET "http://localhost:8080/hello"
{
"status": "pass",
"version": "4.2.3",
"description": "Tyk GW",
"details": {
"dashboard": {
"status": "pass",
"componentType": "system",
"time": "2022-11-21T20:03:44Z"
},
"redis": {
"status": "pass",
"componentType": "datastore",
"time": "2022-11-21T20:03:44Z"
},
"rpc": {
"status": "pass",
"componentType": "system",
"time": "2022-11-21T20:03:44Z"
}
}
}
For information about our health check endpoint, please visit our Liveness Health Check documentation.
Tyk Dashboard & Tyk MDCB
These other Tyk components won’t see load proportional to your API requests. However, the Dashboard (and MDCB on Global deployments) synchronise the Gateways and need to be given enough resources to manage this process.
The Tyk Dashboard liveness health check endpoint can be configured here.
The Tyk MDCB liveness health check endpoint can be configured here.
Currently, Tyk Dashboard and MDCB liveness endpoints only report whether the service is operational. It is important to note that the service may not yet be ready for use if it is unable to establish a connection with its dependent components (such as Redis and Datastore) or if they are offline.
Tyk Pump
The Tyk Pump component offers a built-in Liveness Health Check endpoint here.
Currently, the receipt of an HTTP 200 OK response merely indicates that the Pump service is operational. However, it is important to note that the service may not yet be ready for use if it is unable to establish a connection with its dependent components (such as Redis and Datastore) or if they are offline.
Database Sizing
Based on the Tyk recommended approach for setting up your databases, our team has built tools that will help engineers better understand and plan their infrastructure around their use case:
Database Monitoring
Monitoring guides from our partner:
Redis
Postgres
- Key metrics for PostgreSQL monitoring
- Collecting metrics with PostgreSQL monitoring tools
- How to collect and monitor PostgreSQL data with Datadog
Mongo