
Documentation Index

Fetch the complete documentation index at: https://tyk.io/docs/llms.txt

Use this file to discover all available pages before exploring further.

This guide explains how to set up Elasticsearch to ingest OpenTelemetry traces via the OpenTelemetry Collector (OTel Collector).

Prerequisites

Ensure the following prerequisites are met before proceeding:
  • Tyk Gateway v5.2 or higher
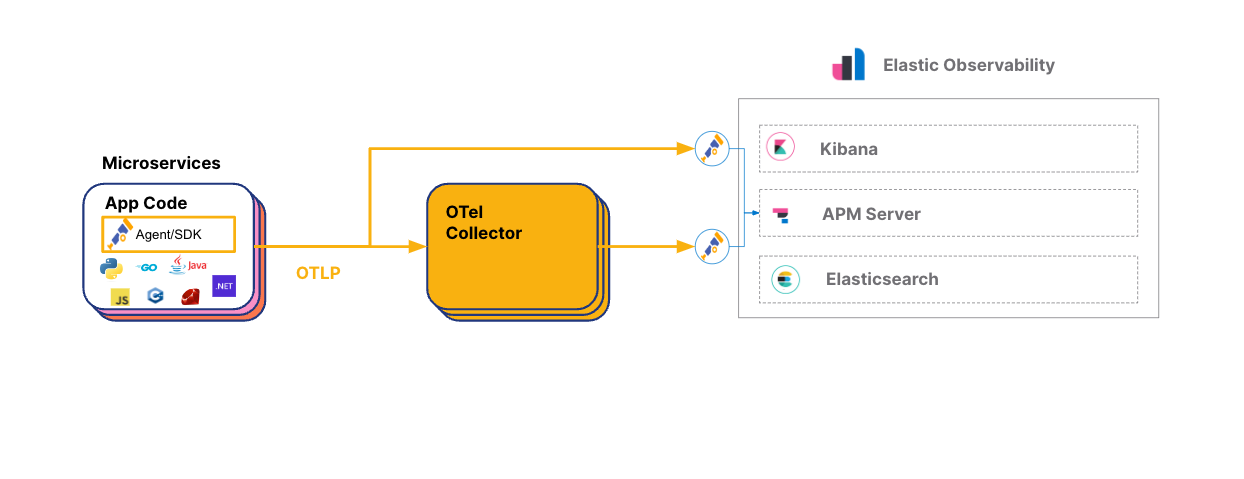
  • OpenTelemetry Collector deployed locally
  • Elasticsearch deployed locally or an account on Elastic Cloud with Elastic APM
Elastic Observability natively supports OpenTelemetry and its OpenTelemetry protocol (OTLP) to ingest traces, metrics, and logs. OpenTelemetry support in Elasticsearch Credit: Elasticsearch, OpenTelemetry on Elastic

Steps for Configuration

Step 1. Configure Tyk Gateway

To enable OpenTelemetry when using Tyk Helm Charts add the following configuration to the Tyk Gateway section:
tyk-gateway:
  gateway:
    opentelemetry:
      enabled: true
      endpoint: {{Add your endpoint here}}
      exporter: grpc
To enable OpenTelemetry when using Docker Compose add the following environment variables to your docker-compose.yml file for Tyk Gateway:
environment:
  - TYK_GW_OPENTELEMETRY_ENABLED=true
  - TYK_GW_OPENTELEMETRY_EXPORTER=grpc
  - TYK_GW_OPENTELEMETRY_ENDPOINT={{Add your endpoint here}}
For both deployment types, make sure to replace <Add your endpoint here> with the appropriate endpoint from your OpenTelemetry collector.
After enabling OpenTelemetry for the Gateway, you can activate detailed tracing for specific APIs in their respective API definitions. Detailed tracing is not enabled by default so you will need to set the detailed_tracing option to true to collect detailed traces.

Step 2. Configure the OpenTelemetry Collector to Export to Elasticsearch

To configure the OTel Collector with Elasticsearch Cloud, follow these steps:
  1. Sign up for an Elastic account if you haven’t already
  2. Once logged in to your Elastic account, select Observability and click on the option Monitor my application performance
Configure Elasticsearch
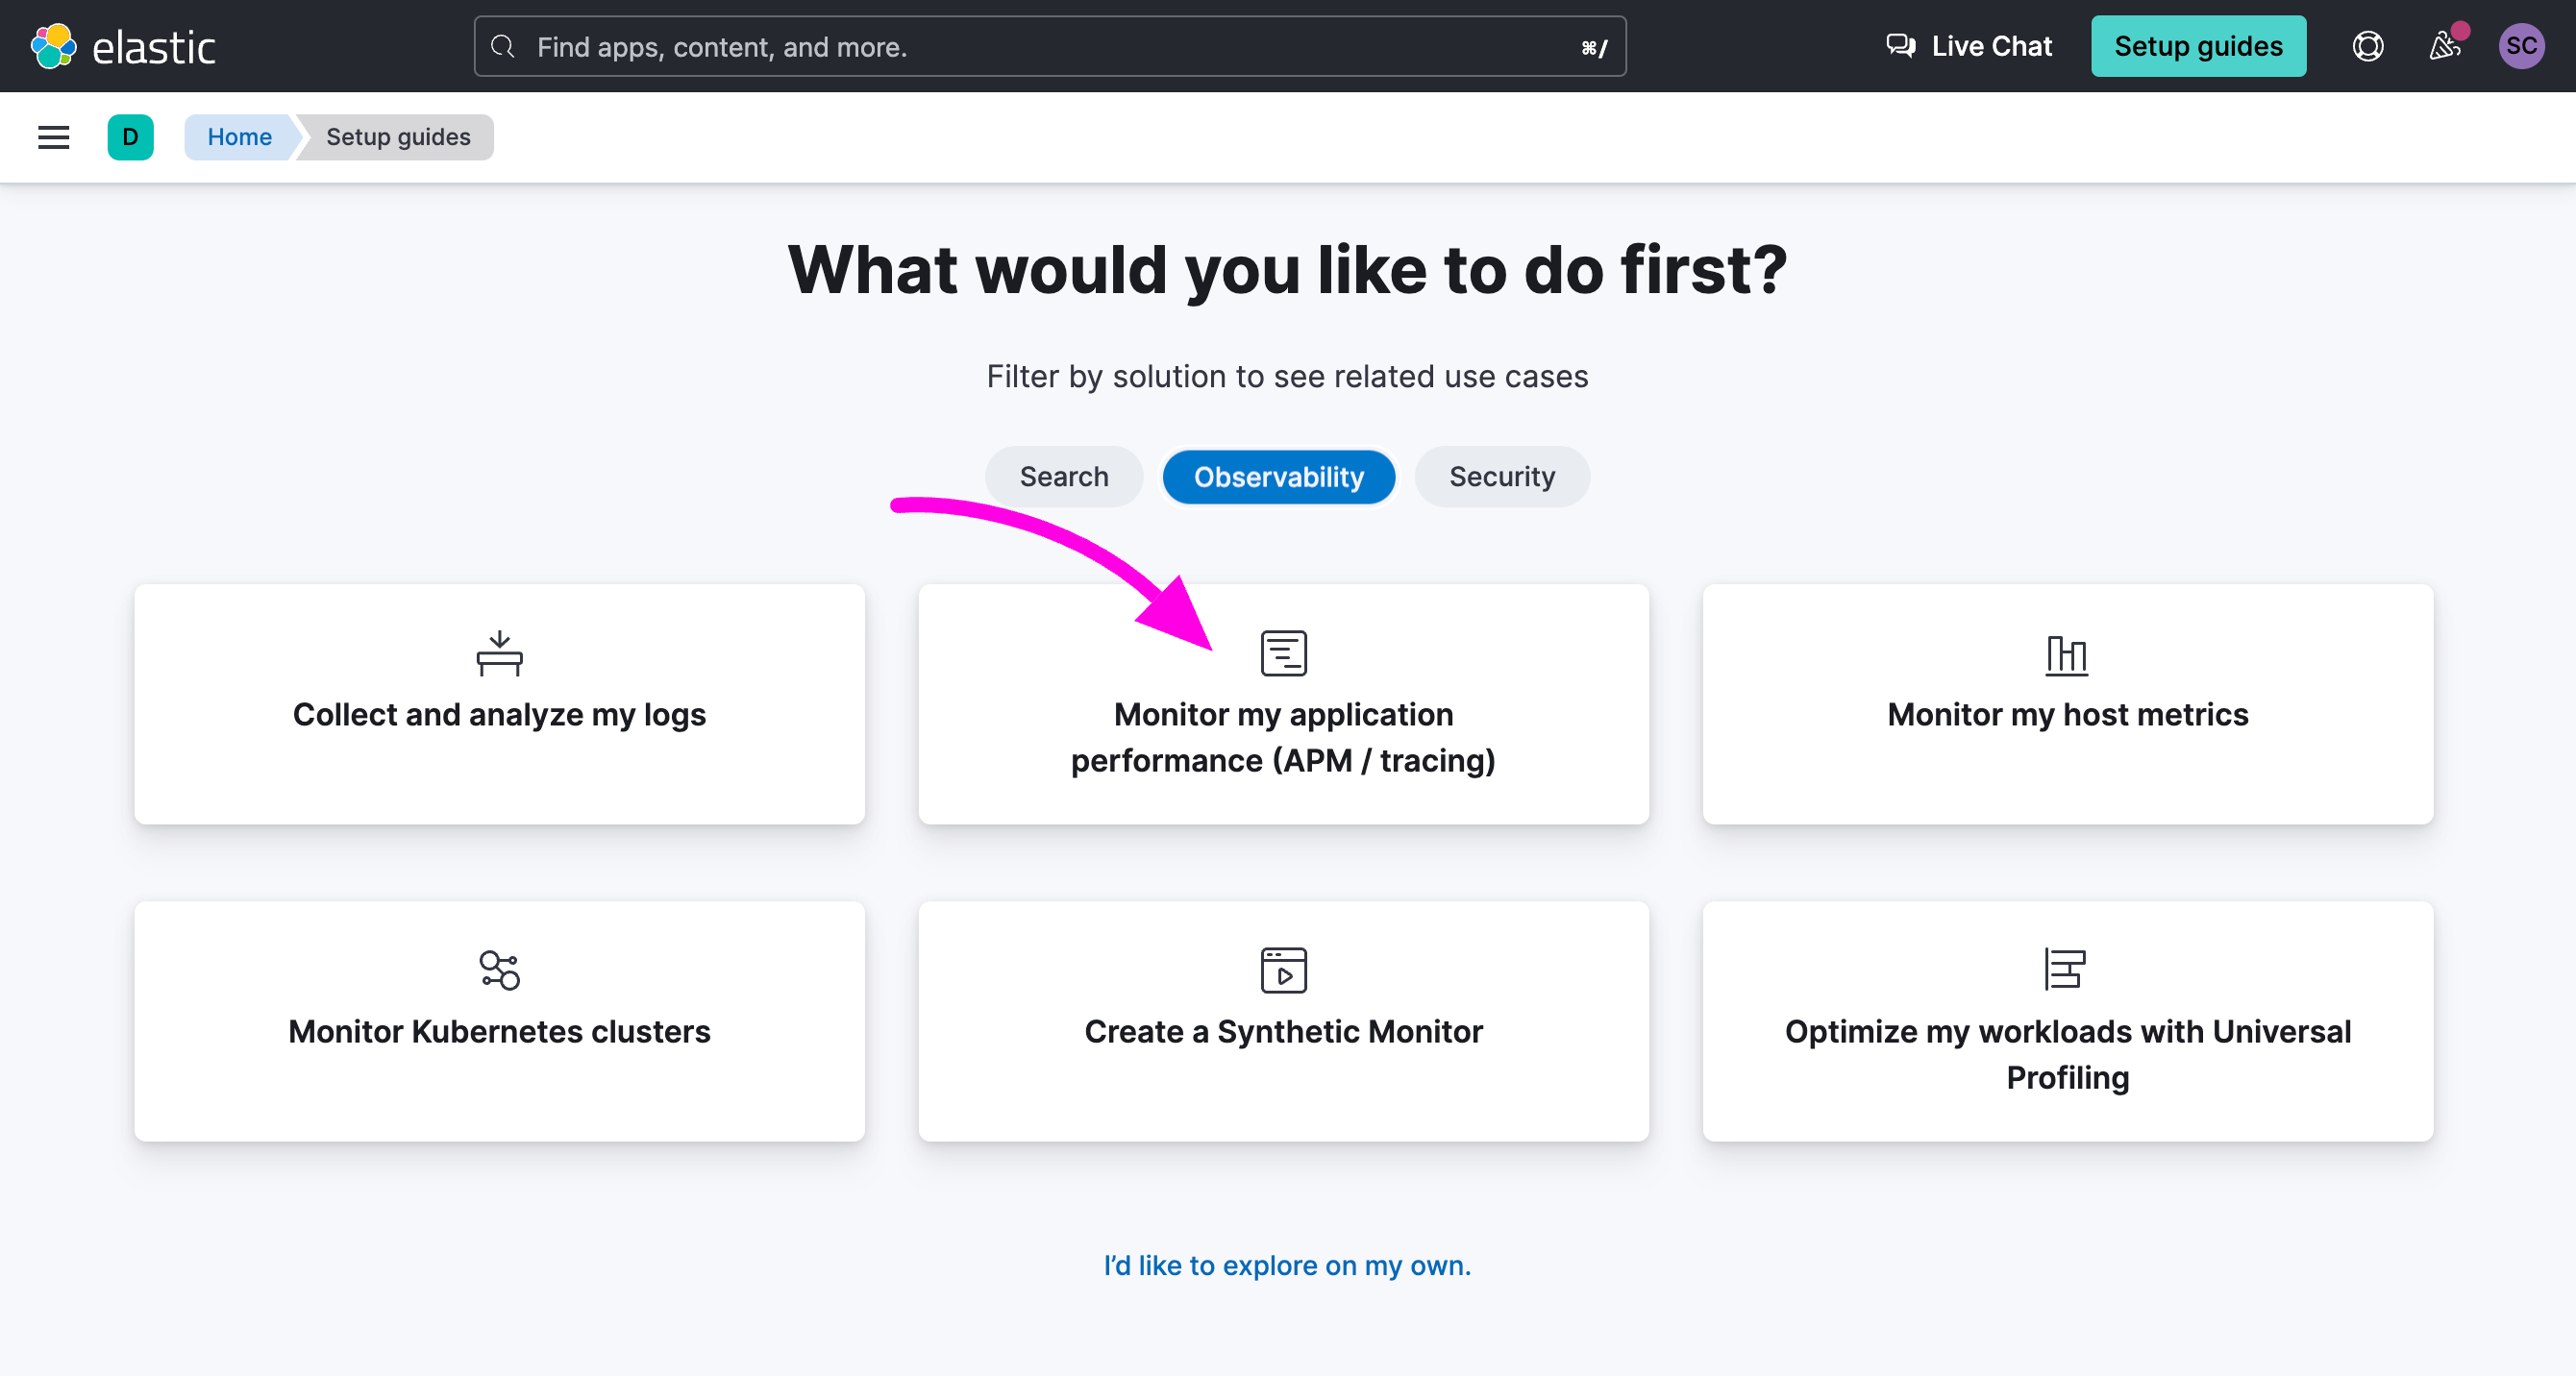
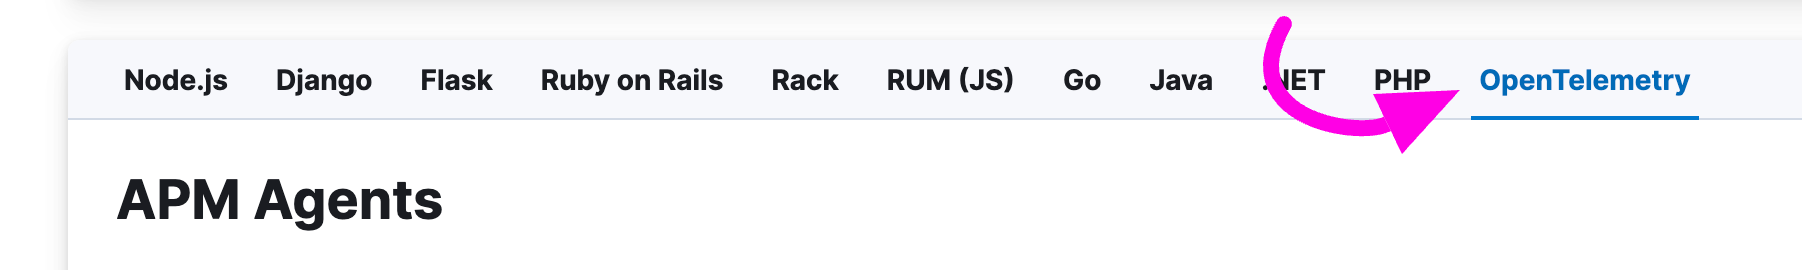
  1. Scroll down to the APM Agents section and click on the OpenTelemetry tab
Configure Elasticsearch
  1. Search for the section Configure OpenTelemetry in your application” You will need to copy the value of OTEL_EXPORTER_OTLP_ENDPOINT and OTEL_EXPORTER_OTLP_HEADERS in your OpenTelemetry Collector configuration file.
Configure Elasticsearch
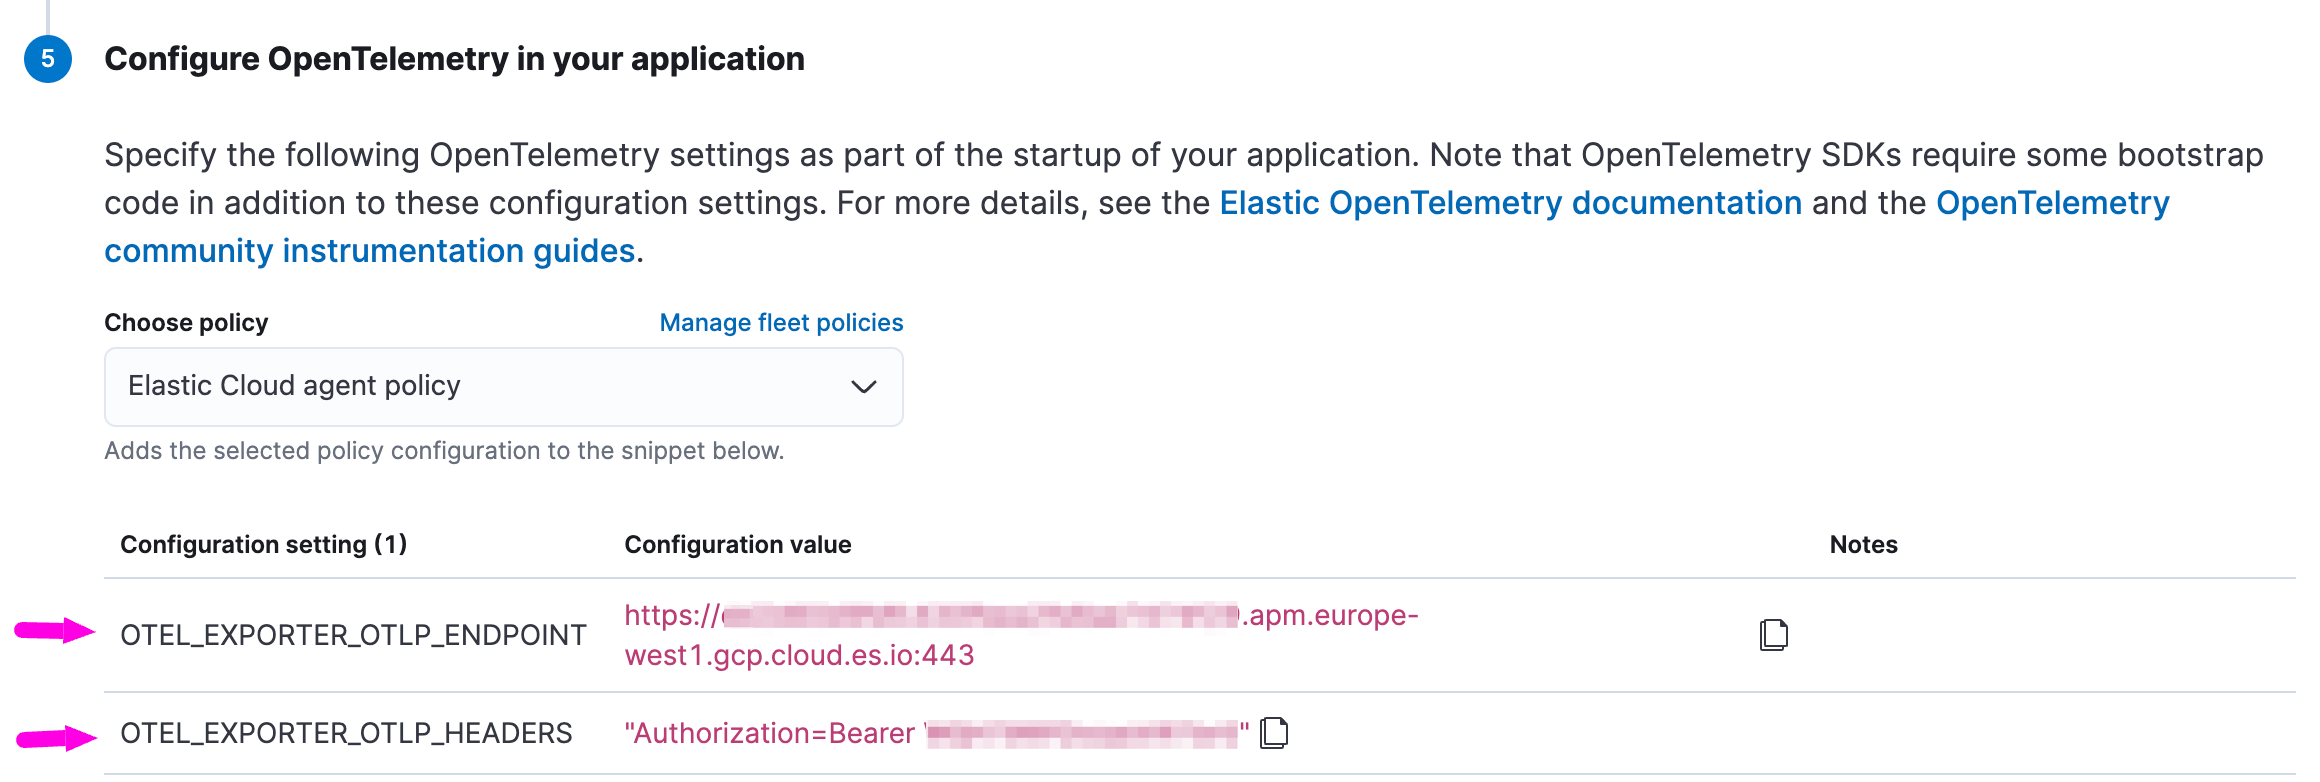
  1. Update your OpenTelemetry Collector configuration, here’s a simple example:
receivers:
  otlp:
    protocols:
      grpc:
        endpoint: 0.0.0.0:4317 # OpenTelemetry receiver endpoint
processors:
  batch:
exporters:
otlp/elastic:
    endpoint: "ELASTIC_APM_SERVER_ENDPOINT_GOES_HERE" #exclude scheme, e.g. HTTPS:// or HTTP://
    headers:
      # Elastic APM Server secret token
      Authorization: "Bearer ELASTIC_APM_SECRET_TOKEN_GOES_HERE"
service:
  pipelines:
    traces:
      receivers: [otlp]
      exporters: [otlp/elastic]
If are running Elasticsearch locally, you will need to use your APM Server endpoint (elastic-apm-server:8200) and set up a secret token authorization in ElasticSearch. You can refer to the example configuration provided by Elastic for more guidance on the OpenTelemetry Collector configuration.

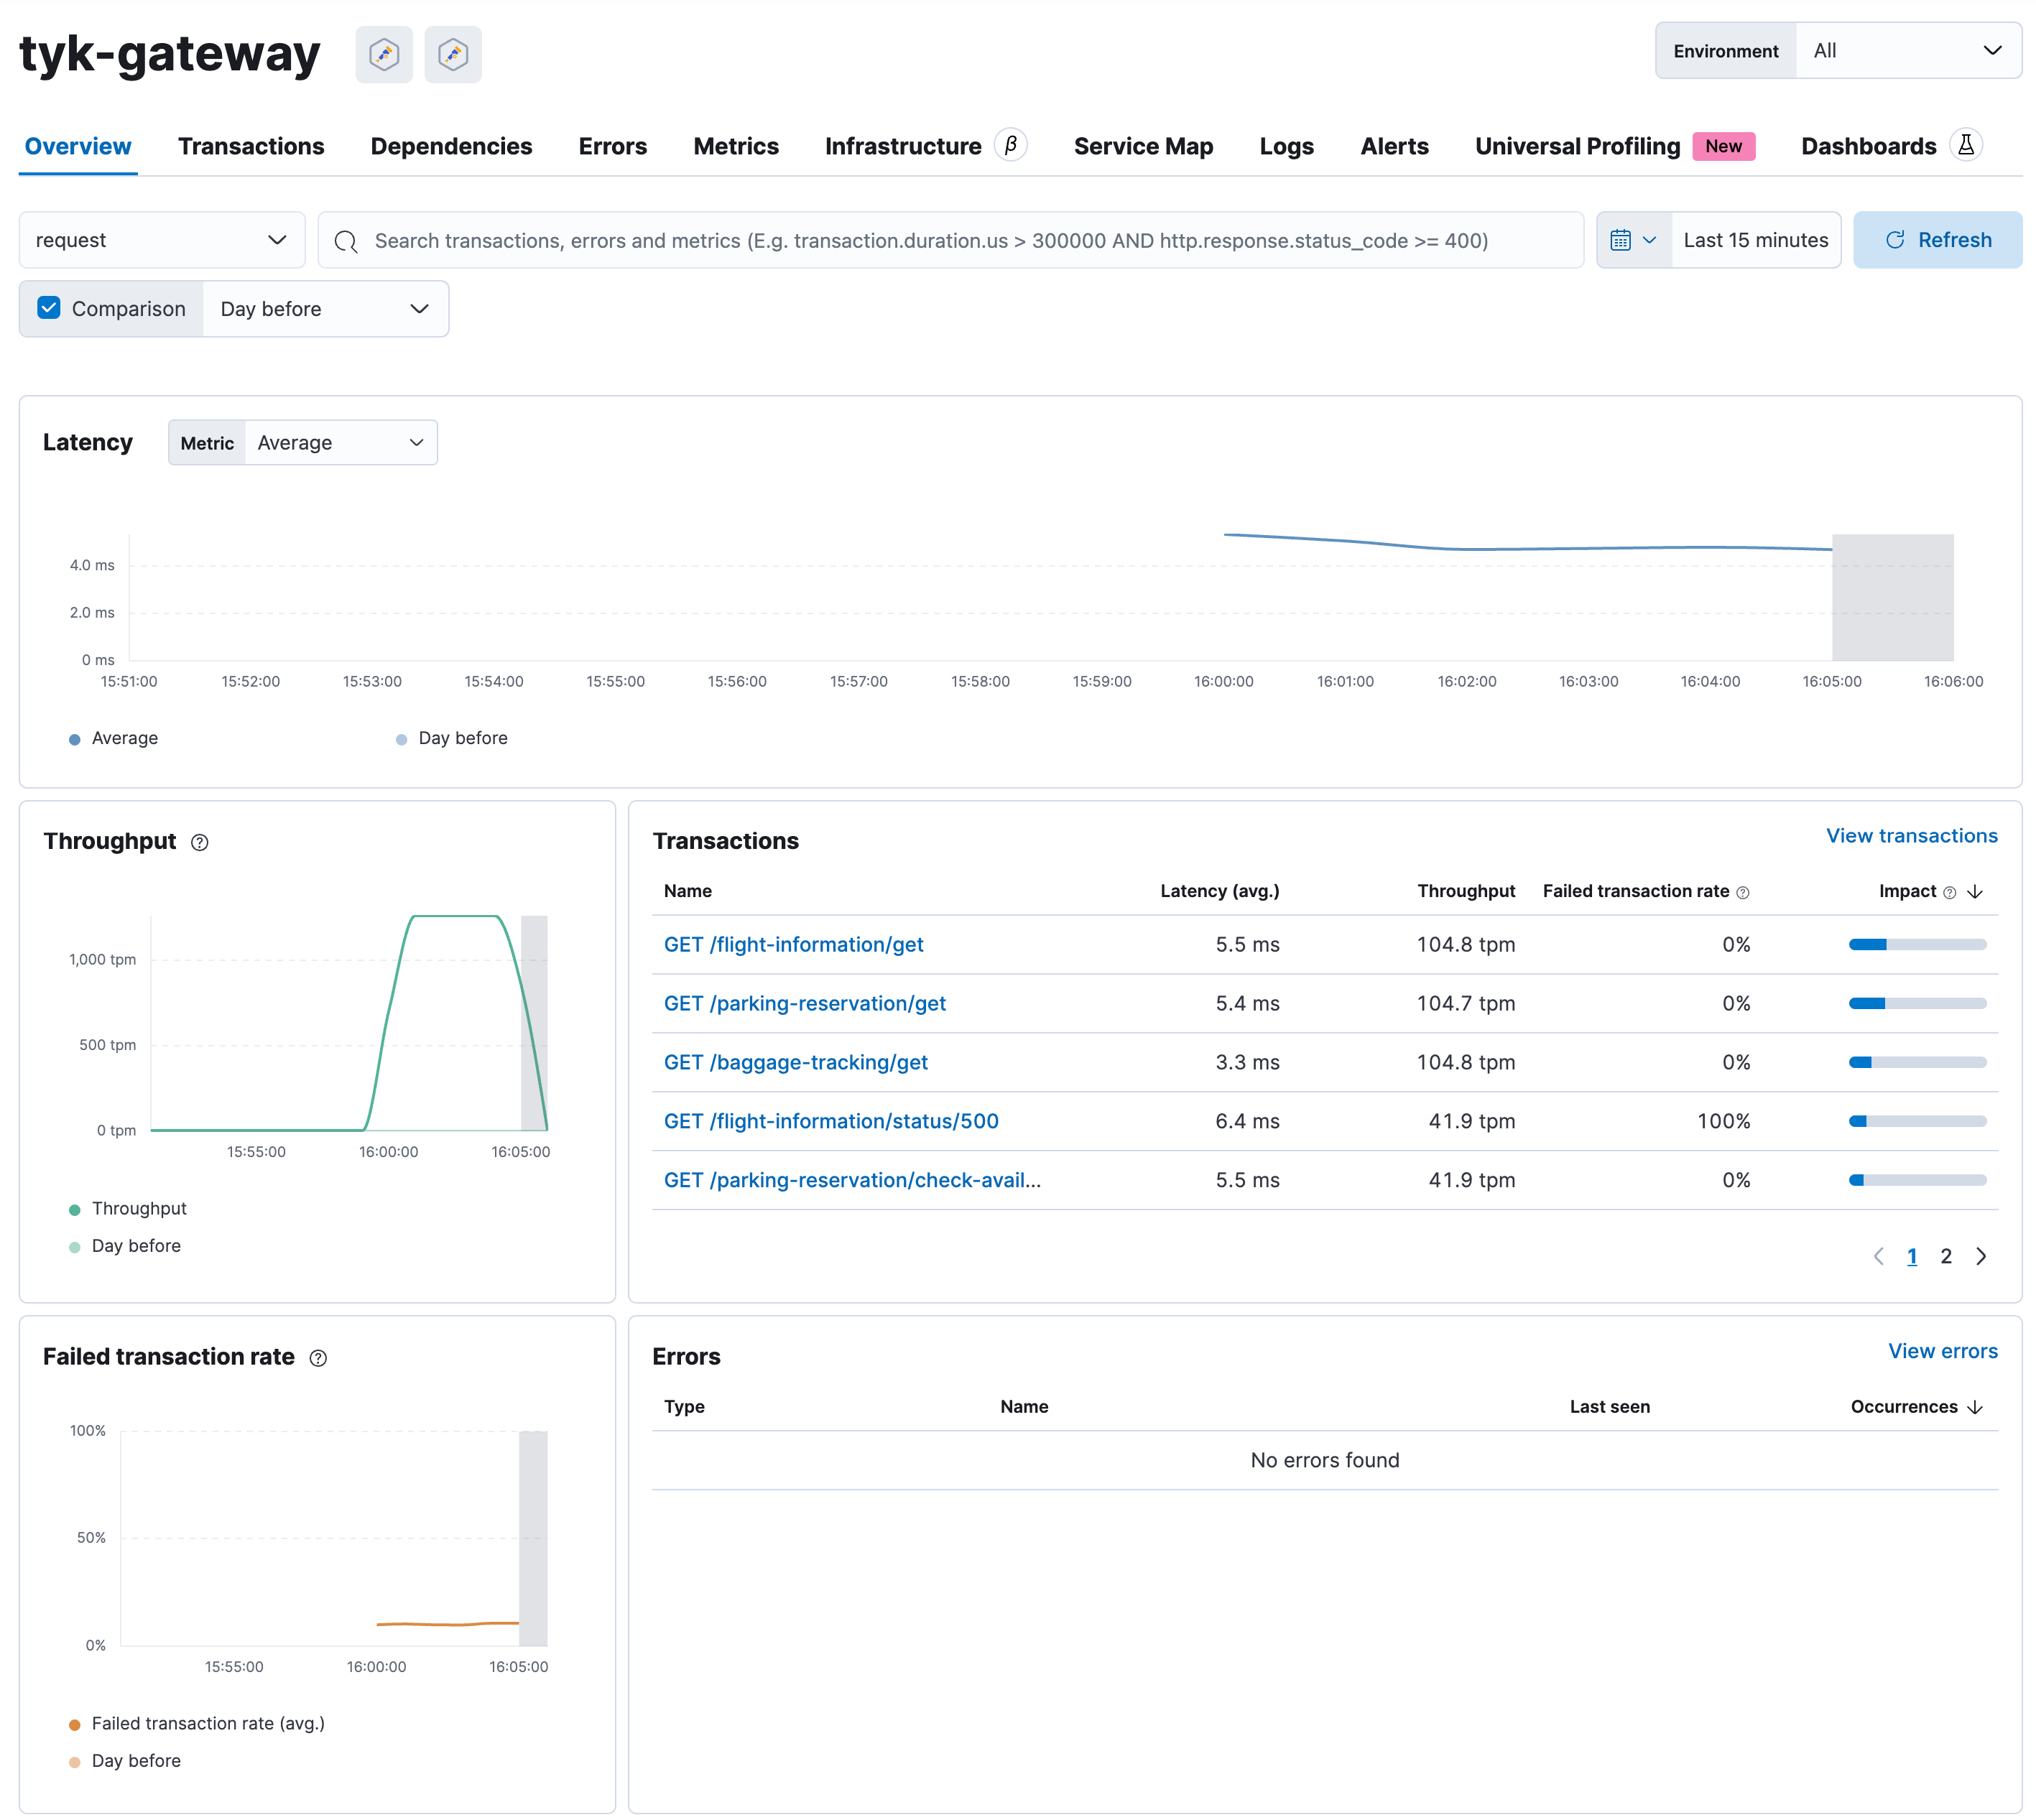
Step 3. Explore OpenTelemetry Traces in Elasticsearch
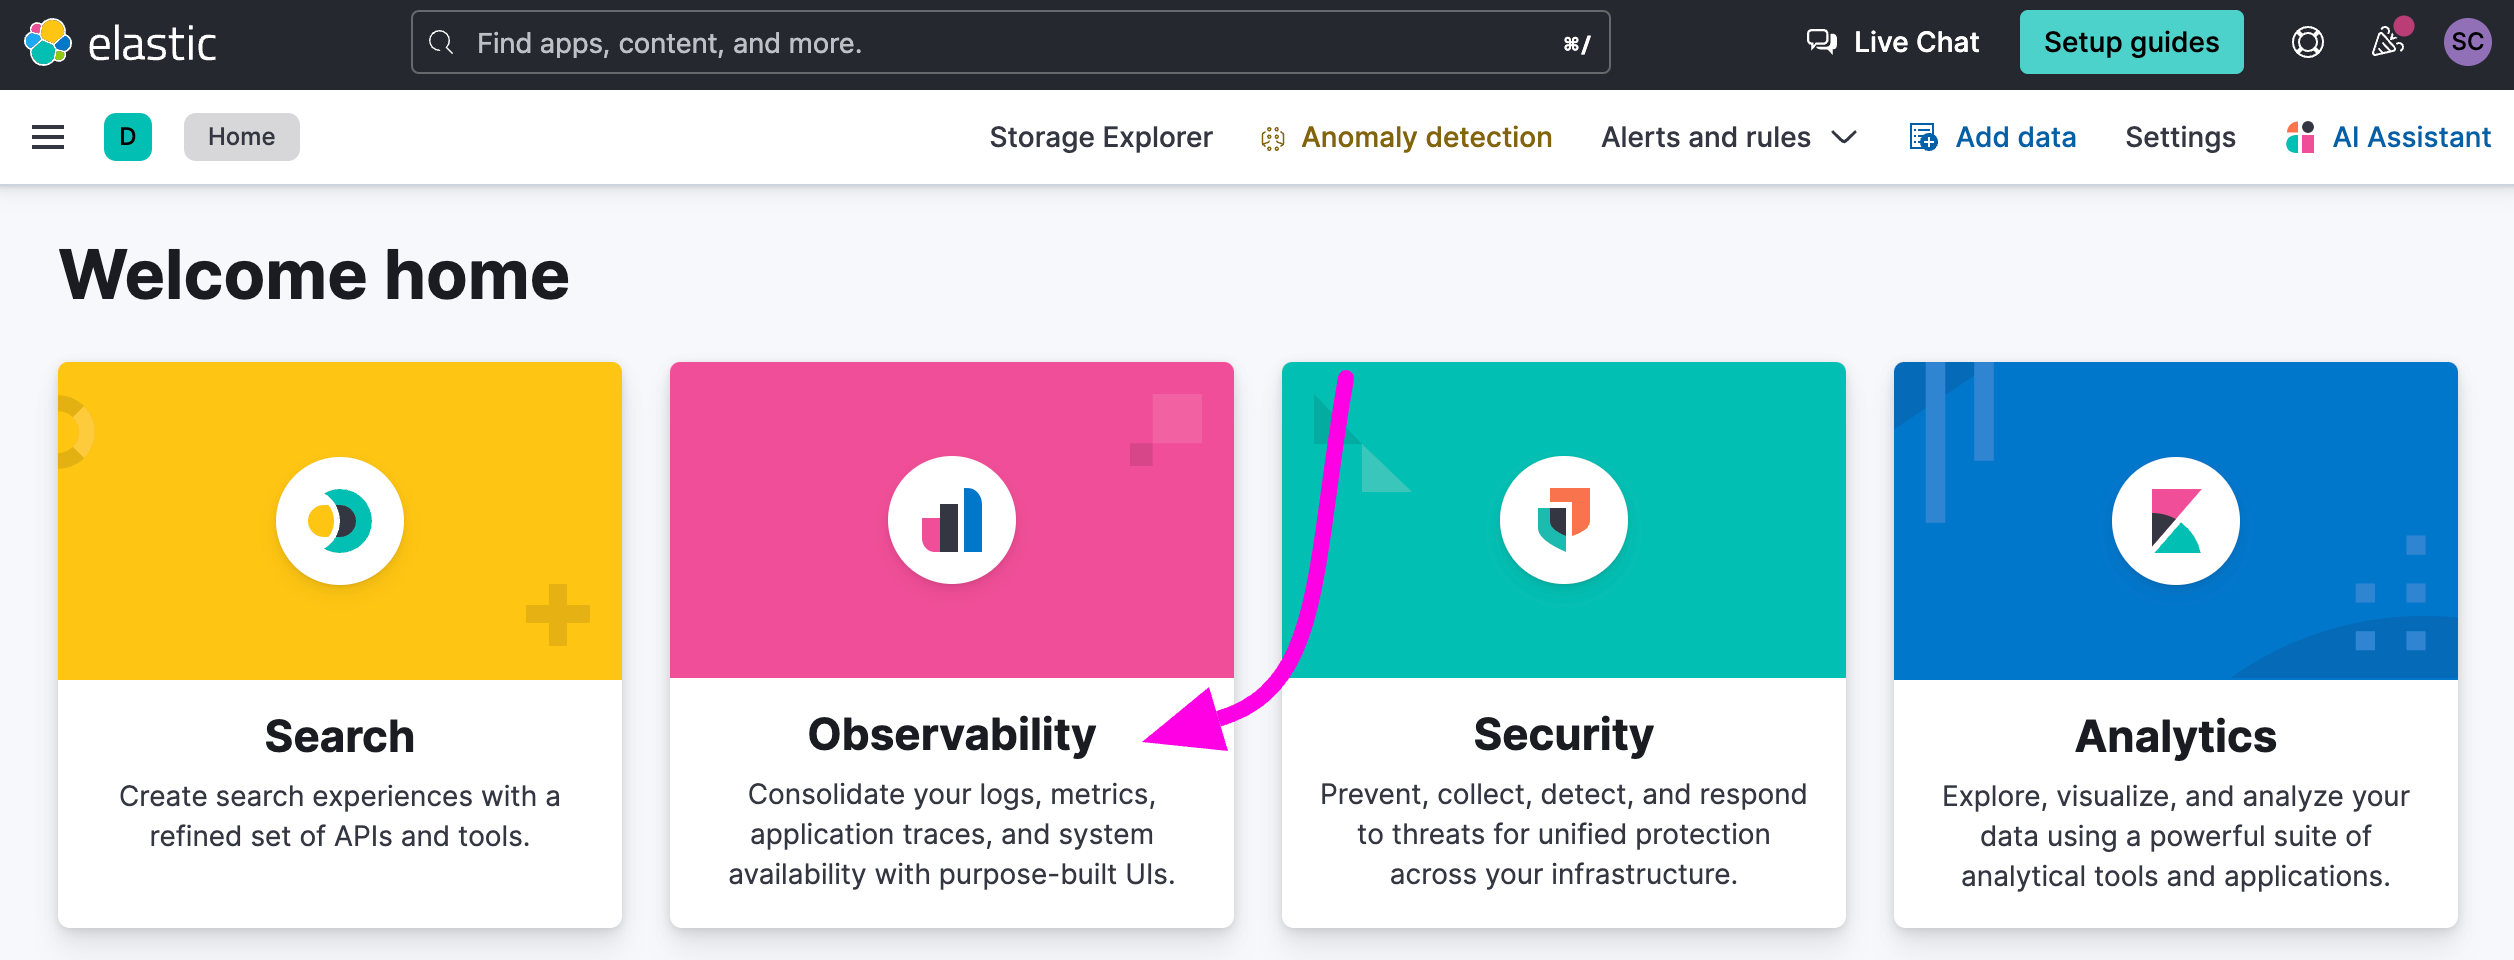
In Elasticsearch Cloud:
  1. Go to Home and select Observability.
Configure Elasticsearch
  1. On the right menu, click on APM / Services.
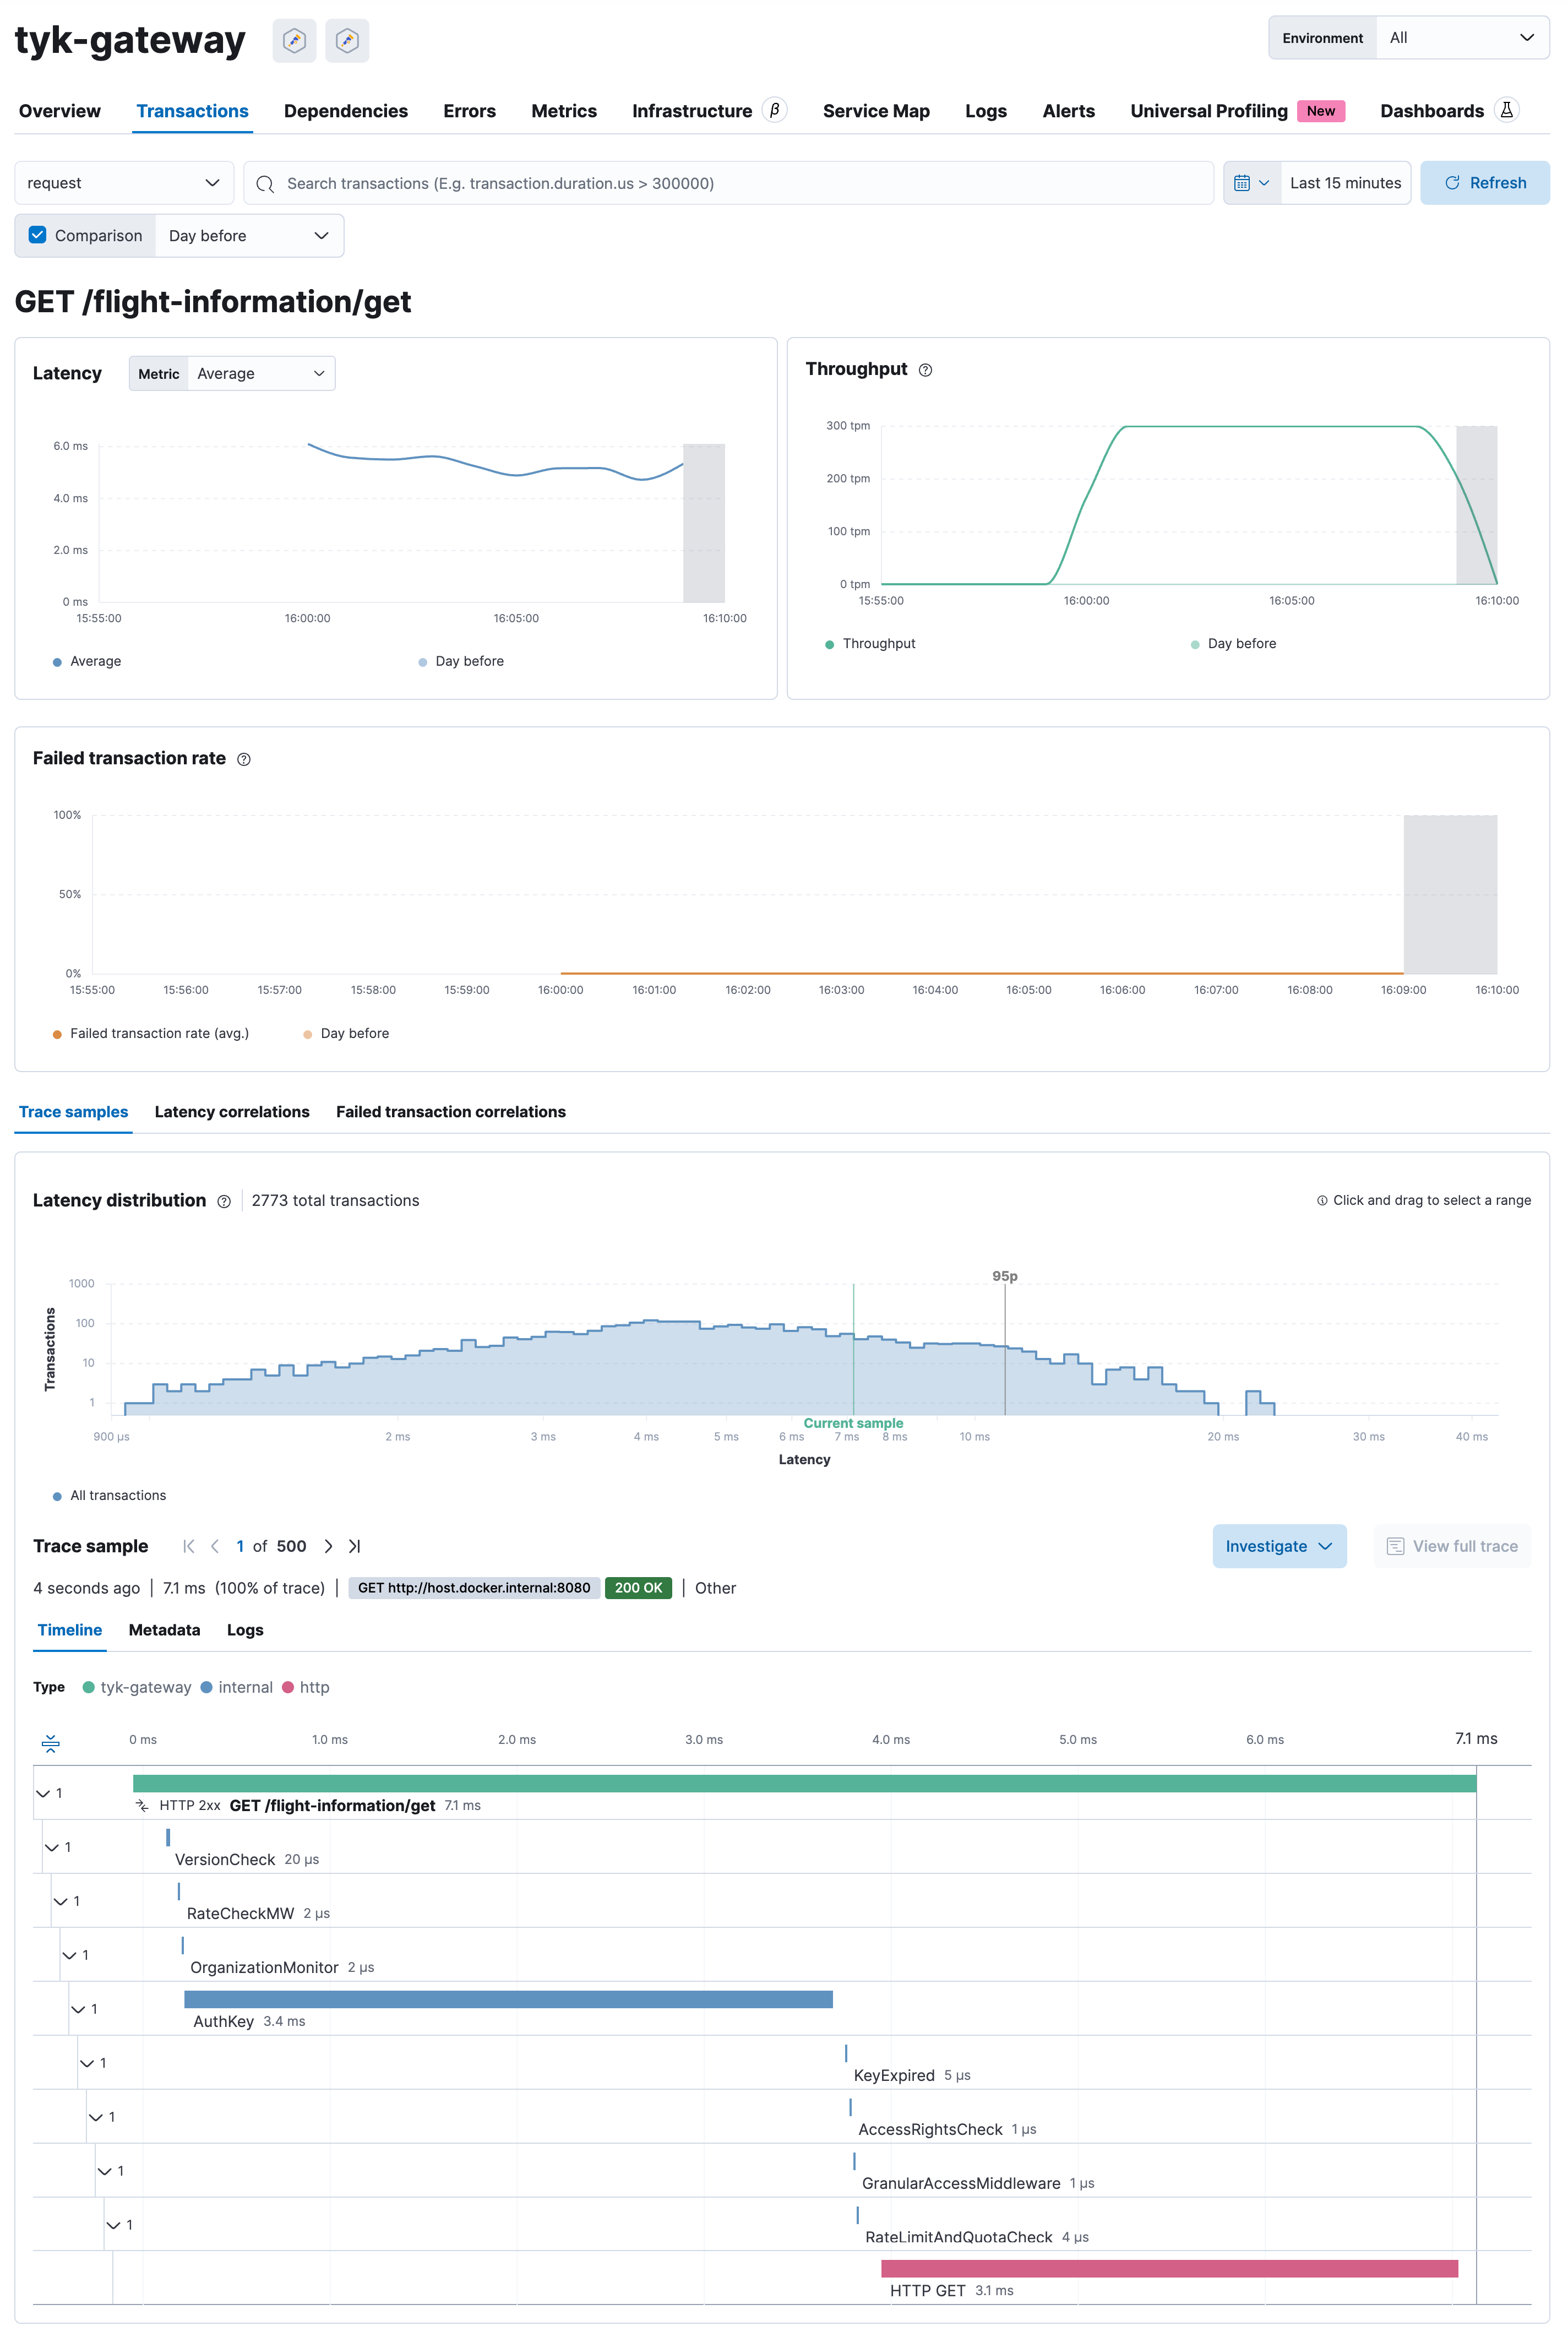
  2. Click on tyk-gateway.
  3. You will see a dashboard automatically generated based on the distributed traces sent by Tyk Gateway to Elasticsearch.
Configure Elasticsearch Select a transaction to view more details, including the distributed traces: Configure Elasticsearch