Introduction
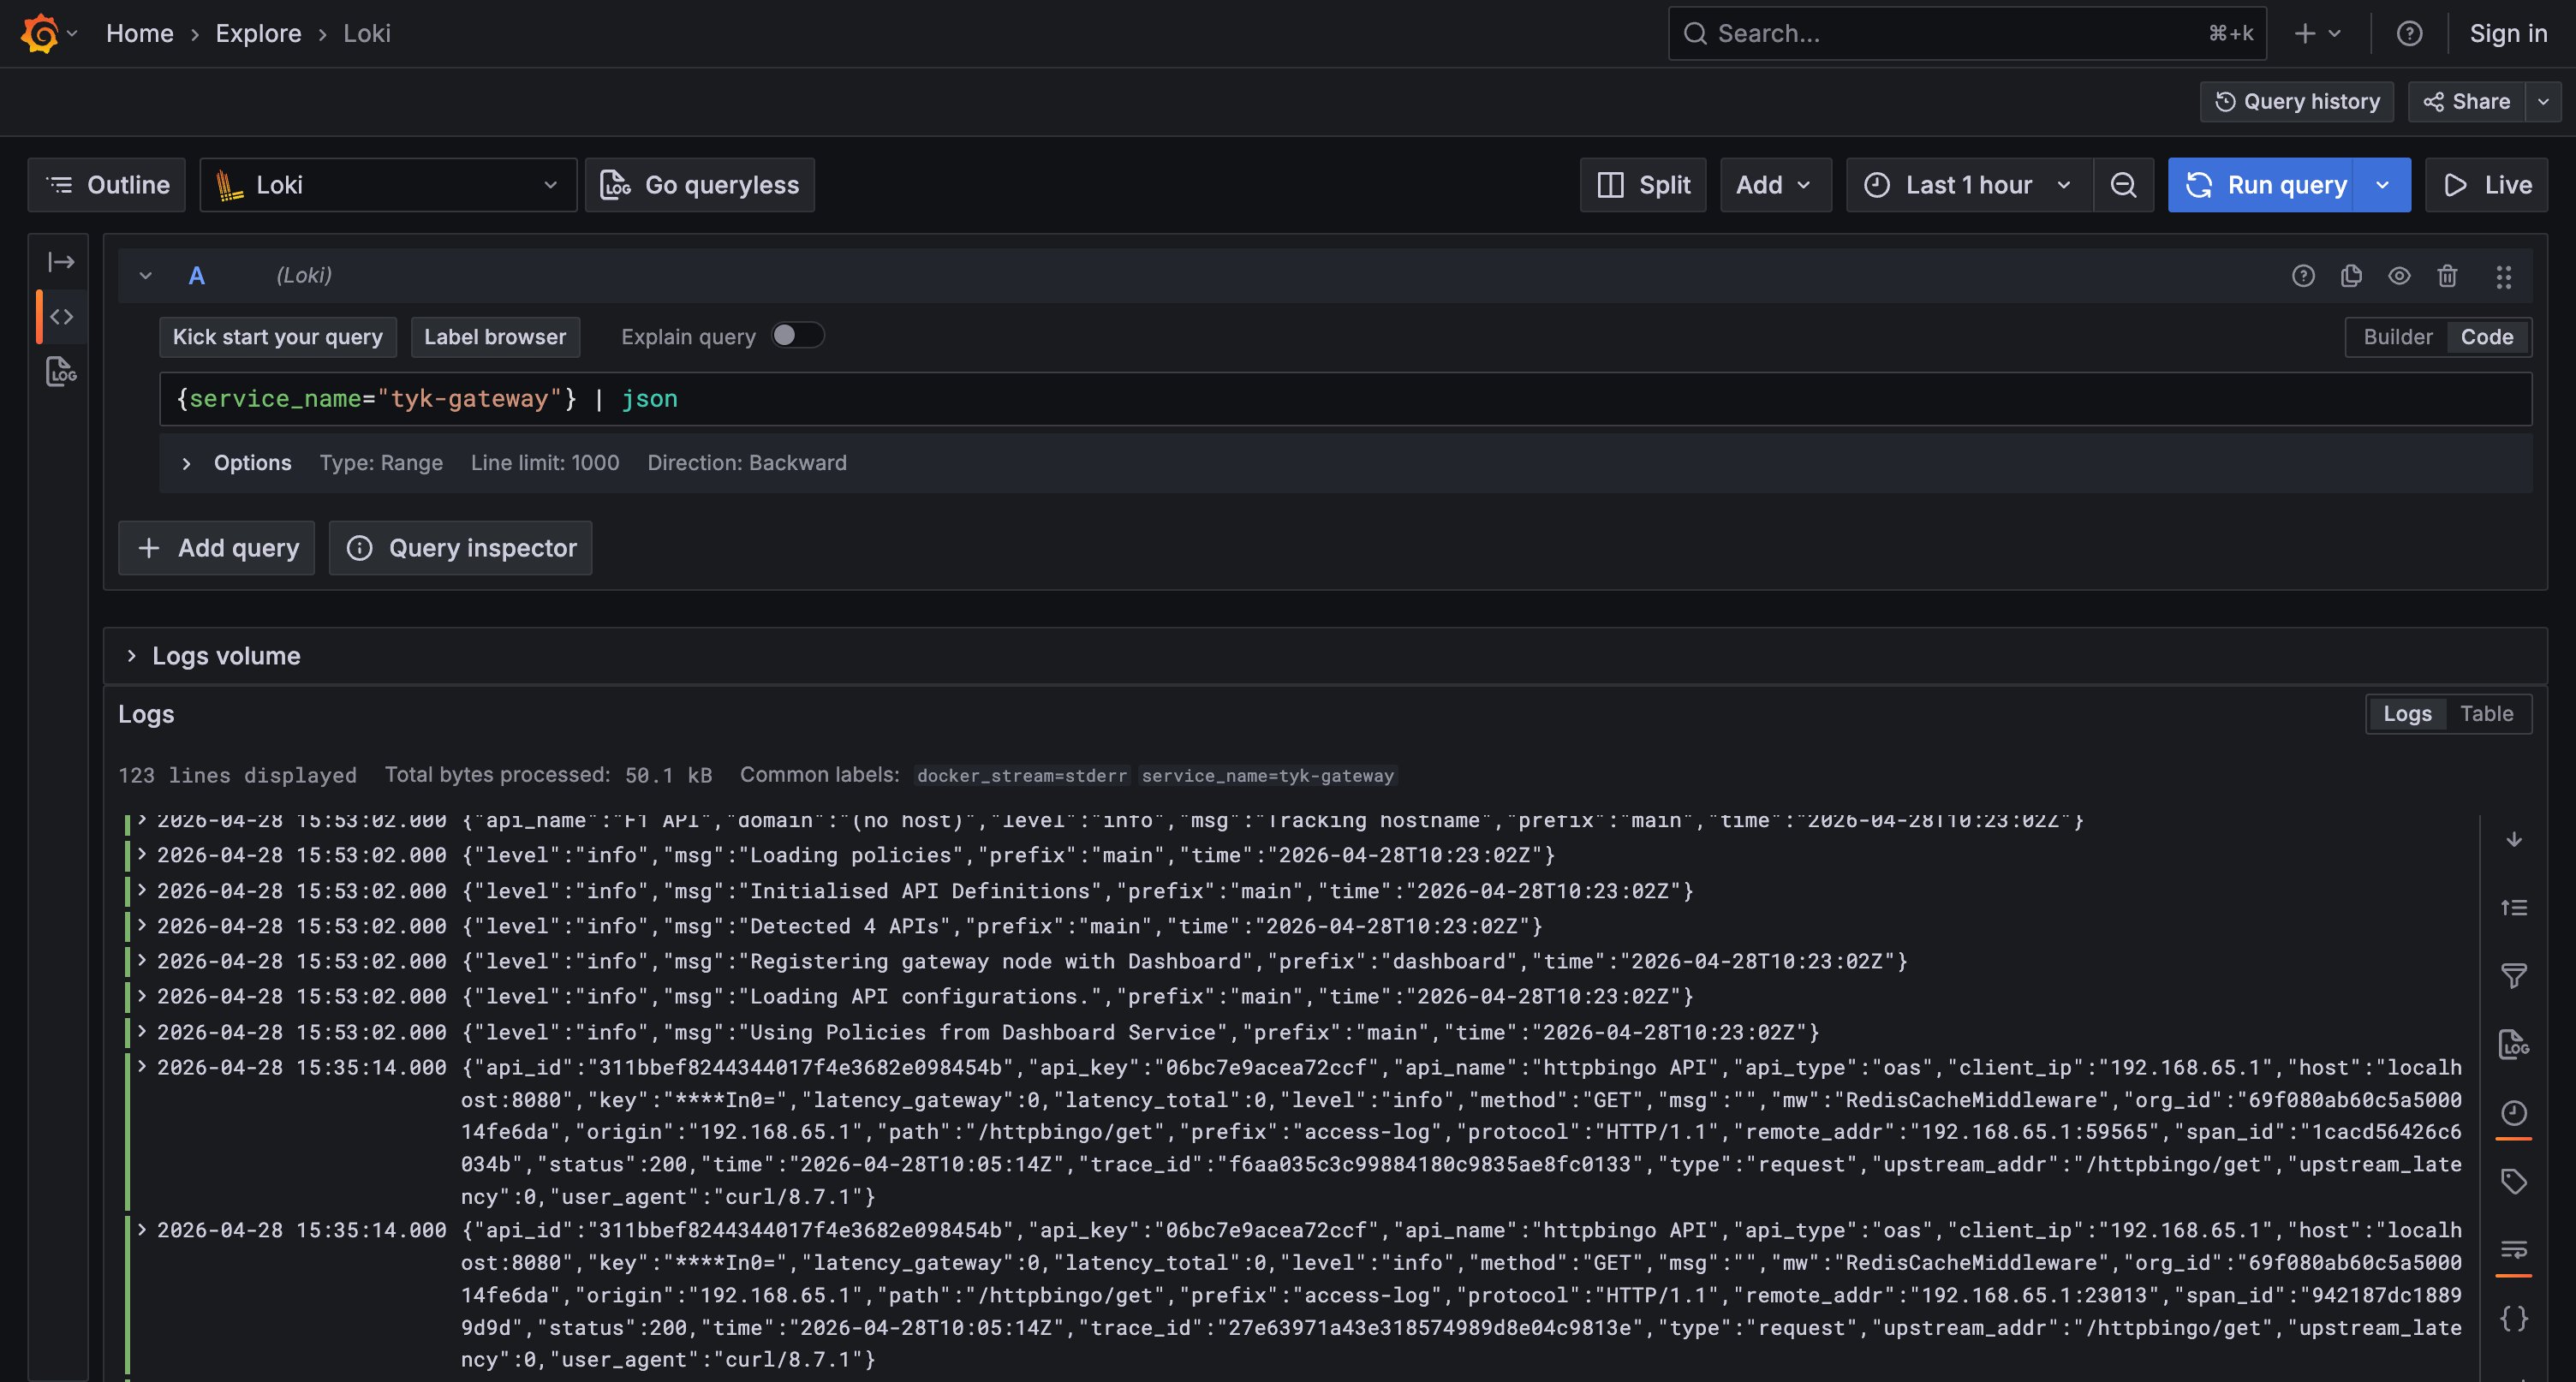
Tyk Gateway exports all three observability signals (structured logs, distributed traces, and metrics) via the OpenTelemetry Protocol (OTLP). This guide shows you how to enable each signal and route them to a local Grafana stack (Prometheus, Loki, Tempo) using an OpenTelemetry Collector. By the end of this guide you will have:- Structured JSON access logs from Tyk Gateway shipping to Loki
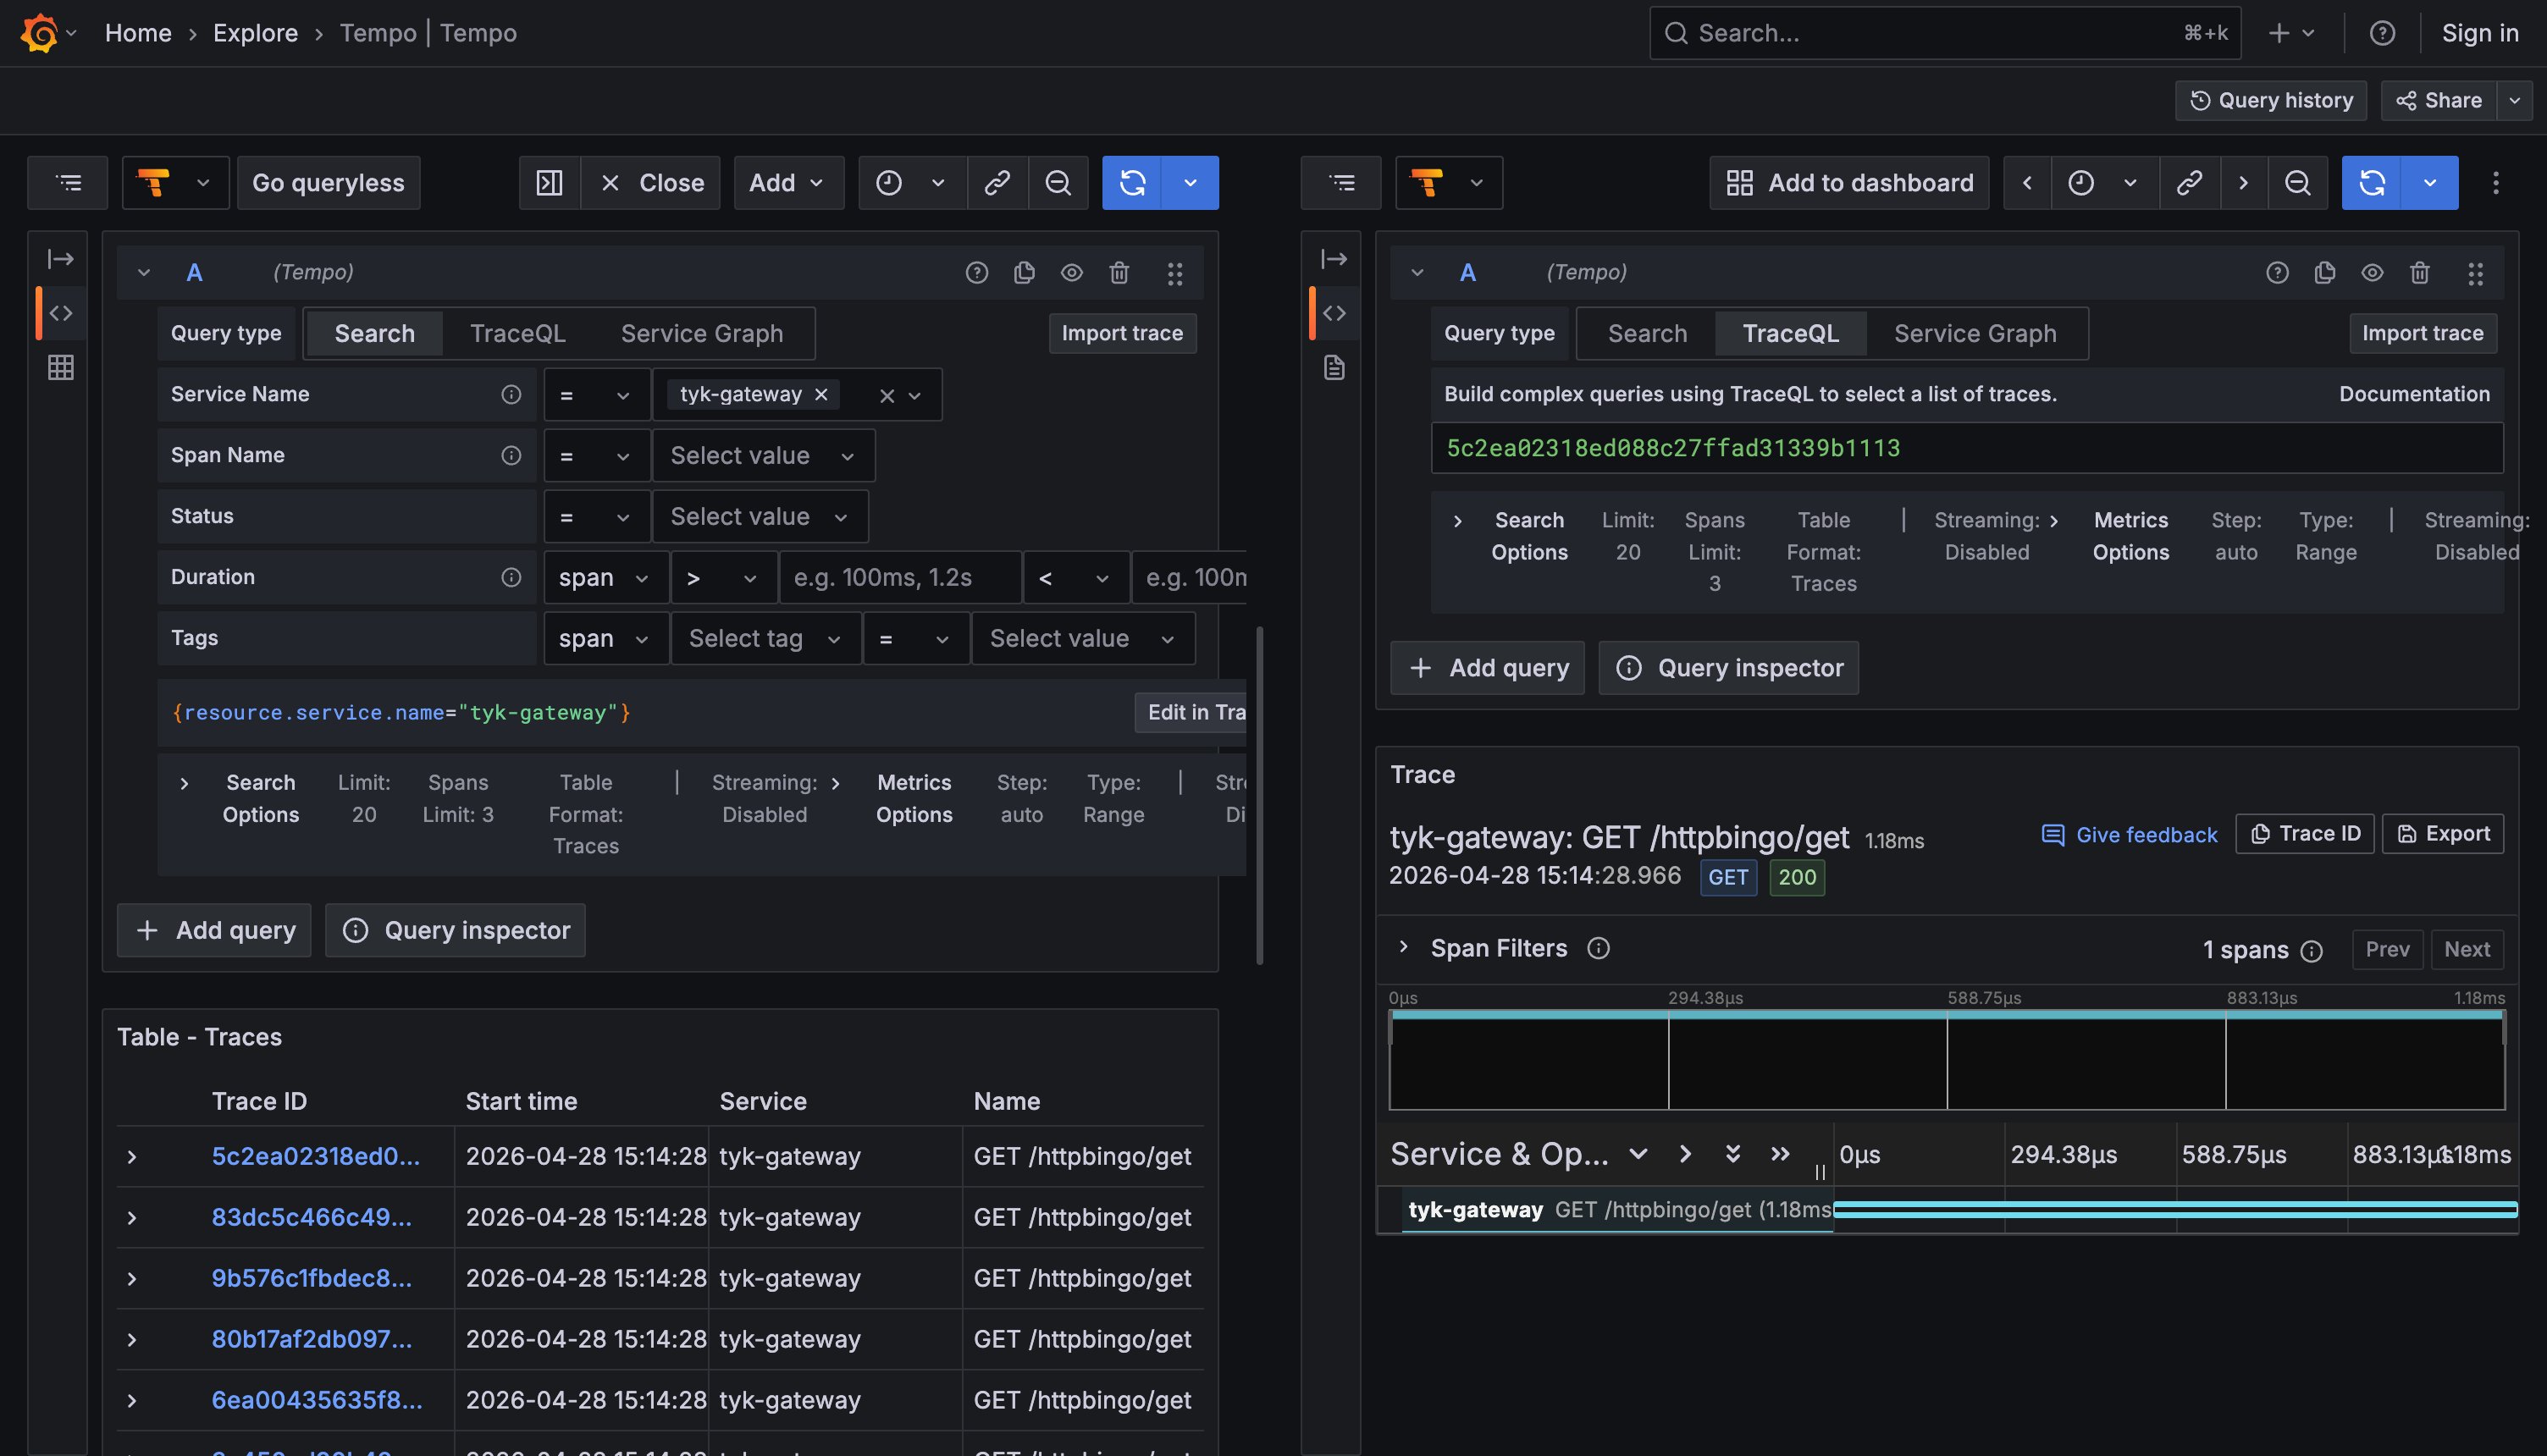
- Distributed traces exporting to Tempo
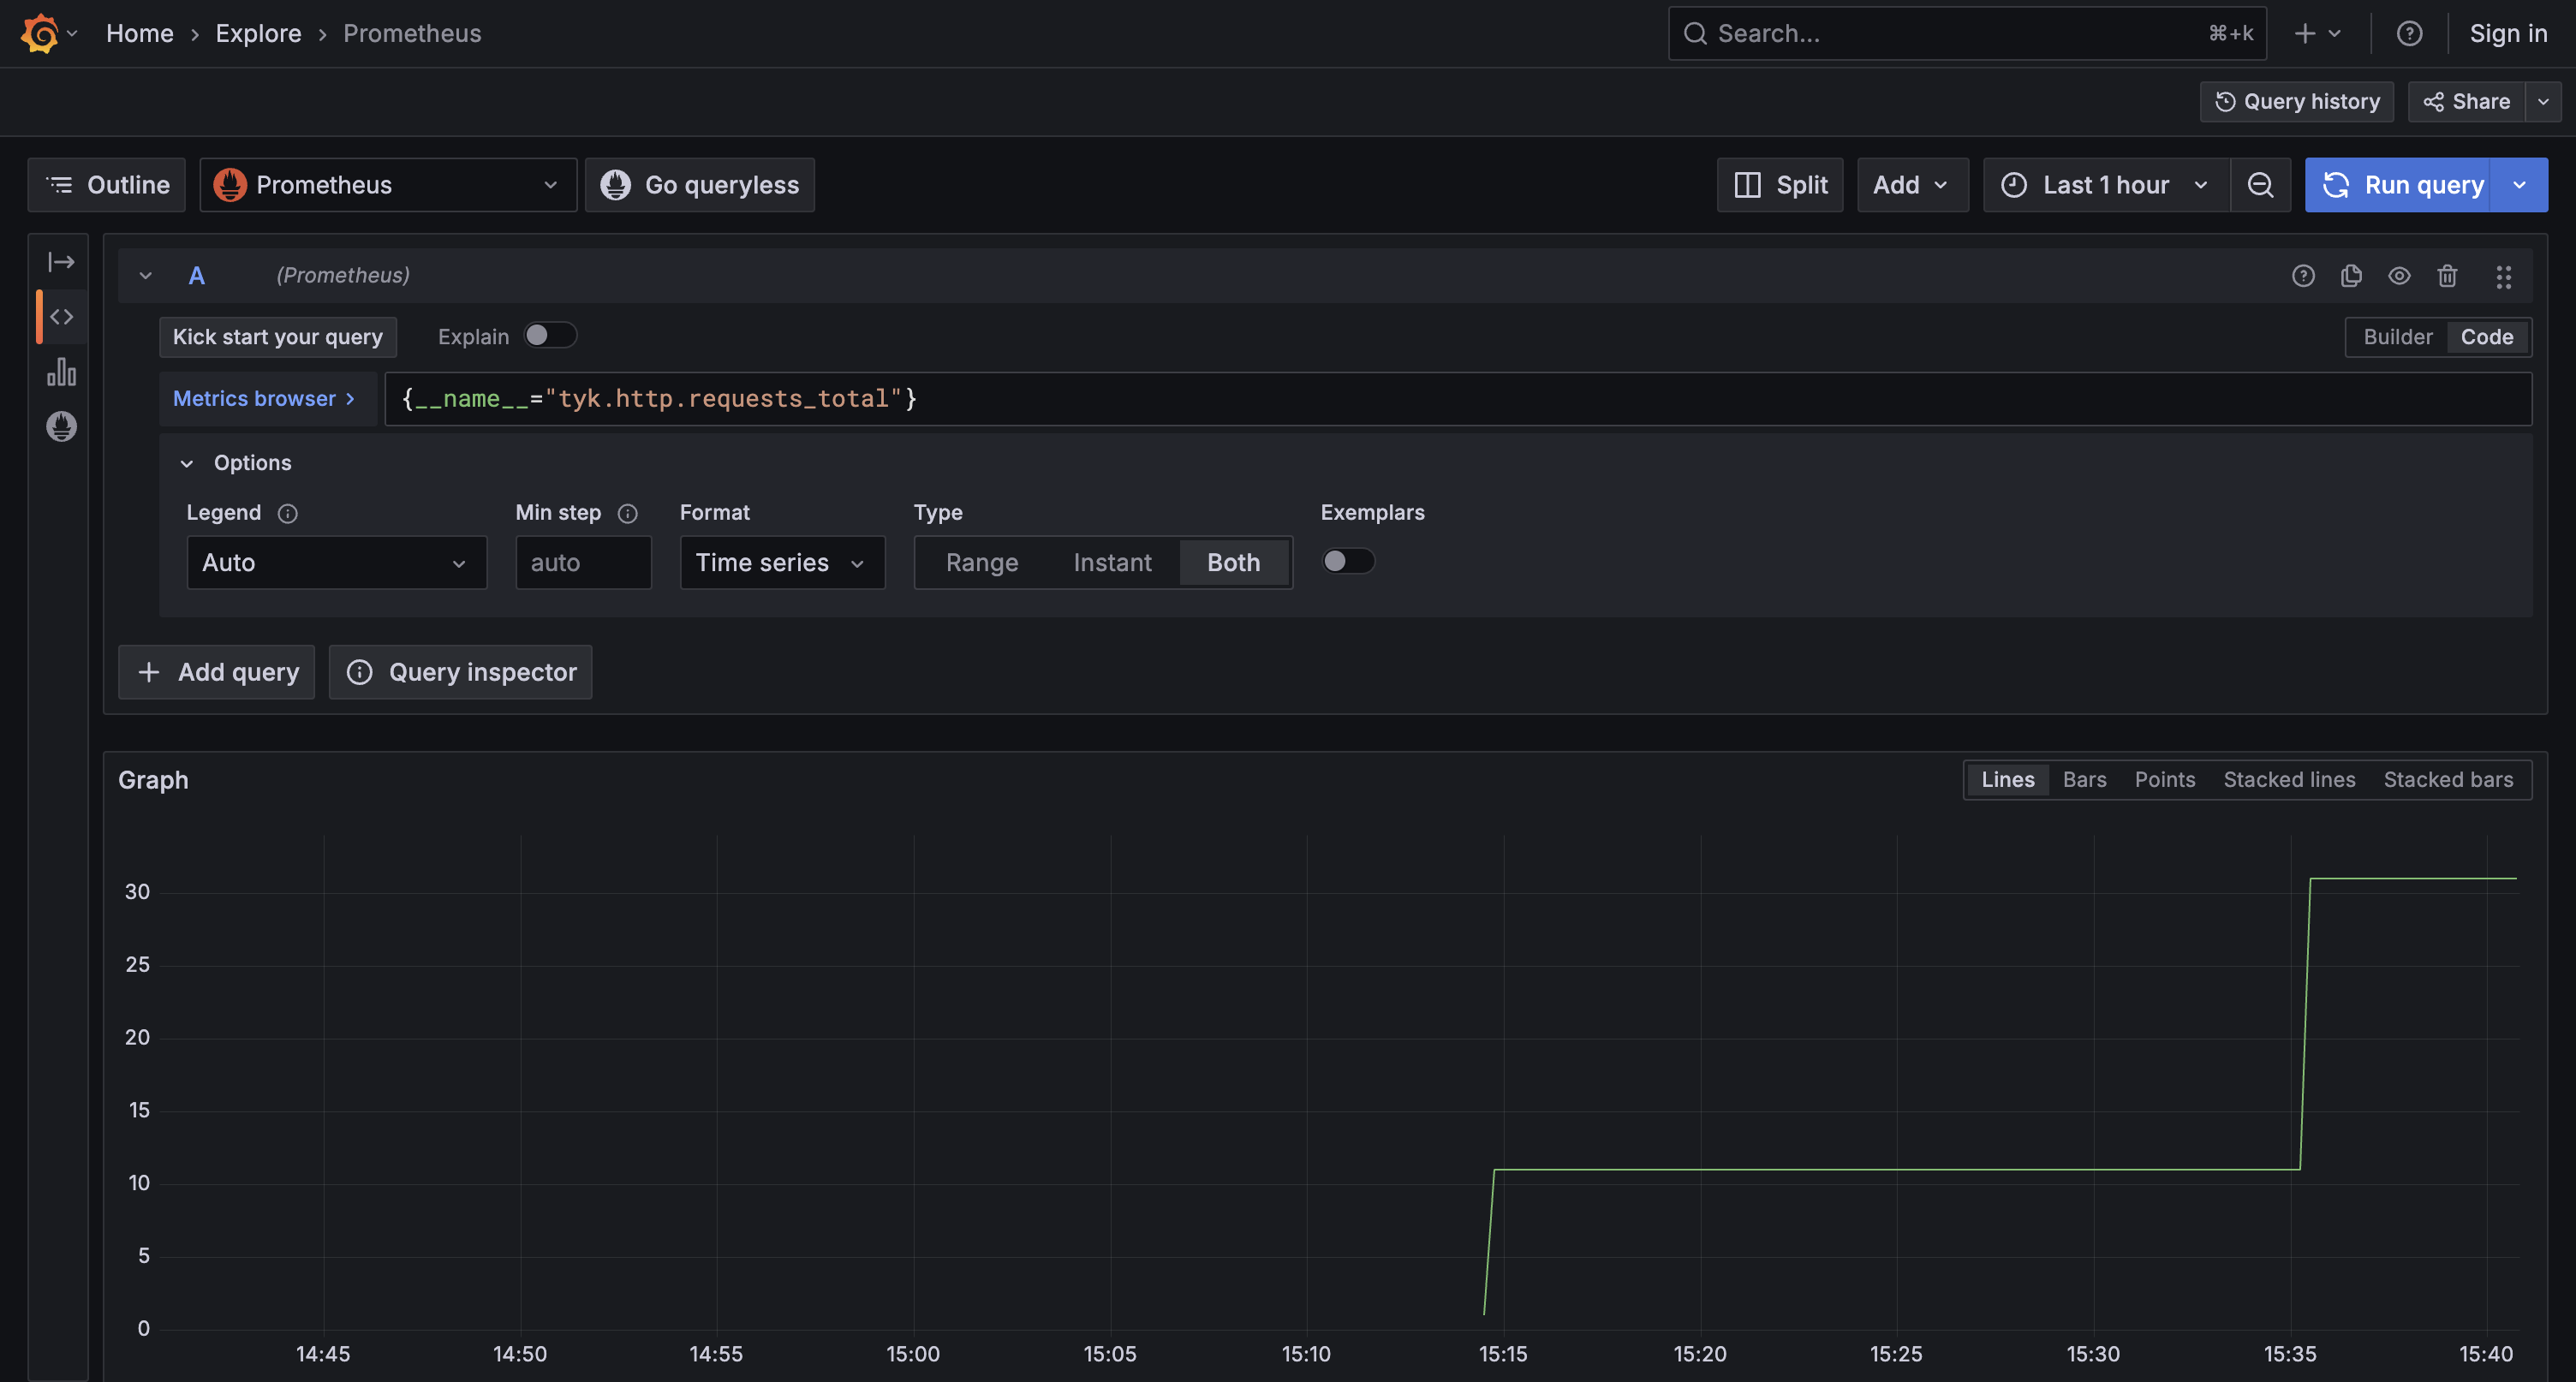
- Gateway metrics (request rate, latency, error rate) flowing to Prometheus
- A Grafana instance wired up to all three backends
Availability
Prerequisites
- Docker and Docker Compose installed
- A running Tyk deployment. We recommend following the Tyk getting started guide to set up a local Docker environment
- Basic familiarity with Docker Compose
Architecture
All three signals flow from Tyk Gateway to a single OpenTelemetry Collector endpoint. The Collector fans them out to the appropriate backend. Grafana queries all three.Tyk Gateway does not export logs via OTLP. It writes structured JSON to
stderr. The OTel Collector reads those logs from the Docker container log path using the filelog receiver.Instructions
Step 1: Configure Tyk Gateway
Add the following environment variables to yourtyk-gateway service. These enable all three signals:
tyk.conf, the equivalent configuration is:
sampling.rate: 1.0 captures every request, which is suitable for getting started. In production, lower this to 0.1 (10%) or use ParentBased sampling. See the Tyk Gateway configuration reference for all options.Step 2: Add the OTel Collector
Create anotelcol-config.yml file in your deployment directory:
otel-collector service to your docker-compose.yml:
filelog receiver.
Step 3: Add the Grafana stack
Add Prometheus, Loki, Tempo, and Grafana to yourdocker-compose.yml:
Grafana is mapped to port
3001 to avoid conflicting with Tyk Dashboard on port 3000. Adjust if needed.prometheus.yml to allow OTLP ingest:
tempo.yaml:
Provision Grafana datasources
Creategrafana/provisioning/datasources/tyk.yaml:
Step 4: Start and verify
Restart your deployment to apply the configuration changes to your Gateway and bring up the new services:If you are following this guide using the Tyk Self-Managed getting started setup, an httpbingo API is pre-configured. Generate test traffic with:
api_id, path, status, latency_total, and trace_id.
Next steps
- Explore default metrics: see all Gateway metrics available out of the box in Default Metrics
- Add custom metrics: attach request headers, JWT claims, and response codes as metric dimensions using Custom Metrics
- Kubernetes deployment: for log collection in Kubernetes using the OTel Collector DaemonSet, see Collecting Gateway Logs with OTel on Kubernetes