

Introduction
Tyk Gateway has built-in “uptime awareness” of the upstream services it proxies to, by actively polling user-defined endpoints at set intervals. This isn’t meant to replace traditional uptime monitoring tools; it’s designed to supplement them, letting Tyk Gateway bypass unhealthy upstream hosts as part of its own request routing.Compatibility
Uptime tests are only available for Tyk Self-Managed users. It is not available on Tyk Cloud.How Uptime Tests Work
When uptime tests are configured in a Tyk Gateway cluster, a single Gateway elects itself as primary, using a key held in Redis as a dead man’s switch: the primary keeps that key alive, and if it stops or fails, another Gateway detects the gap and elects itself instead. Only the primary Gateway actually runs the uptime tests for the cluster (or shard group, if you’re usingpoller_group).
The primary Gateway runs tests from a worker pool, executing them simultaneously on a configurable interval. Depending on how many uptime tests you’re running, increase or decrease the pool size as needed.
Initial Configuration
Add anuptime_tests section to tyk.conf:
Configure with the API Definition
Uptime tests are defined per API, so add anuptime_tests section to that API’s definition:
check_list accepts:
Configure with the Dashboard
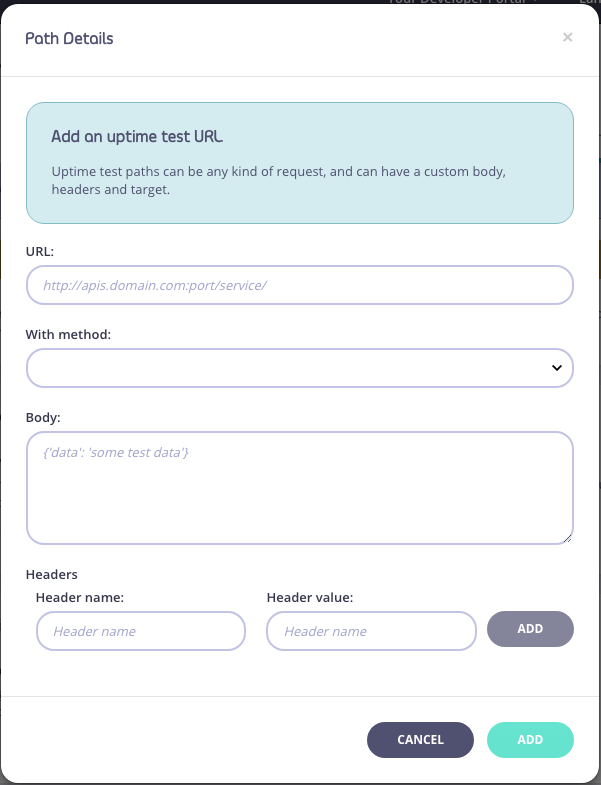
To add an uptime test using the Dashboard, make sure you’ve completed the Gateway configuration first, then: Step 1: Select the Uptime Tests tab From the API Designer, select the Uptime Tests tab:

Monitoring Uptime Tests in Tyk Dashboard
Everything above already works on its own: Tyk Gateway detects unhealthy upstream hosts, bypasses them, and firesHostUp/HostDown events. But none of that is visible in Tyk Dashboard by default. What this section adds is exactly that visibility: a way to see and review uptime test results yourself, rather than relying solely on those events.
To get that visibility, Tyk Dashboard needs the results somewhere it can query them.
If config.enable_uptime_analytics is set to true then each time Tyk Gateway runs an uptime test, it generates a log containing: the tested URL, the response time, and either the HTTP status code returned or a flag marking a TCP-level or server-level failure, timestamped and tagged with the API and Organisation it belongs to. This result is written to Redis, under its own key, separate from the regular traffic logs generated for API traffic.
Redis is not intended for long time storage so, as with traffic logs, Tyk Pump should be configured to transfer the logs to the persistent database in the Control Plane, from which they can be accessed by Tyk Dashboard.
Which persistent database you are using, MongoDB or SQL, determines what is stored:
- for MongoDB, the Uptime Pump stores each test log as a separate document in the collection
- for SQL, the Uptime Pump aggregates the test results per hour, broken down by URL and response code (hit counts, successes, error counts, average response time), prior to storage in the table
Combined vs Distributed Deployments
In a combined control and data plane, this works as described above: Tyk Pump reads from the shared Redis and writes directly to persistent database. In a distributed deployment, with separate control and data planes connected via Tyk MDCB, uptime test results are handled differently from regular traffic logs and aggregated analytics: they never flow through the Hybrid Pump or Tyk MDCB. Each data plane elects its own primary Gateway and runs its own uptime tests against its own upstream hosts, and results are written only to that data plane’s local Redis. To get this data into Tyk Dashboard, run a Tyk Pump instance directly on each data plane, with an Uptime Pump collecting from that data plane’s local Redis, configured to write to a MongoDB or SQL store that Tyk Dashboard, on the control plane, can also reach. This is the same pattern used for External Data Sink Pumps running on a data plane.Common Configuration
The Uptime Pump is configured through its ownuptime_pump_config object, at the top level of pump.conf, entirely separate from the pumps map used for every other pump type. Unlike those pumps, it doesn’t accept the common pump settings such as filters or timeout: Tyk Pump writes every uptime test result it receives, unconditionally.
MongoDB
By default, the Uptime Pump uses the same implementation as the Standard Mongo Pump, storing every individual test result as a separate document in one collection. It accepts the same Common Mongo Meta as every other Mongo pump, plus these fields, identical to the Standard Mongo Pump’s own:
Because this collection grows with every uptime test, it should be capped.
SQL
The SQL Uptime Pump generates aggregated data from the uptime test logs, storing them in a table calledtyk_uptime_analytics, or one table per day if table_sharding is enabled (see Table Sharding).
Set uptime_type to sql in uptime_pump_config to use the SQL Uptime Pump. It accepts the same Common SQL Meta as every other SQL pump.
Tyk Dashboard Configuration
In the Tyk Dashboard configuration, setstorage.uptime to match wherever you’ve configured the Uptime Pump to write, so that results can be viewed under Monitoring > Service Uptime and Monitoring > Uptime Targets in Tyk Dashboard.
For MongoDB:
table_sharding on the SQL Uptime Pump, set the matching storage.uptime.table_sharding here too.
Events
When Tyk Gateway detects downtime on a test, it fires aHostDown event; when the host recovers, it fires HostUp. These are ordinary Tyk Events, so you can attach any supported action to them, such as a logger, a webhook, or a custom JavaScript plugin.
Since tests run per URL, a single host with multiple endpoints under test can fire several HostDown events at once.
Load Balancing and Service Discovery
If you’re using round-robin load balancing, you can have Tyk Gateway check the outbound request’s host against the uptime test results before routing to it, skipping to the next host in the list if it’s marked down:www.myapi.com:3000.