Prerequisites
1. Enable OTel metrics on the gateway
Tyk exports metrics via OTLP (not a Prometheus scrape endpoint directly). The recommended setup uses an OpenTelemetry Collector to receive OTLP from Tyk and expose a Prometheus scrape endpoint. Add the following to yourtyk.conf:
:4317 and export to Prometheus on :8889. See OpenTelemetry in Tyk for full configuration options.
2. Enable traffic logs on the MCP proxy
Tyk Gateway only records metrics for APIs that have traffic logging enabled. In the Dashboard, open your MCP proxy definition, navigate to Advanced Options, and enable Traffic Logs. Without this, no requests are recorded and all panels will be empty.3. Configure the MCP metric instruments
The metric instruments are configured intyk.conf, under opentelemetry.metrics. Add the following to your gateway config:
OTel metric names are translated when Prometheus scrapes them: dots become underscores, counter instruments get a
_total suffix, and histogram instruments with a seconds unit get a _seconds suffix. So tyk.mcp.requests.total becomes tyk_mcp_requests_total in PromQL, and tyk.mcp.upstream.duration becomes tyk_mcp_upstream_duration_seconds_bucket, tyk_mcp_upstream_duration_seconds_sum, and tyk_mcp_upstream_duration_seconds_count.Instructions
Step 1: Create the dashboard
-
In Grafana, go to Connections → Data Sources → Add new data source, select Prometheus, set the URL to your Prometheus server (e.g.
http://prometheus:9090), and click Save & test. -
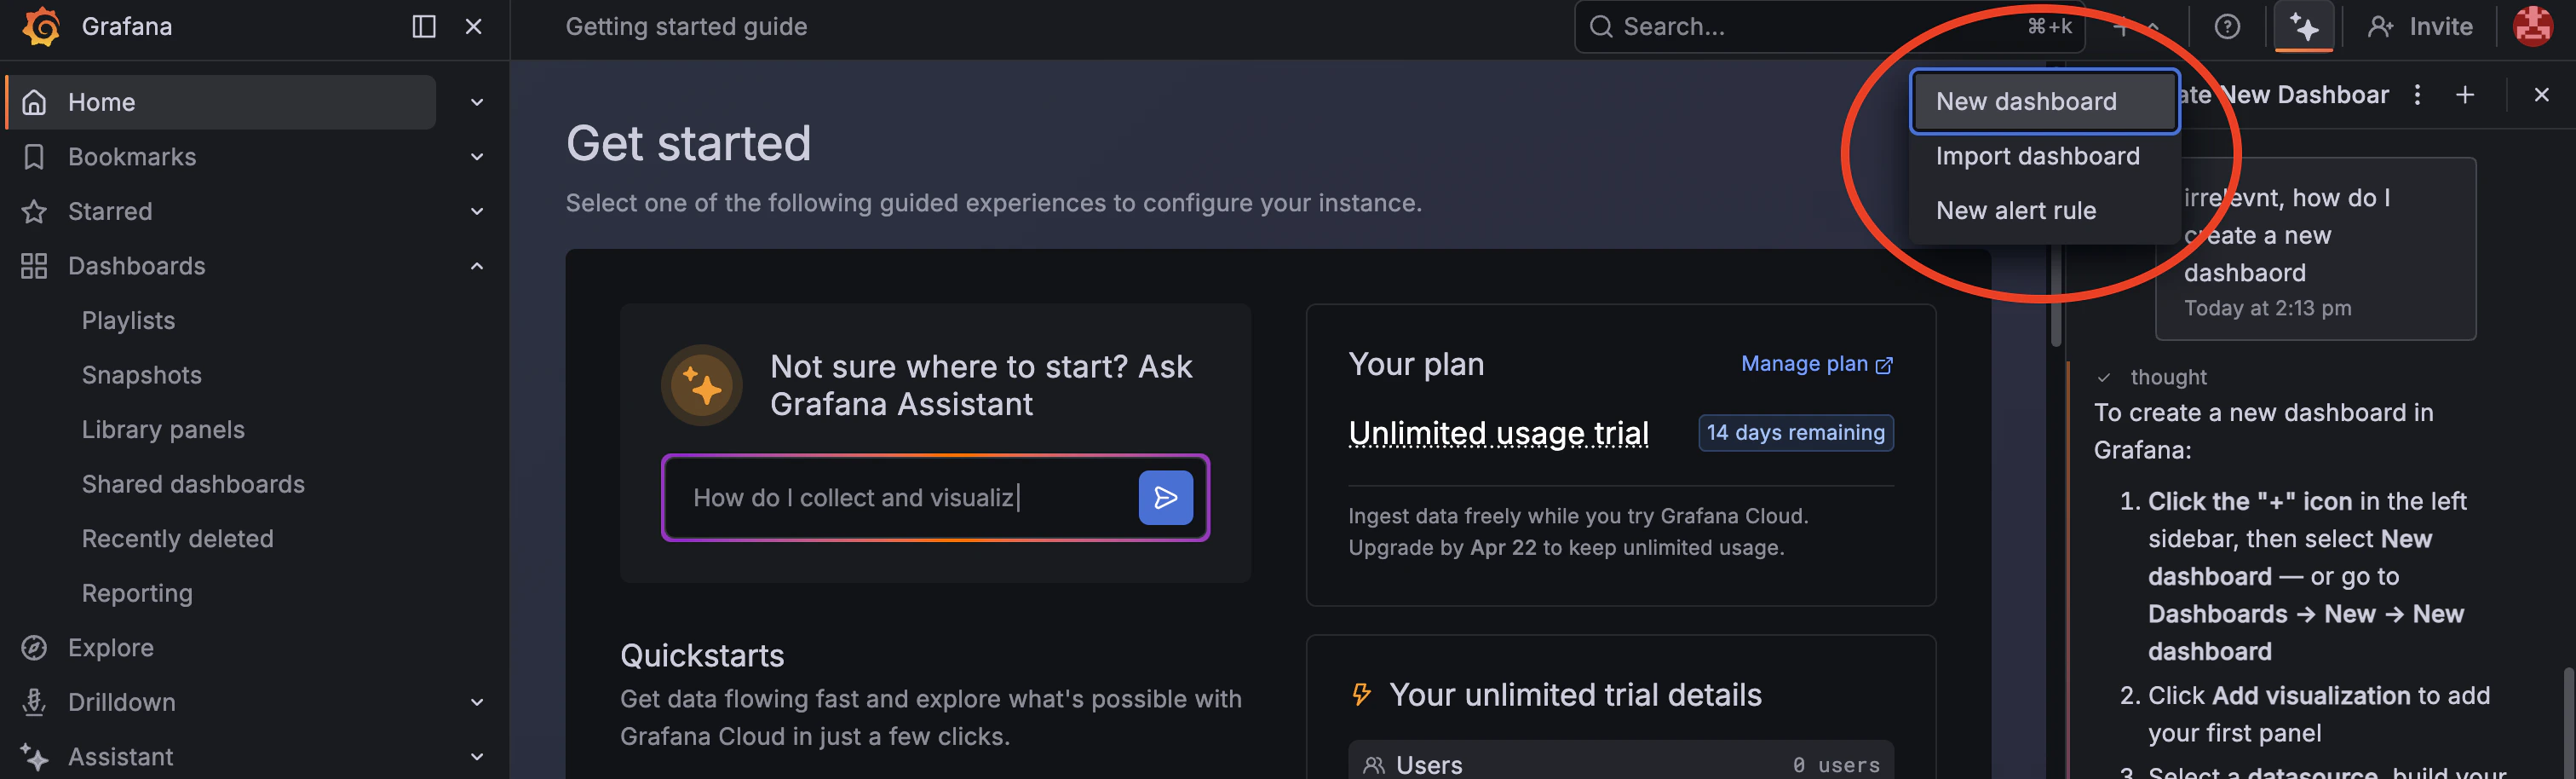
Go to Dashboards → New → New dashboard.
-
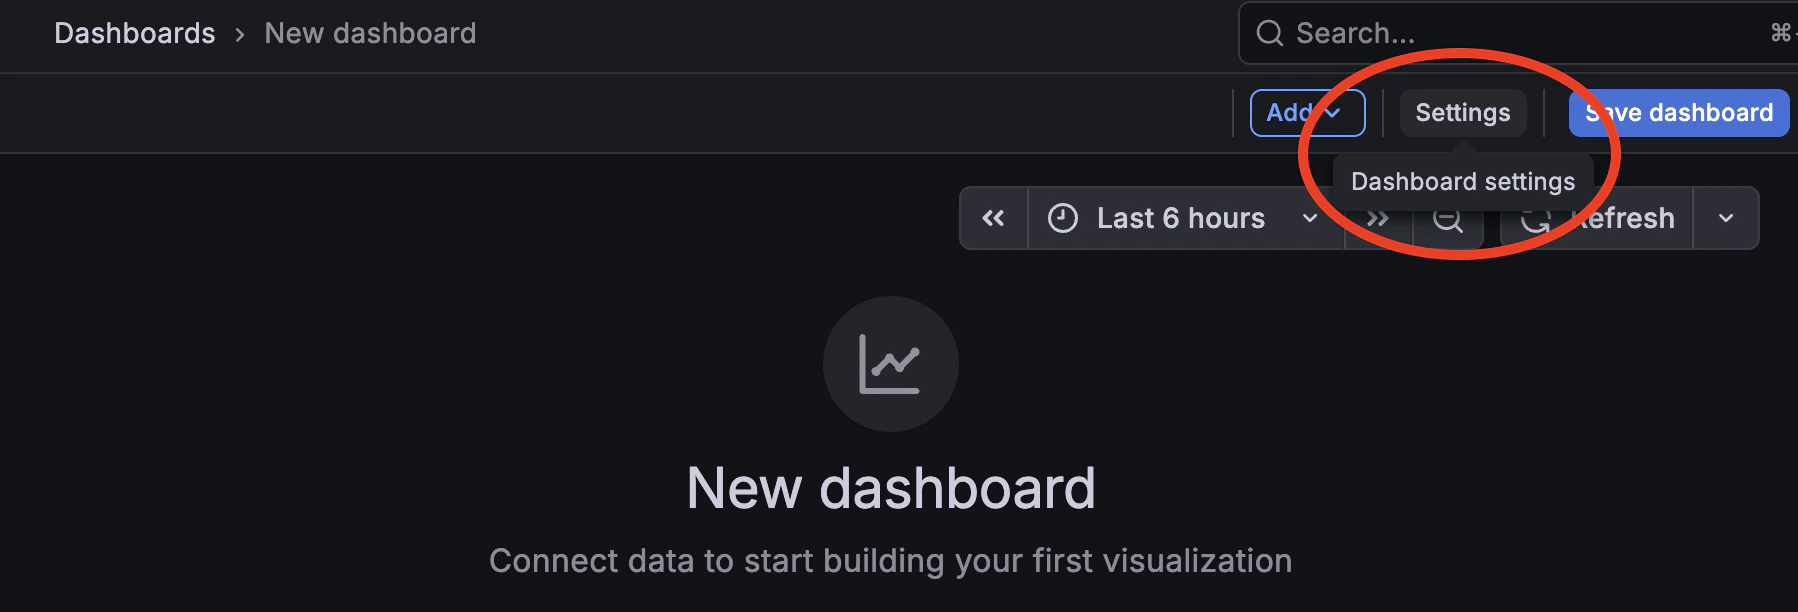
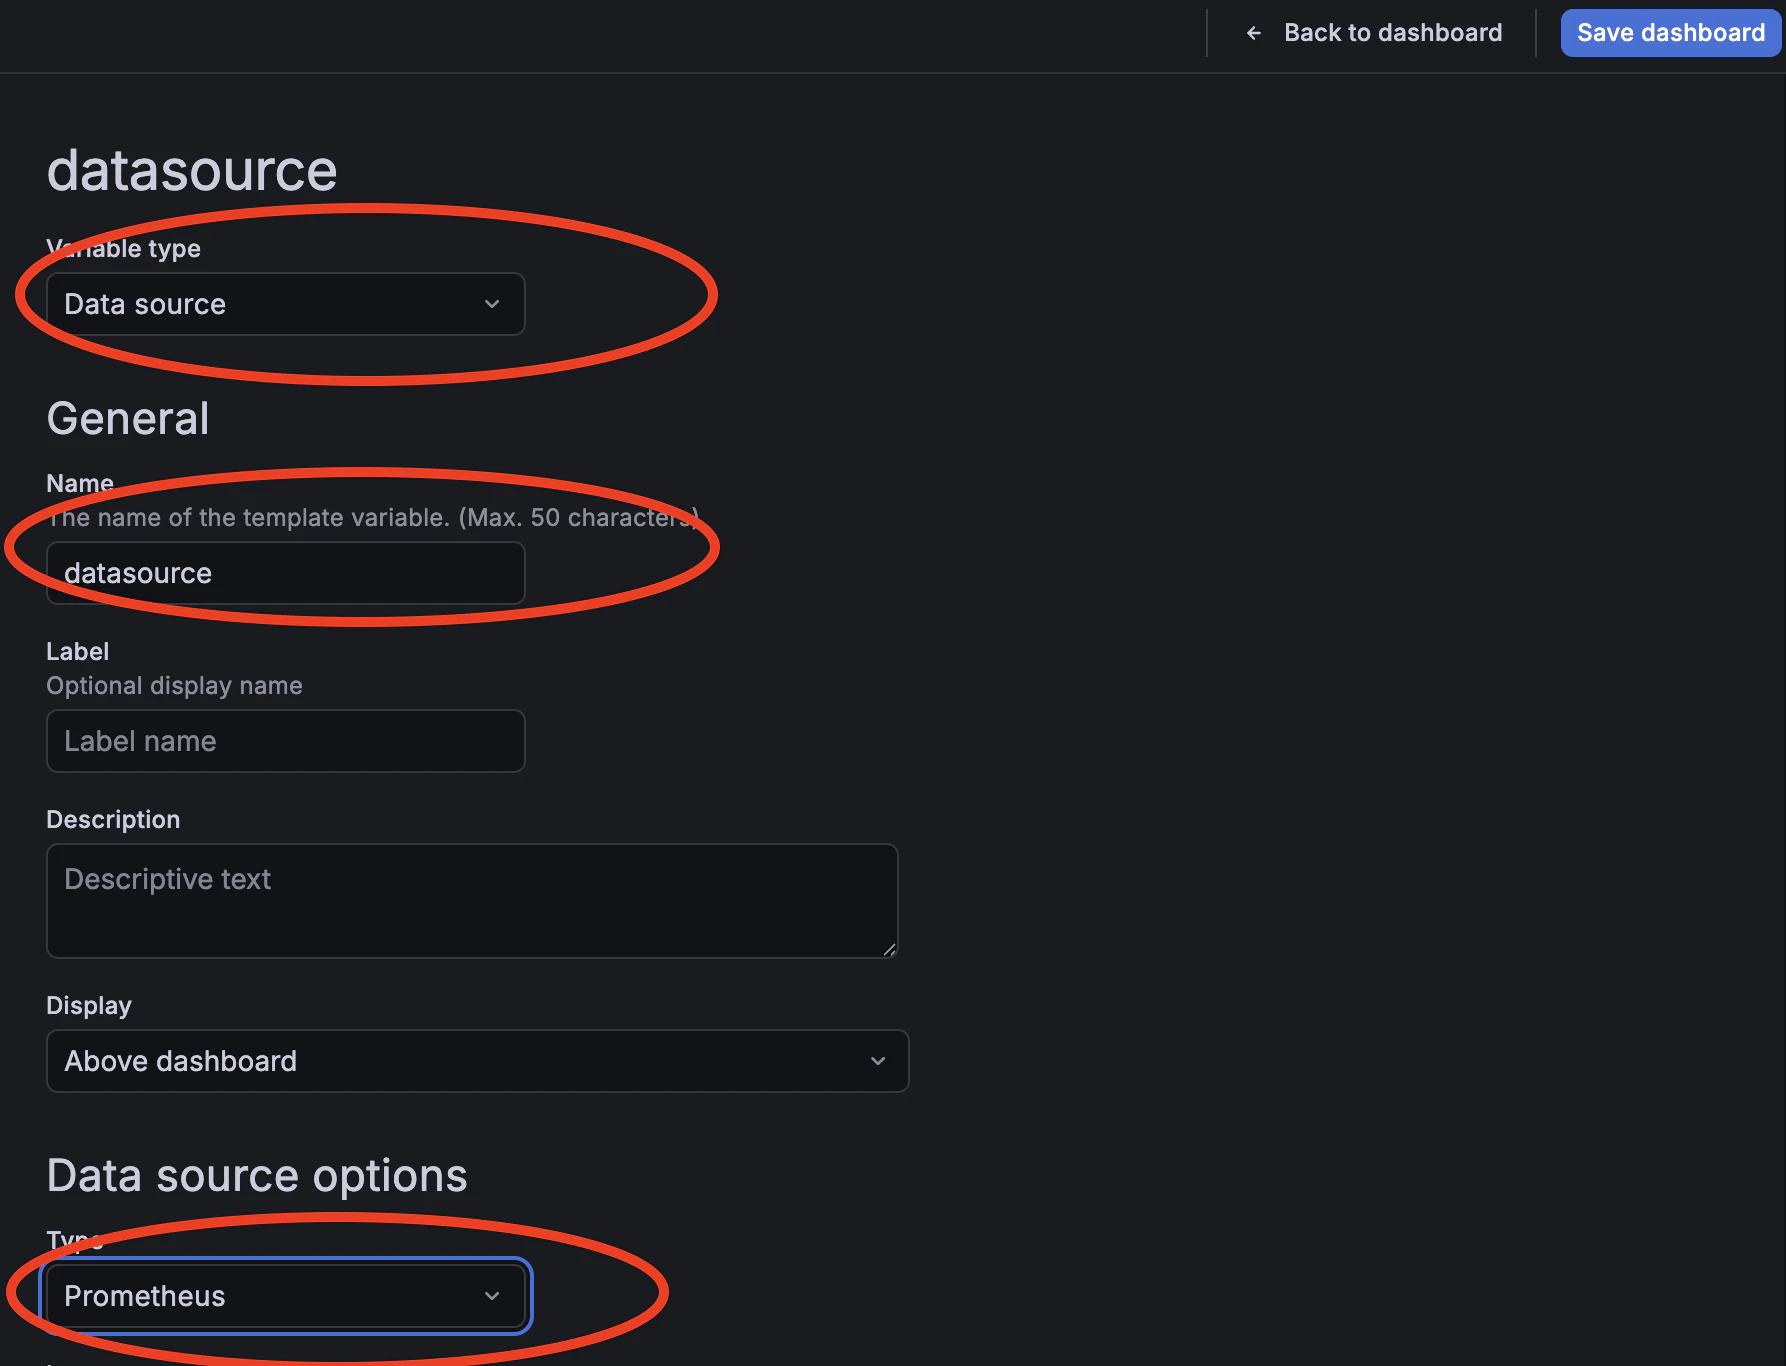
Open Dashboard settings → Variables → Add variable.
-
Set the following fields and click Save:
Step 2: Generate traffic
- Make a few tool calls through your MCP proxy to populate the metrics. If you need a quick way to generate traffic, use MCP Inspector with the Mock MCP Server; the full setup is covered in How to secure an MCP proxy. Once you have traffic flowing, come back here to build the dashboard.
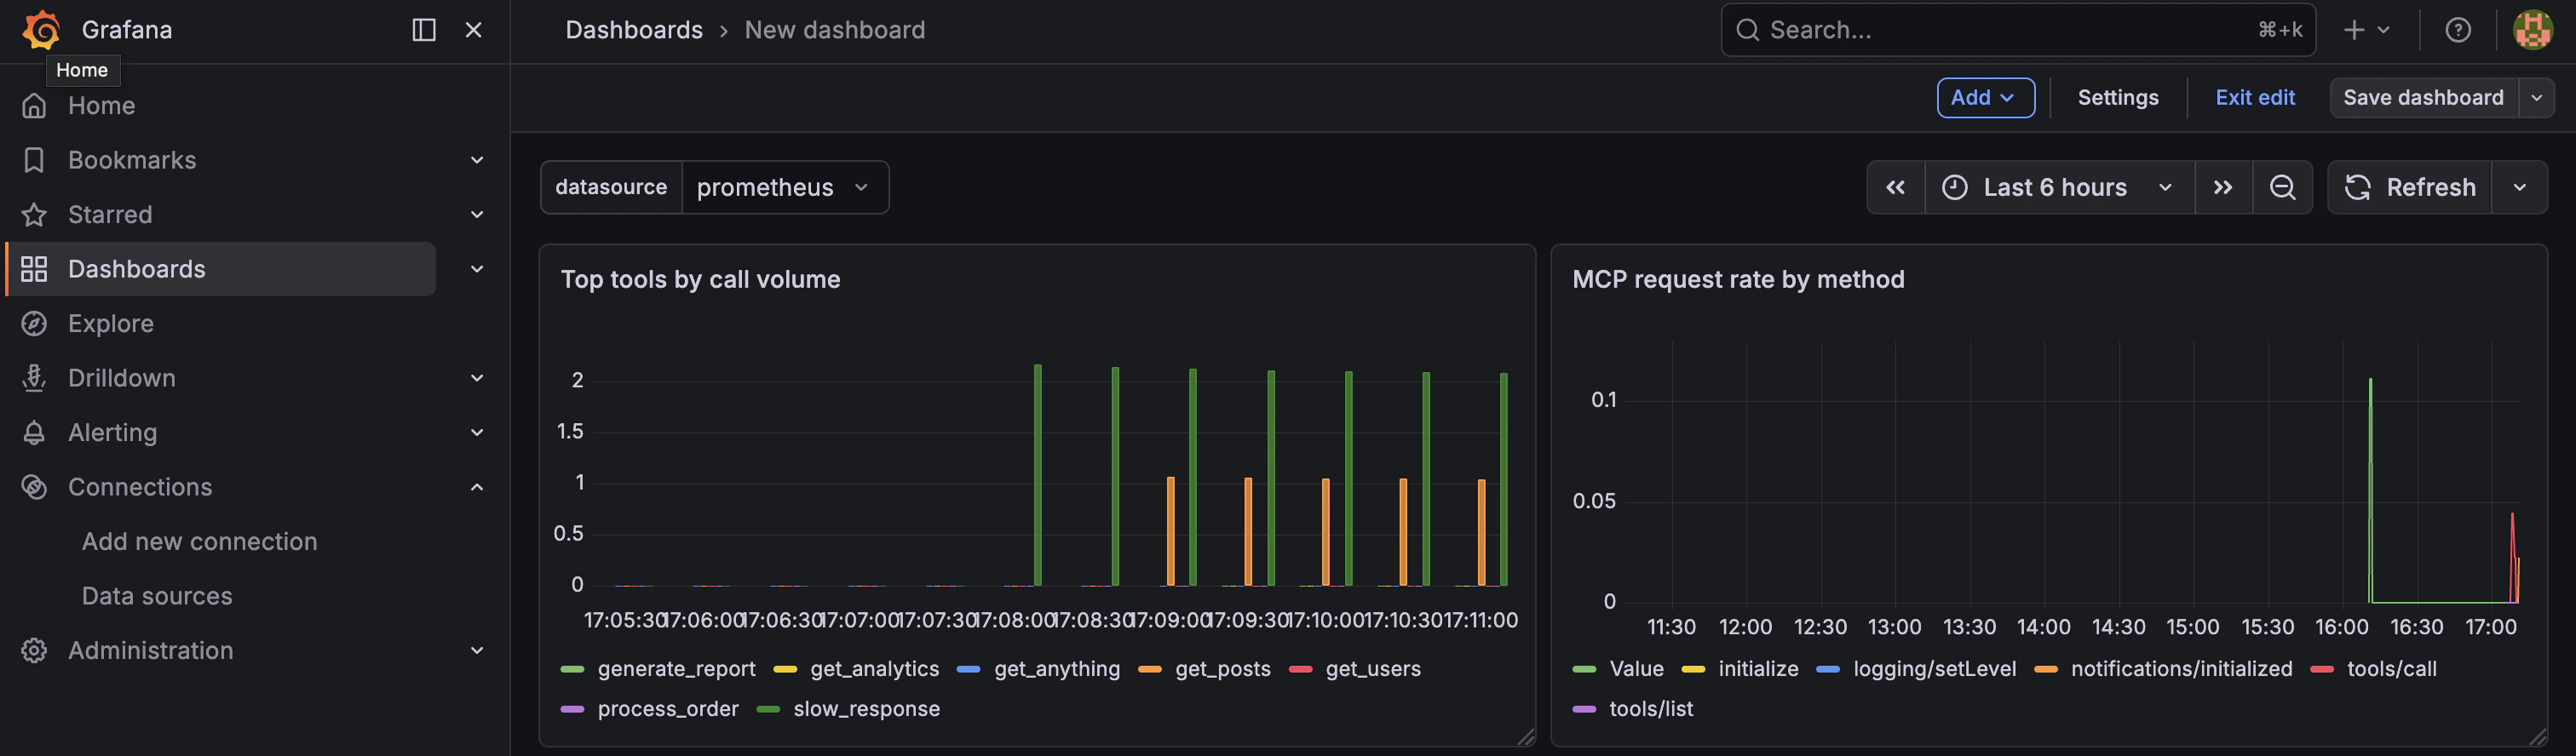
Step 3: Request rate by method
-
Click Add → Visualization and select Time series. Set the title to
MCP request rate by method. -
Set the PromQL query to:
-
Set the Legend to
{{mcp_method}}and click Apply.
$__rate_interval is a Grafana built-in variable that automatically selects an appropriate rate interval based on the dashboard time range and scrape interval. It produces more accurate rate calculations than a hardcoded interval such as [5m] and is the recommended choice for rate and histogram queries.Step 4: Error rate
-
Click Add → Visualization and select Stat. Set the title to
MCP error rate. -
Set the PromQL query to:
-
Set the Unit to
Percent (0-100). -
Configure thresholds and click Apply:
Step 5: Top tools by call volume
-
Click Add → Visualization and select Bar chart. Set the title to
Top tools by call volume. -
Set the PromQL query to:
-
Set the Legend to
{{tool_name}}and click Apply.
If the panel shows tool names but all counts are zero immediately after generating traffic, this is normal. The
increase() function requires at least two Prometheus scrapes to return a non-zero result. Wait for the second OTel export cycle (up to two minutes) and refresh the dashboard.