Traffic per API
To get a tabular view of how your API traffic is performing, you can select the Activity by API option in the navigation and see a tabular view of your APIs. This table will list out your APIs by their traffic volume and you’ll be able to see when they were last accessed:

You can use the same range selectors as with the Dashboard view to modify how you see the data. However, granularity and tag views will not work since they do not apply to a tabulated view.
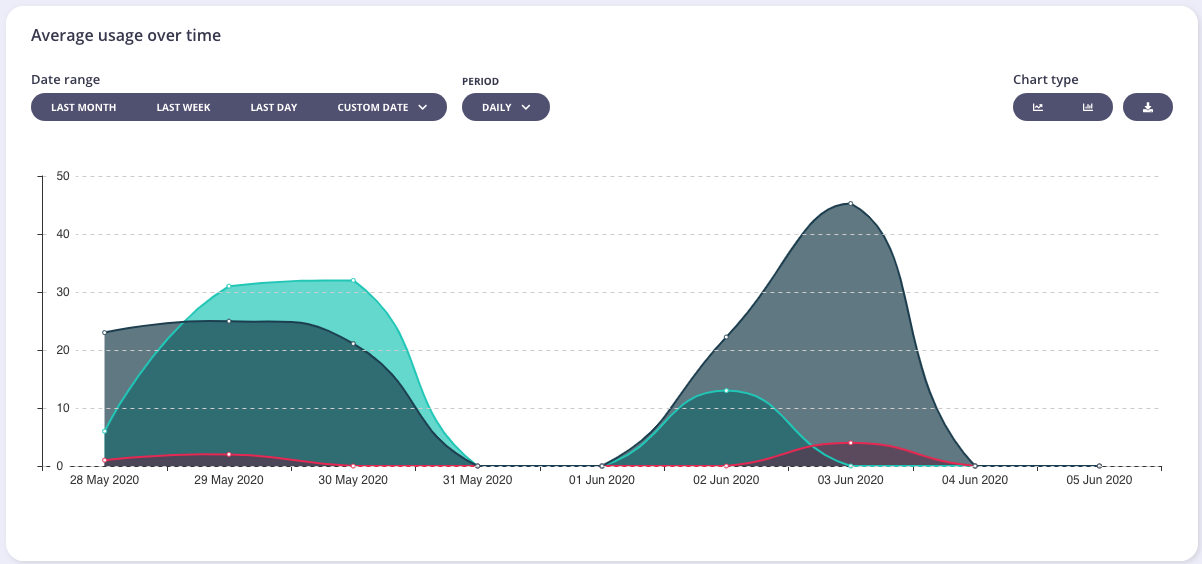
If you select an API name, you will be taken to the drill-down view for that specific API, here you will have a similar Dashboard as you do with the aggregate API Dashboard that you first visit on log in, but the whole view will be constrained to just the single API in question:

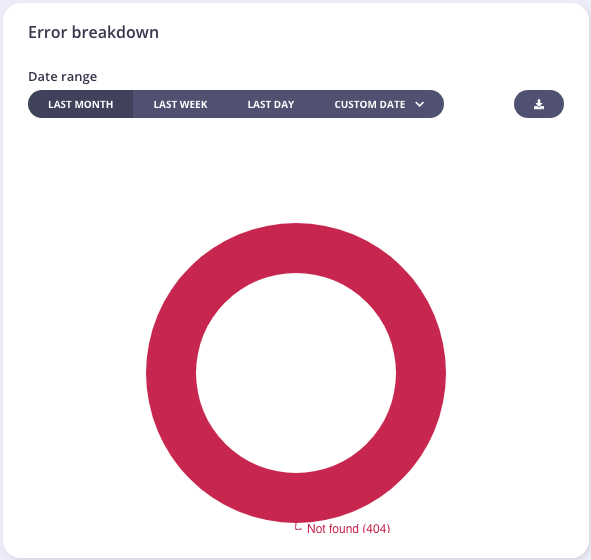
You will also see an error breakdown and the endpoint popularity stats for the API:

Tyk will try to normalise endpoint metrics by identifying IDs and UUIDs in a URL string and replacing them with normalised tags, this can help make your analytics more useful. It is possible to configure custom tags in the configuration file of your Tyk Self-Managed or Multi-Cloud installation.
Note
From Tyk v5.1 (and LTS patches v4.0.14 and v5.0.3) the Error Breakdown and Endpoint Popularity charts will not be visible to a user if they are assigned the Owned Analytics permission.
