What is the performance impact of analytics
Tyk Gateway allows analytics to be recorded and stored in a persistent data store (MongoDB/SQL) for all APIs by default, via Tyk Pump. Tyk Gateway generates transaction records for each API request and response, containing analytics data relating to: the originating host (where the request is coming from), which Tyk API version was used, the HTTP method requested and request path etc. The transaction records are transmitted to Redis and subsequently transferred to a persistent data store of your choice via Tyk Pump. Furthermore, Tyk Pump can also be configured to aggregate the transaction records (using different data keys - API ID, access key, endpoint, response status code, location) and write to a persistent data store. Tyk Dashboard uses this data for:- Aggregated analytics - Displaying analytics based on the aggregated data.
- Log Browser to display raw transaction records.
How Do Analytics Impact Performance?
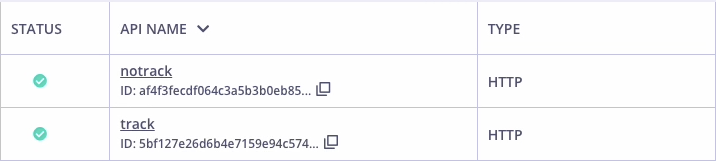
Analytics may introduce the problem of increased CPU load and a decrease in the number of requests per second (RPS). In the Tyk Dashboard API screen below, there are two APIs, track and notrack. The APIs were created to conduct a simple load test, to show the gateway’s RPS (requests per second) for each API:- track: Traffic to this API is tracked, i.e. transaction records are generated for each request/response.
- notrack: Traffic to this API is not tracked, i.e. transaction records are not generated for each request/response.
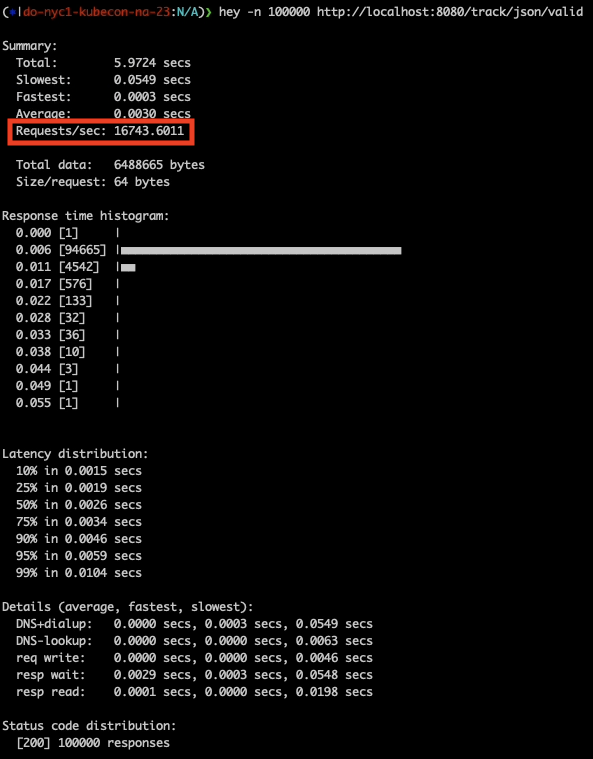
Tracked API Performance
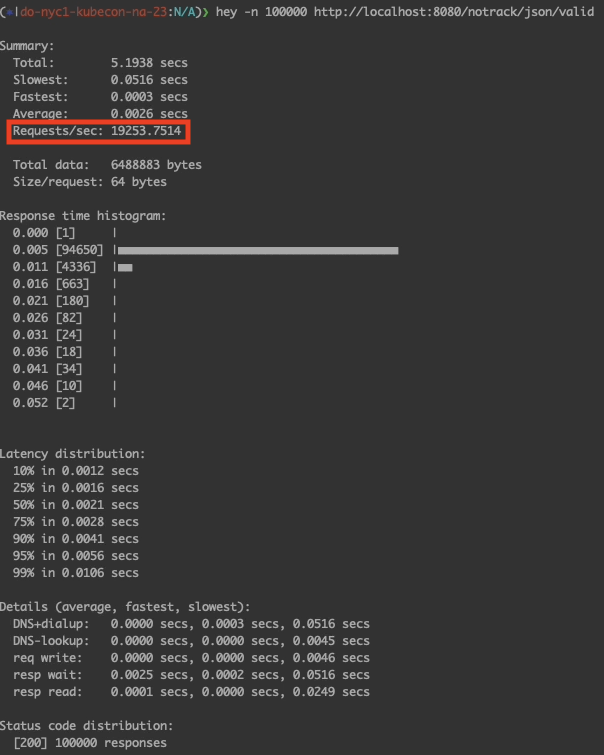
Untracked API Performance
Explaining the results
We can see that 19,253.75 RPS was recorded for the untracked API; with 16,743.6011 RPS reported for the tracked API. The number of requests per second decreased by ~13% when analytics was enabled.What Can Be Done To Address This Performance Impact?
Tyk is configurable, allowing fine grained control over which information should be recorded and which can be skipped, thus reducing CPU cycles, traffic and storage. Users can selectively prevent the generation of analytics for do_not_track middleware:- Per API: Tyk Gateway will not create records for requests/responses for any endpoints of an API.
- Per Endpoint: Tyk Gateway will not create records for requests/responses for specific endpoints.
Conclusion
Disabling the creation of analytics (either per API or for specific endpoints) helps to reduce CPU cycles and network requests for systems that exhibit high load and traffic, e.g. social media platforms, streaming, financial services and trading platforms. Application decisions need to be made concerning which endpoints are non critical and can thus have analytics disabled. Furthermore, benchmarking and testing will be required to evaluate the actual benefits for the application specific use case. Subsequently, it is worthwhile monitoring traffic and system load and using this feature to improve performance.What is the performance impact of OpenTelemetry metrics
Tyk Gateway can emit RED (Rate, Errors, Duration) metrics, Go runtime metrics, and distributed traces via OpenTelemetry. Enabling these signals adds a per-request cost that shows up as higher latency and resource usage, not as lost throughput. For a broader overview of what Tyk exposes, see Logs and Metrics. These numbers go alongside those in What is the performance impact of analytics. Most production deployments run both pipelines, and the costs add up rather than multiply.How do OTel metrics impact performance?
The figures below come from internal load tests on Tyk Gatewayv5.13.0 (GCP c2-standard-4, 30-minute runs at 15k rps against 10 routes, with a OpenTelemetry collector on a 5s export interval) and Go micro-benchmarks. Horizontal Pod Autoscaler was bounded to 2–12 pods and the fleet sat near the cap in every scenario (~11.8 pods on average), so pod counts were roughly constant across configurations. A higher HPA cap might absorb tracing overhead as extra pods rather than higher per-pod CPU, so treat the figures as an upper bound on per-instance cost.
- Default RED metrics are cheap. Compared to a baseline (OTel off) at 0.57 ms p75 and 25,259 rps, enabling default RED metrics raises p75 to 0.78 ms (+37%) and adds +4.6% mean CPU and +2.3% mean memory. Still sub-millisecond.
- Tracing is the expensive part. Adding tracing on top of metrics pushes p99 from 11.16 ms to 29.68 ms at 50% sampling, and to 35.53 ms at 100% sampling. CPU goes up ~27% and memory ~34% over baseline.
- Sampling has a floor. Dropping from 100% to 50% sampling saves about 17% at p99, but CPU and memory are identical at both rates. Most of the tracing cost is fixed: span context propagation and SDK overhead are paid even when a span is dropped.
- Runtime metrics are free. Adding Go runtime metrics on top of RED produces no measurable difference in either load tests or micro-benchmarks.
- Cardinality and instrument count scale flat. Going from 2 to 14 dimensions on a single counter, or from 1 to 6 instruments, keeps per-request overhead inside a +3% to +7% band
- Throughput holds. RPS stayed within ±1.5% of baseline across every configuration. The cost is in latency and resource usage, not in dropped requests.
| Configuration | p75 Δ | p99 Δ | CPU mean Δ | Memory mean Δ | RPS Δ |
|---|---|---|---|---|---|
| Baseline (OTel off, analytics off) — 0.57 ms p75 / 13.0 cores / 13.1 GiB / 25,259 rps | — | — | — | — | — |
| Analytics only | +28.1% | +78.5% | +6.9% | +1.5% | -1.0% |
| Metrics only (default RED) | +36.8% | +76.9% | +4.6% | +2.3% | -0.6% |
| Metrics + runtime | +17.5% | +26.2% | +2.3% | 0% | -0.7% |
| Metrics + tracing (50% sampling) + runtime | +189.5% | +235.7% | +29.2% | +34.4% | -0.9% |
| Full OTel: tracing (100%) + metrics + runtime | +173.7% | +301.9% | +30.0% | +34.4% | -1.4% |
| Metrics + analytics (Pump) | +31.6% | +100.1% | +12.3% | +6.1% | -1.1% |
What can be done to address this performance impact?
- Enable runtime metrics. They add GC, goroutine, and heap data at no measurable cost. The load test shows CPU +0.5% and memory +0% versus metrics-only. There’s no reason to leave them off.
- Treat custom metrics as a memory problem, not a CPU one. In load tests, 3 custom metric definitions across 50 routes pushed mean memory up +28% and peak memory up +32%, with no CPU change. Avoid high-cardinality label values like user IDs, JWT subjects, full URLs, or trace IDs. Each unique combination creates a new time series held in memory until export. Before adding custom metrics, estimate
routes × instruments × dimension cardinality. - Sample traces aggressively, but don’t expect linear savings. Configure opentelemetry.sampling.type as
TraceIDRatioBasedand set opentelemetry.sampling.rate to 0.05–0.1 for high-RPS gateways. Use opentelemetry.sampling.parent_based to keep spans coherent. See Sampling Strategies for all options. Since dropping from 100% to 50% only saves ~17% at p99 and nothing on CPU/memory, the real fix is to disable tracing for APIs that don’t need it. - Enable detailed tracing per API, not globally. The Tyk OAS API server.detailedTracing field (and its Tyk Classic equivalent) turns on middleware-level spans for specific APIs only. Use it to limit span volume to where it’s useful.
- Keep the default 5s export interval. Gateway-side cost stays under +5% even at 1,000 APIs. Changing the interval doesn’t help the gateway; it only shifts pressure to the collector. Tune opentelemetry.span_batch_config (
max_queue_size,max_export_batch_size,batch_timeout) only if traces are being dropped because the collector can’t keep up. - Don’t run both signal pipelines unless you need to. Running OTel metrics alongside Tyk analytics adds about +3% p75 and +12% p99 over analytics alone. If a Pump-driven Prometheus pipeline already covers your KPIs, the overlap may not be worth it.
- Avoid 100% trace sampling on high-RPS gateways. The worst-case configuration (full OTel at 100% sampling) hit +174% p75, +302% p99, +30% CPU, and +34% memory. Use head-based sampling at a low ratio, or limit tracing to a subset of APIs.
Conclusion
The default RED instruments and Go runtime metrics are safe to enable in production. The cost is small, throughput barely moves, and adding more dimensions or instruments doesn’t compound overhead. Tracing is the expensive part: the cost is largely fixed, and the only real way to eliminate it is to disable tracing, not to sample it low. Keep sample rates low, use per-API detailed tracing where possible, and size pod memory against your API count. For more detail on OTel configuration, see Distributed Tracing with OpenTelemetry and Sampling Strategies.How to reduce CPU usage in a Redis Cluster
What does high CPU usage in a Redis node within a Redis Cluster mean ?
When a single Redis node within a Redis Cluster exhibits high CPU usage, it indicates that the CPU resources of that particular node are being heavily utilized compared to others in the cluster. The illustration below highlights the scenario where a single Redis node is exhibiting high CPU usage of 1.20% within a Redis Cluster.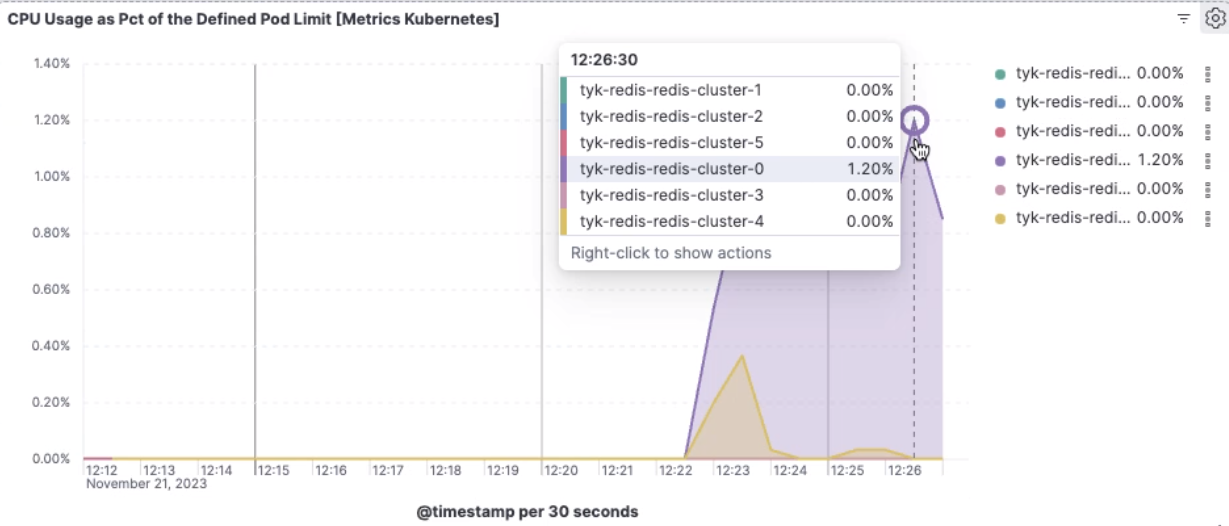
What could be causing this high CPU usage ?
One possible reason for high CPU usage in a single Redis node within a Redis Cluster is that analytics features are enabled and keys are being stored within that specific Redis node.How does storing keys within a single Redis server contribute to high CPU usage ?
A high volume of analytics traffic can decrease performance, since all analytics keys are stored within one Redis server. Storing keys within a single Redis server can lead to increased CPU usage because all operations related to those keys, such as retrieval, updates and analytics processing, are concentrated on that server. This can result in heavier computational loads on that particular node. This leads to high CPU usage.What can be done to address high CPU usage in this scenario ?
Consider distributing the analytics keys across multiple Redis nodes within the cluster. This can help distribute the computational load more evenly, reducing the strain on any single node and potentially alleviating the high CPU usage. In Redis, key sharding is a term used to describe the practice of distributing data across multiple Redis instances or shards based on the keys. This feature is provided by Redis Cluster and provides horizontal scalability and improved performance. Tyk supports configuring this behavior so that analytics keys are distributed across multiple servers within a Redis cluster. The image below illustrates that CPU usage is reduced across two Redis servers after making this configuration change.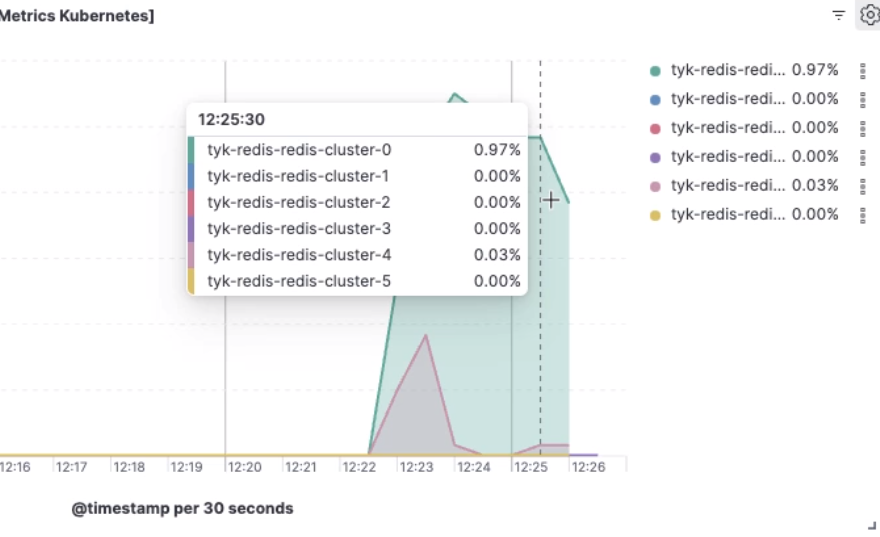
How do I configure Tyk to distribute analytics keys to multiple Redis shards ?
Follow these steps:-
Check that your Redis Cluster is correctly configured
Confirm that the
enable_clusterconfiguration option is set to true in the Tyk Gateway, Tyk Dashboard and Tyk Pump configuration files. This setting informs Tyk that a Redis Cluster is in use for key storage. Ensure that theaddrsarray is populated in the Tyk Gateway and Tyk Pump configuration files (tyk.conf and pump.conf) with the addresses of all Redis Cluster nodes. If you are using Tyk Self Managed (the licensed product), also update Tyk Dashboard configuration file (tyk_analytics.conf). This ensures that the Tyk components can interact with the entire Redis Cluster. Please refer to the configure Redis Cluster guide for further details. -
Configure Tyk to distribute analytics keys to multiple Redis shards
To distribute analytics keys across multiple Redis shards effectively you need to configure the Tyk components to leverage the Redis cluster’s sharding capabilities:
- Optimize Analytics Configuration: In the Tyk Gateway configuration (tyk.conf), set analytics_config.enable_multiple_analytics_keys to true. This option allows Tyk to distribute analytics data across Redis nodes, using multiple keys for the analytics. There’s a corresponding option for Self Managed MDCB, also named enable_multiple_analytics_keys. Useful only if the gateways in the data plane are configured to send analytics to MDCB.
- Optimize Connection Pool Settings: Adjust the optimization_max_idle and optimization_max_active settings in the configuration files to ensure that the connection pool can handle the analytics workload without overloading any Redis shard.
- Use a Separate Analytics Store: For high analytics traffic, you can opt to use a dedicated Redis Cluster for analytics by setting enable_separate_analytics_store to true in the Tyk Gateway configuration file (tyk.conf) and specifying the separate Redis cluster configuration in the
analytics_storagesection. Please consult the separated analytics storage guide for an example with Tyk Pump that can equally be applied to Tyk Gateway. - Review and Test: After implementing these changes, thoroughly review your configurations and conduct load testing to verify that the analytics traffic is now evenly distributed across all Redis shards.