Traffic Overview
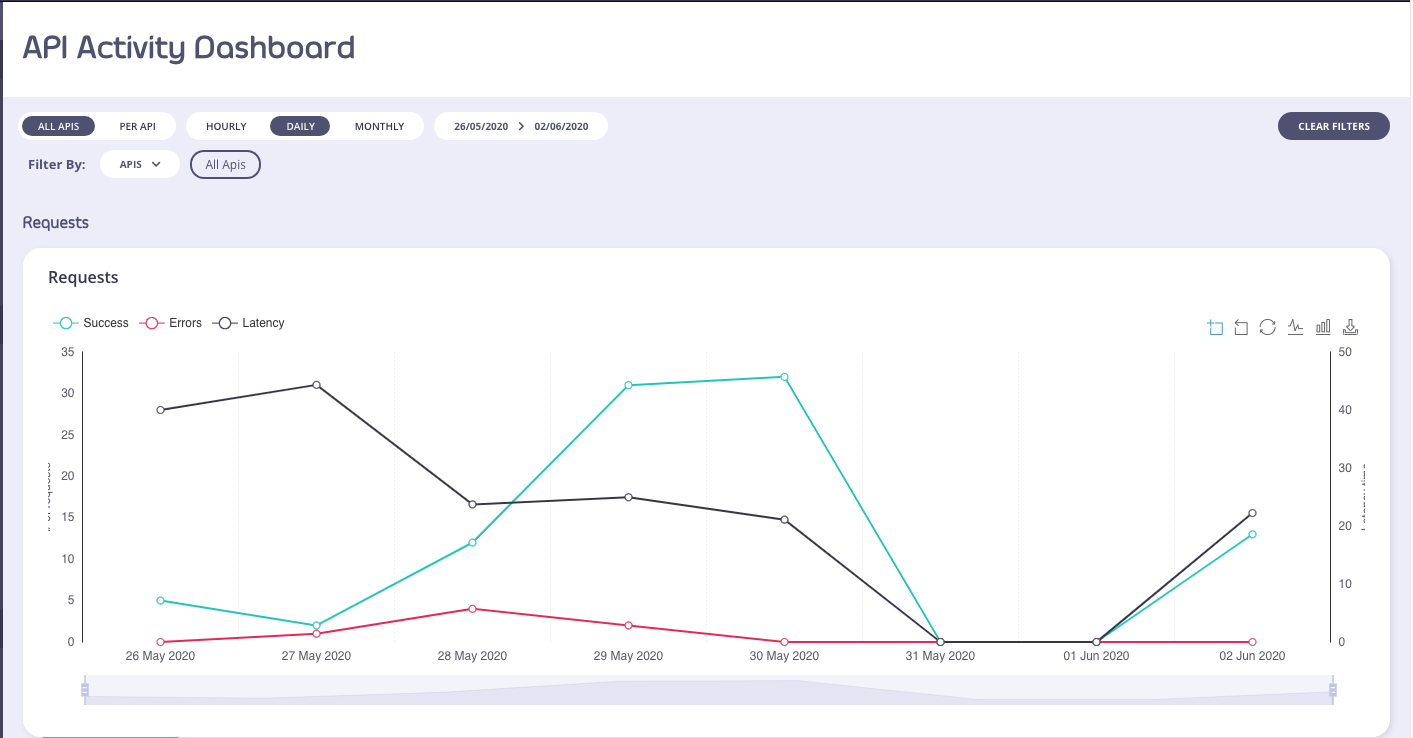
The first screen (and main view) of the Tyk Dashboard will show you an overview of the aggregate usage of your APIs, this view includes the number of hits, the number of errors and the average latency over time for all of your APIs as an average:

You can toggle the graphs by clicking the circular toggles above the graph to isolate only the stats you want to see.
Use the Start and End dates to set the range of the graph, and the version drop-down to select the API and version you wish to see traffic for.
You can change the granularity of the data by selecting the granularity drop down (in the above screenshot: it is set to “Day”).
The filter by tag option, in a graph view, will enable you to see the graph filtered by any tags you add to the search.
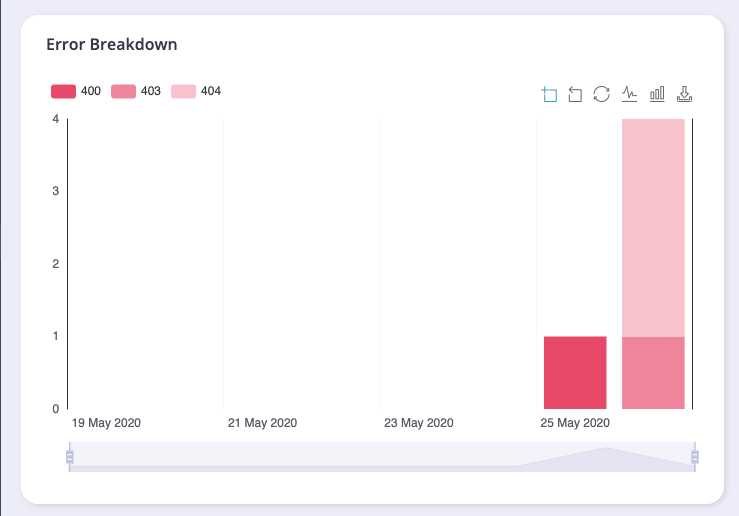
Below the aggregate graph, you’ll see an error breakdown and endpoint popularity chart. These charts will show you the overall error type (and code) for your APIs as an aggregate and the popularity of the endpoints that are being targeted by your clients:

