Availability
Tyk AI Studio incorporates an Analytics System designed to collect, aggregate, and provide insights into the usage, cost, and performance of the platform’s core components, particularly LLMs, Tools, and Chat interactions.
Purpose
The Analytics System serves several key purposes:- Cost Tracking: Monitor spending associated with different LLM providers and models.
- Usage Monitoring: Understand how users and applications are interacting with LLMs and Tools.
- Performance Analysis: Track metrics like latency and token counts for LLM requests.
- Auditing & Debugging: Provide detailed logs of interactions for troubleshooting and security analysis.
- Reporting: Offer data points for dashboards and reports for administrators and potentially end-users.
Data Collection
The primary point of data collection is the Proxy & API Gateway. As requests flow through the proxy:- Request Details: Information about the incoming request is captured (e.g., user ID, application ID, requested LLM/route, timestamp).
- LLM Interaction: Details about the interaction with the backend LLM are recorded (e.g., model used, prompt tokens, completion tokens, latency).
- Cost Calculation: Using data from the Model Pricing System, the cost of the interaction is calculated based on token counts.
- Tool Usage: If the interaction involved Tools, relevant details might be logged (e.g., which tool was called, success/failure).
- Chat Context: For interactions originating from the Chat Interface, metadata about the chat session might be included.
Edge Gateway Analytics Configuration
Important: Analytics must be explicitly enabled in the Edge Gateway configuration for data to appear in AI Studio dashboards. This is a common stumbling block when first deploying edge gateways.When enabled, the Edge Gateway batches analytics records and sends them back to AI Studio every few seconds (this interval is configurable). Without this configuration, AI Studio will have no visibility into gateway traffic. Ensure your Edge Gateway environment includes the appropriate analytics configuration. The default quickstart and packaged deployments enable this, but custom deployments may not. The analytics subsystem in the Edge Gateway also supports plugins, offering multiple ways to handle data:
- Each data class (Analytics, Logs, Budgets) can have its own processor
- Processors can either override or work in parallel with the default batch system
Architecture
- Asynchronous Ingestion: To minimize impact on request latency, analytics data is typically collected by the Proxy and sent asynchronously to a dedicated analytics database or processing pipeline.
- Data Storage: Analytics records are stored in the application’s relational database (PostgreSQL or SQLite, configured via environment variables). The same database used for other application data stores analytics records.
- API Endpoints: Tyk AI Studio exposes internal API endpoints that allow the Admin UI (and potentially other authorized services) to query the aggregated analytics data.
Key Metrics Tracked (Examples)
- Per LLM Request:
- Timestamp
- User ID / API Key ID
- LLM Configuration ID / Route ID
- Model Name
- Prompt Tokens
- Completion Tokens
- Total Tokens
- Calculated Cost
- Latency (ms)
- Success/Error Status
- Per Tool Call (if applicable):
- Timestamp
- Tool ID
- Success/Error Status
- Latency (ms)
- Aggregated Metrics:
- Total cost per user/application/LLM over time.
- Total requests per user/application/LLM over time.
- Average latency per LLM.
- Most frequently used models/tools.
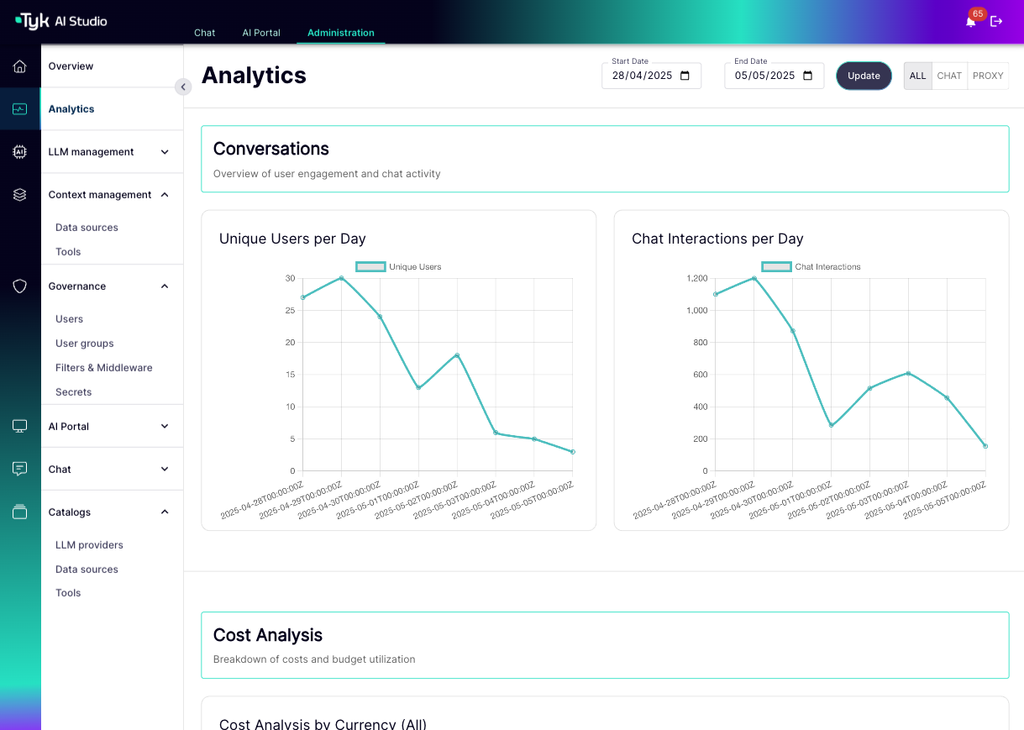
Monitoring & Dashboards (Admin)
Administrators typically access analytics data via dashboards within the Tyk AI Studio UI.- Overview: High-level summaries of cost, usage, and requests.
- Filtering & Grouping: Ability to filter data by time range, user, application, LLM configuration, etc.
- Visualizations: Charts and graphs showing trends in cost, token usage, request volume, and latency.
-
Detailed Logs: Access to raw or near-raw event logs for specific interactions (useful for debugging).
Per-LLM Attribution
From v2.1.0, proxy logs are attributed to the specific LLM configuration (llm_id) rather than the vendor string. Two LLM entries that share a vendor, for example a personal Anthropic key and a work Anthropic key, no longer cross-pollinate in the LLM detail page. Logs recorded before the upgrade have llm_id = 0 and do not appear in per-LLM detail views.
Compliance Dashboard
From v2.1.0, the Compliance dashboard (/admin/compliance) surfaces Compliance Events emitted by filter scripts alongside the existing blocked-request data:
- Summary Cards: Critical Events and Warning Events counts over the selected window, with trend arrows and configurable escalation thresholds.
- Policy Violations: the summary splits Blocked (4xx proxy logs) from Flagged (warning and critical events that passed through), and the timeline chart merges both streams.
- Filter Events Tab: severity totals with a stacked timeline chart, severity and event-type filters, expandable rows showing raw event metadata, and CSV export.
- App Risk: per-app risk scores are weighted by event severity, and the drill-down interleaves blocked requests with compliance events.
Prometheus and OpenTelemetry Metrics
From v2.1.0, both Tyk AI Studio and the Edge Gateway expose operational metrics on a Prometheus-compatible/metrics endpoint, with OpenTelemetry trace correlation through the analytics pipeline.
Metrics are enabled by default. To configure them:
The endpoint exposes the following metrics:
Point your Prometheus scrape configuration (or an OpenTelemetry Collector with a Prometheus receiver) at the
/metrics path of each component you want to monitor.
Integration with Other Systems
- Budget Control: Analytics data (specifically cost) is likely used by the Budget Control system to track spending against defined limits.
- Model Pricing: The pricing definitions are crucial for calculating the cost metric within the analytics system.