OpenTelemetry Instrumentation in Go Plugins
Last updated: 7 minutes read.
By instrumenting your custom plugins with Tyk’s OpenTelemetry library, you can gain additional insights into custom plugin behaviour like time spent and exit status. Read on to see some examples of creating span and setting attributes for your custom plugins.
Prerequisites
- Go v1.19 or higher
- Gateway instance with OpenTelemetry and DetailedTracing enabled:
Add this field within your Gateway config file:
{
  "opentelemetry": {
    "enabled": true
  }
}
And this field within your API definition:
{
  "detailed_tracing": true
}
You can find more information about enabling OpenTelemetry here.
Note
DetailedTracing must be enabled in the API definition to see the plugin spans in the traces.
In order to instrument our plugins we will be using Tyk’s OpenTelemetry library implementation. You can import it by running the following command:
$ go get github.com/TykTechnologies/opentelemetry
Note
In this case, we are using our own OpenTelemetry library for convenience. You can also use the Official OpenTelemetry Go SDK
Create a new span from the request context
trace.NewSpanFromContext() is a function that helps you create a new span from the current request context. When called, it returns two values: a fresh context with the newly created span embedded inside it, and the span itself. This method is particularly useful for tracing the execution of a piece of code within a web request, allowing you to measure and analyze its performance over time.
The function takes three parameters:
Context: This is usually the current request’s context. However, you can also derive a new context from it, complete with timeouts and cancellations, to suit your specific needs.TracerName: This is the identifier of the tracer that will be used to create the span. If you do not provide a name, the function will default to using thetyktracer.SpanName: This parameter is used to set an initial name for the child span that is created. This name can be helpful for later identifying and referencing the span.
Here’s an example of how you can use this function to create a new span from the current request context:
package main
import (
    "net/http"
    "github.com/TykTechnologies/opentelemetry/trace"
)
// AddFooBarHeader adds a custom header to the request.
func AddFooBarHeader(rw http.ResponseWriter, r *http.Request) {
    // We create a new span using the context from the incoming request.
    _, newSpan := trace.NewSpanFromContext(r.Context(), "", "GoPlugin_first-span")
    // Ensure that the span is properly ended when the function completes.
    defer newSpan.End()
    // Add a custom "Foo: Bar" header to the request.
    r.Header.Add("Foo", "Bar")
}
func main() {}
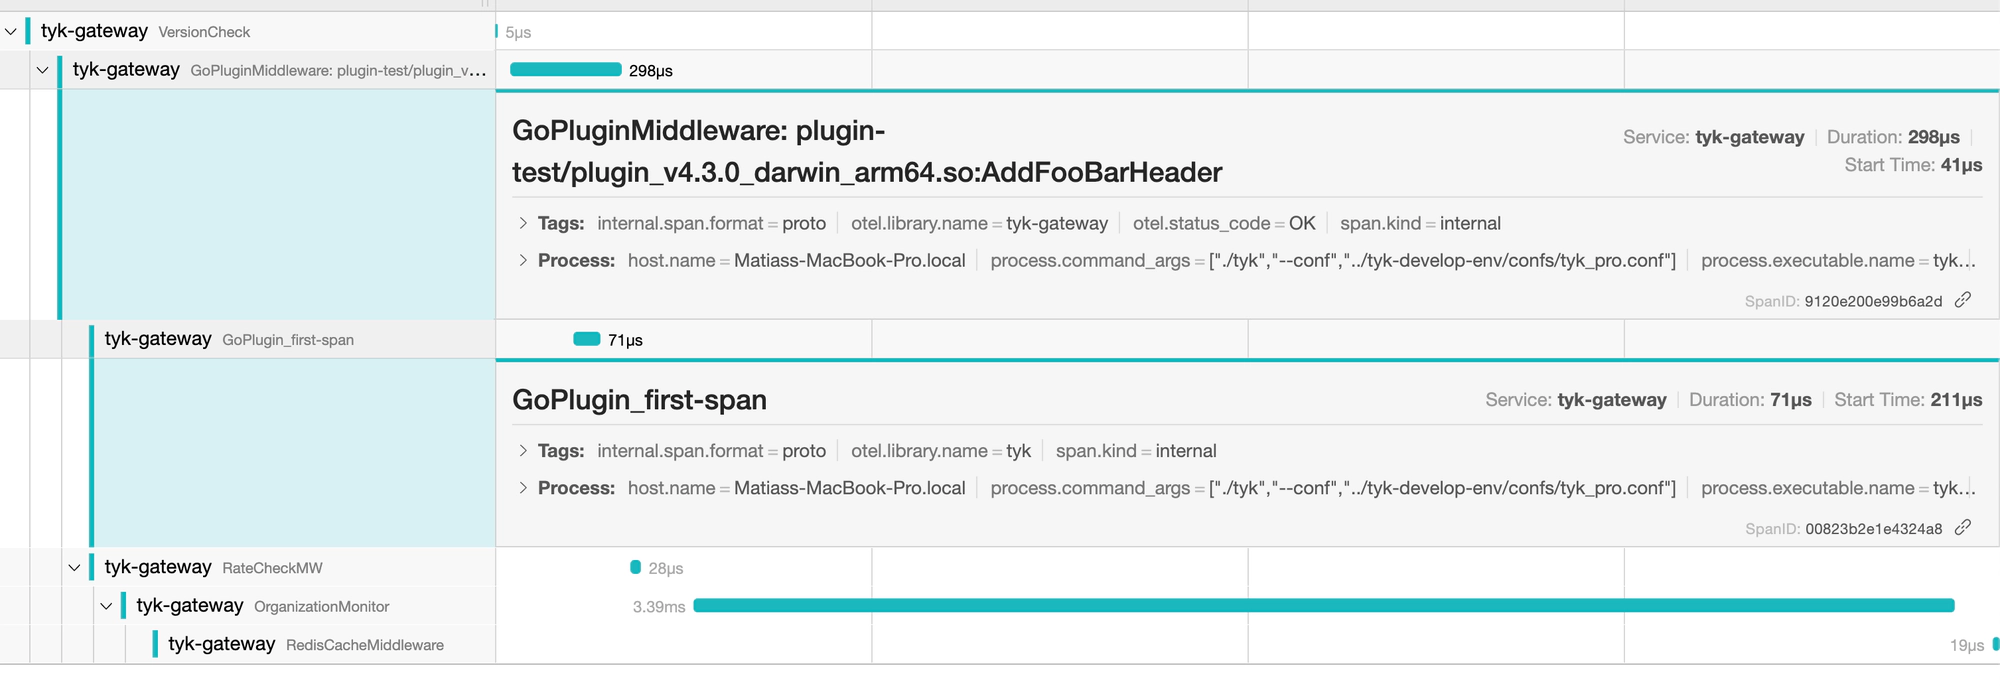
In your exporter (in this case, Jaeger) you should see something like this:

As you can see, the name we set is present: GoPlugin_first-span and it’s the first child of the GoPluginMiddleware span.
Modifying span name and set status
The span created using trace.NewSpanFromContext() can be further configured after its creation. You can modify its name and set its status:
func AddFooBarHeader(rw http.ResponseWriter, r *http.Request) {
	_, newSpan := trace.NewSpanFromContext(r.Context(), "", "GoPlugin_first-span")
	defer newSpan.End()

	// Set a new name for the span.
	newSpan.SetName("AddFooBarHeader Testing")

	// Set the status of the span.
	newSpan.SetStatus(trace.SPAN_STATUS_OK, "")

	r.Header.Add("Foo", "Bar")
}
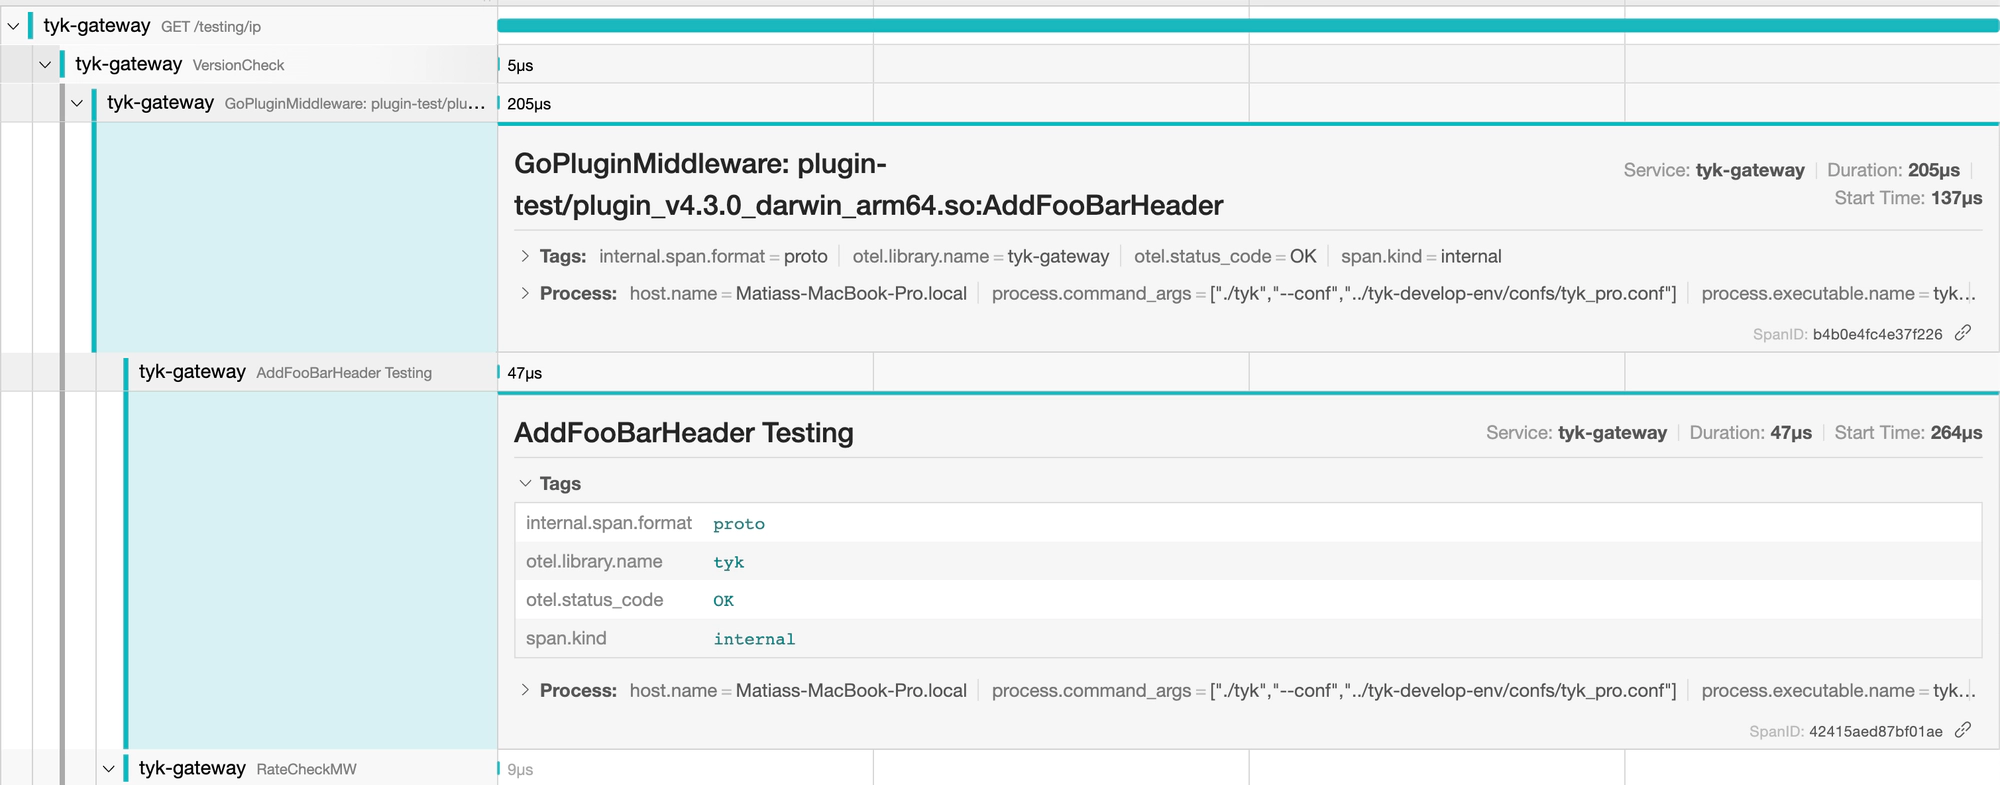
This updated span will then appear in the traces as AddFooBarHeader Testing with an OK Status.
The second parameter of the SetStatus method can accept a description parameter that is valid for ERROR statuses.
The available span statuses in ascending hierarchical order are:
-
SPAN_STATUS_UNSET -
SPAN_STATUS_ERROR -
SPAN_STATUS_OK
This order is important: a span with an OK status cannot be overridden with an ERROR status. However, the reverse is possible - a span initially marked as UNSET or ERROR can later be updated to OK.

Now we can see the new name and the otel.status_code tag with the OK status.
Setting attributes
The SetAttributes() function allows you to set attributes on your spans, enriching each trace with additional, context-specific information.
The following example illustrates this functionality using the OpenTelemetry library’s implementation by Tyk
func AddFooBarHeader(rw http.ResponseWriter, r *http.Request) {
	_, newSpan := trace.NewSpanFromContext(r.Context(), "", "GoPlugin_first-span")
	defer newSpan.End()

    // Set an attribute on the span.
	newSpan.SetAttributes(trace.NewAttribute("go_plugin", "1"))

	r.Header.Add("Foo", "Bar")
}
In the above code snippet, we set an attribute go_plugin with a value of 1 on the span. This is just a demonstration; in practice, you might want to set attributes that carry meaningful data relevant to your tracing needs.
Attributes are key-value pairs. The value isn’t restricted to string data types; it can be any value, including numerical, boolean, or even complex data types, depending on your requirements. This provides flexibility and allows you to include rich, structured data within your spans.
The illustration below, shows how the go_plugin attribute looks in Jaeger:

Multiple functions = Multiple spans
To effectively trace the execution of your plugin, you can create additional spans for each function execution. By using context propagation, you can link these spans, creating a detailed trace that covers multiple function calls. This allows you to better understand the sequence of operations, pinpoint performance bottlenecks, and analyze application behaviour.
Here’s how you can implement it:
func AddFooBarHeader(rw http.ResponseWriter, r *http.Request) {
	// Start a new span for this function.
	ctx, newSpan := trace.NewSpanFromContext(r.Context(), "", "GoPlugin_first-span")
	defer newSpan.End()

	// Set an attribute on this span.
	newSpan.SetAttributes(trace.NewAttribute("go_plugin", "1"))

	// Call another function, passing in the context (which includes the new span).
	NewFunc(ctx)

	// Add a custom "Foo: Bar" header to the request.
	r.Header.Add("Foo", "Bar")
}

func NewFunc(ctx context.Context) {
	// Start a new span for this function, using the context passed from the calling function.
	_, newSpan := trace.NewSpanFromContext(ctx, "", "GoPlugin_second-span")
	defer newSpan.End()

	// Simulate some processing time.
	time.Sleep(1 * time.Second)

	// Set an attribute on this span.
	newSpan.SetAttributes(trace.NewAttribute("go_plugin", "2"))
}
In this example, the AddFooBarHeader function creates a span and then calls NewFunc, passing the updated context. The NewFunc function starts a new span of its own, linked to the original through the context. It also simulates some processing time by sleeping for 1 second, then sets a new attribute on the second span. In a real-world scenario, the NewFunc would contain actual code logic to be executed.
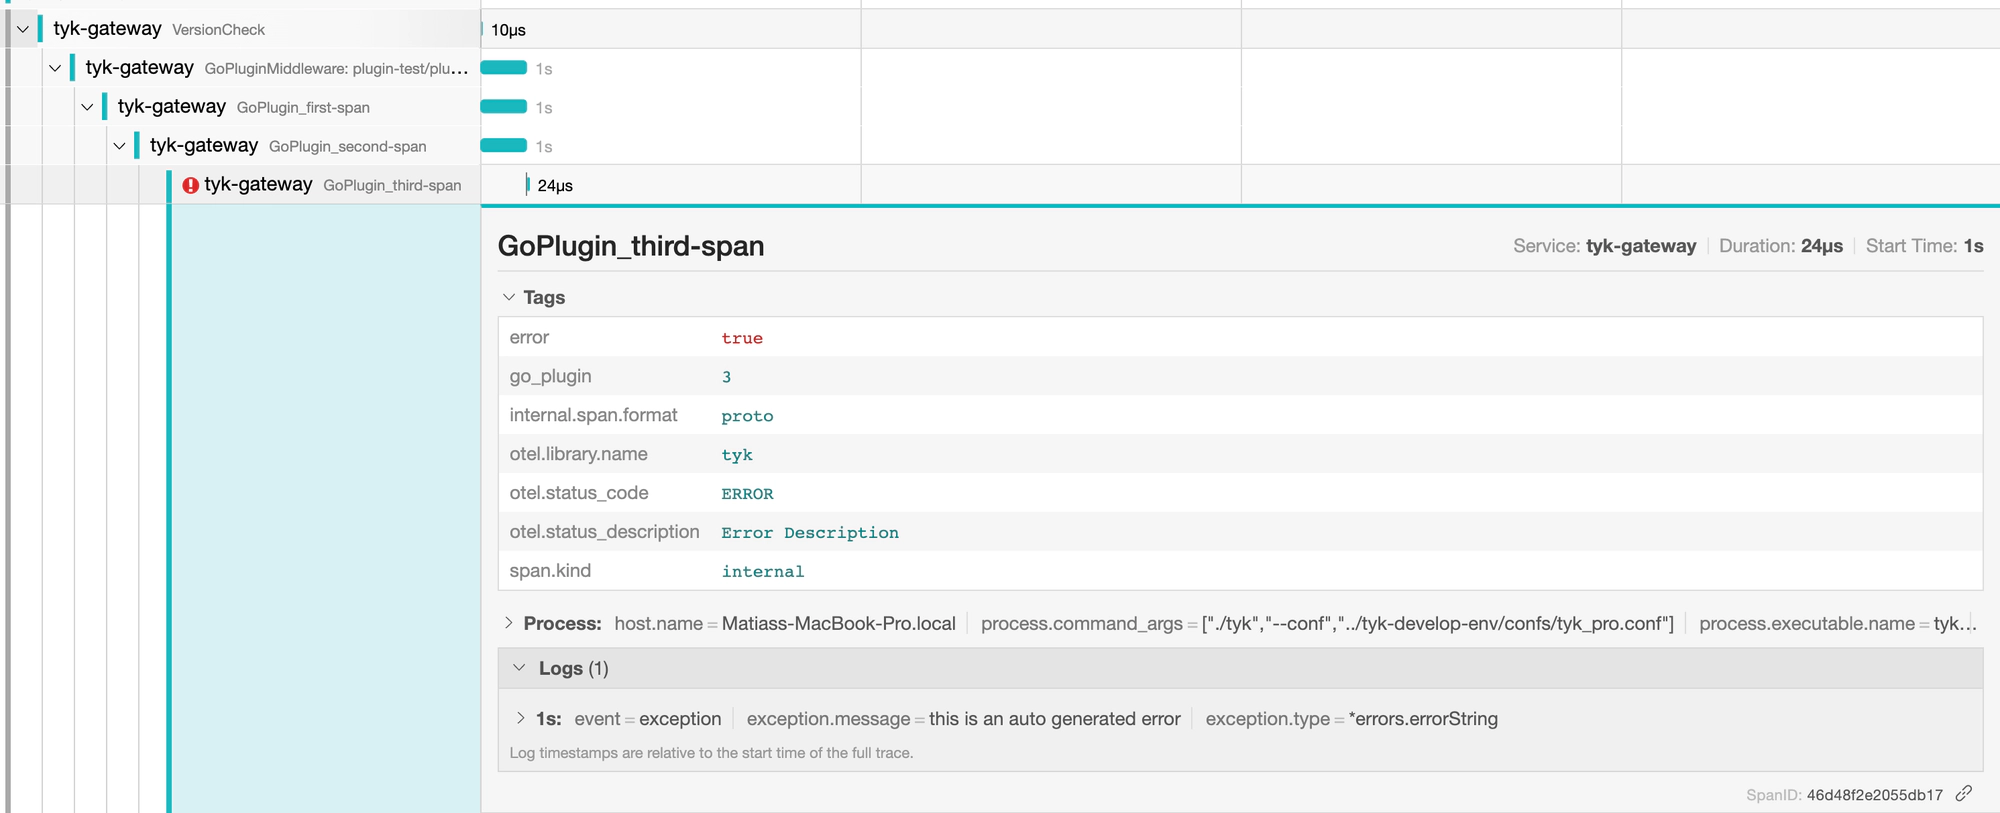
The illustration below, shows how this new child looks in Jaeger:

Error handling
In OpenTelemetry, it’s essential to understand the distinction between recording an error and setting the span status to error. The RecordError() function records an error as an exception span event. However, this alone doesn’t change the span’s status to error. To mark the span as error, you need to make an additional call to the SetStatus() function.
RecordError will record err as an exception span event for this span. An additional call to SetStatus is required if the Status of the Span should be set to Error, as this method does not change the Span status. If this span is not being recorded or err is nil then this method does nothing.
Here’s an illustrative example with function calls generating a new span, setting attributes, setting an error status, and recording an error:
func AddFooBarHeader(rw http.ResponseWriter, r *http.Request) {
	// Create a new span for this function.
	ctx, newSpan := trace.NewSpanFromContext(r.Context(), "", "GoPlugin_first-span")
	defer newSpan.End()

	// Set an attribute on the new span.
	newSpan.SetAttributes(trace.NewAttribute("go_plugin", "1"))

	// Call another function, passing in the updated context.
	NewFunc(ctx)

	// Add a custom header "Foo: Bar" to the request.
	r.Header.Add("Foo", "Bar")
}

func NewFunc(ctx context.Context) {
	// Create a new span using the context passed from the previous function.
	ctx, newSpan := trace.NewSpanFromContext(ctx, "", "GoPlugin_second-span")
	defer newSpan.End()

	// Simulate some processing time.
	time.Sleep(1 * time.Second)

	// Set an attribute on the new span.
	newSpan.SetAttributes(trace.NewAttribute("go_plugin", "2"))

	// Call a function that will record an error and set the span status to error.
	NewFuncWithError(ctx)
}

func NewFuncWithError(ctx context.Context) {
	// Start a new span using the context passed from the previous function.
	_, newSpan := trace.NewSpanFromContext(ctx, "", "GoPlugin_third-span")
	defer newSpan.End()

	// Set status to error.
	newSpan.SetStatus(trace.SPAN_STATUS_ERROR, "Error Description")

	// Set an attribute on the new span.
	newSpan.SetAttributes(trace.NewAttribute("go_plugin", "3"))

	// Record an error in the span.
	newSpan.RecordError(errors.New("this is an auto-generated error"))
}
In the above code, the NewFuncWithError function demonstrates error handling in OpenTelemetry. First, it creates a new span. Then it sets the status to error, and adds an attribute. Finally, it uses RecordError() to log an error event. This two-step process ensures that both the error event is recorded and the span status is set to reflect the error.
