Setup Prometheus Pump
Introduction
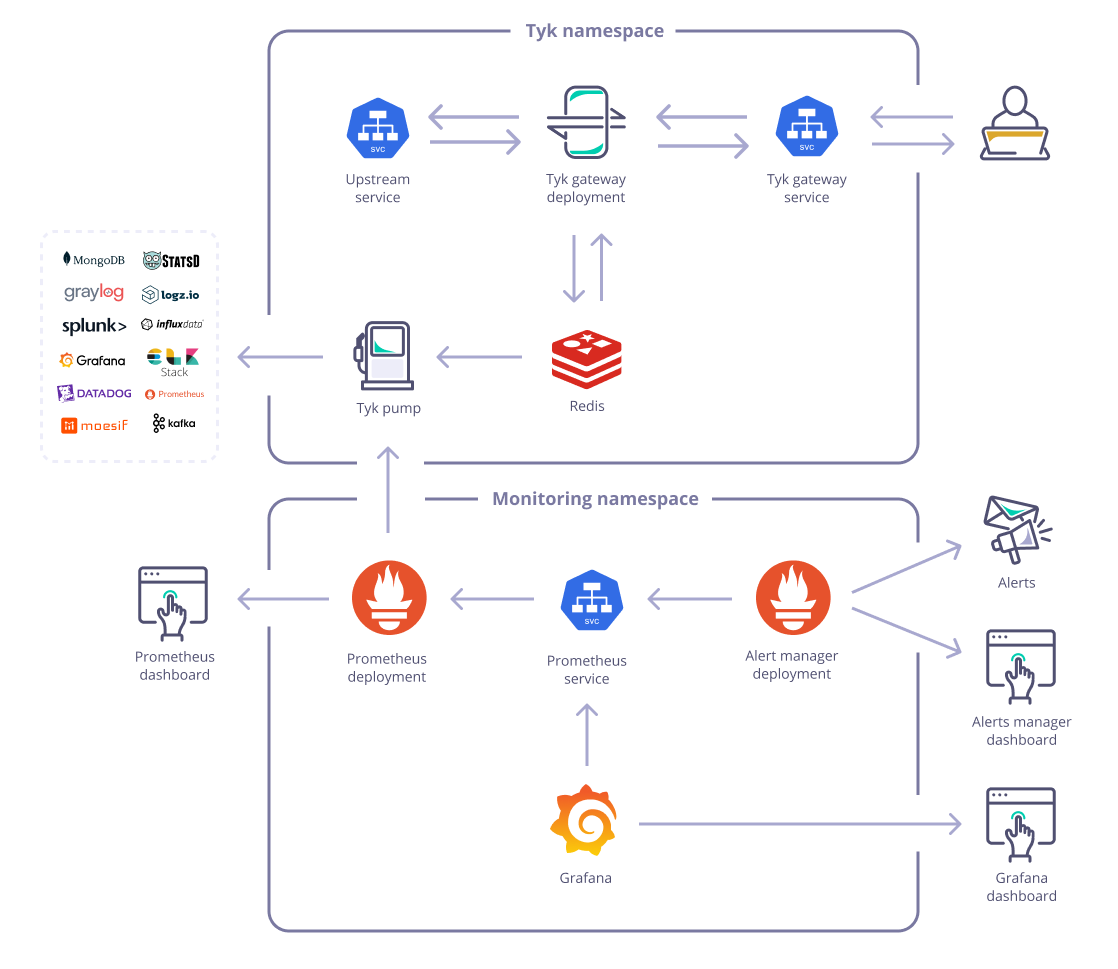
We’ll show you how to setup Tyk Pump for Prometheus Service Discovery.

Example: Integrate with Prometheus using Prometheus Operator
1. Setup Prometheus
Using the prometheus-community/kube-prometheus-stack chart
In this example, we use kube-prometheus-stack, which installs a collection of Kubernetes manifests, Grafana dashboards, and Prometheus rules combined with documentation and scripts to provide easy to operate end-to-end Kubernetes cluster monitoring with Prometheus using the Prometheus Operator.
helm install prometheus-stack prometheus-community/kube-prometheus-stack -n monitoring --create-namespace
This is a useful stack where you can get Prometheus, the Prometheus Operator, and Grafana all deployed and configured in one go.
2. Install Tyk Pump with PodMonitor
If you have Prometheus Operator enabled on the cluster, it would look for “PodMonitor” or “ServiceMonitor” resources and scrap from specified port. The only thing you would need to modify here is the helm release name for Prometheus Operator.
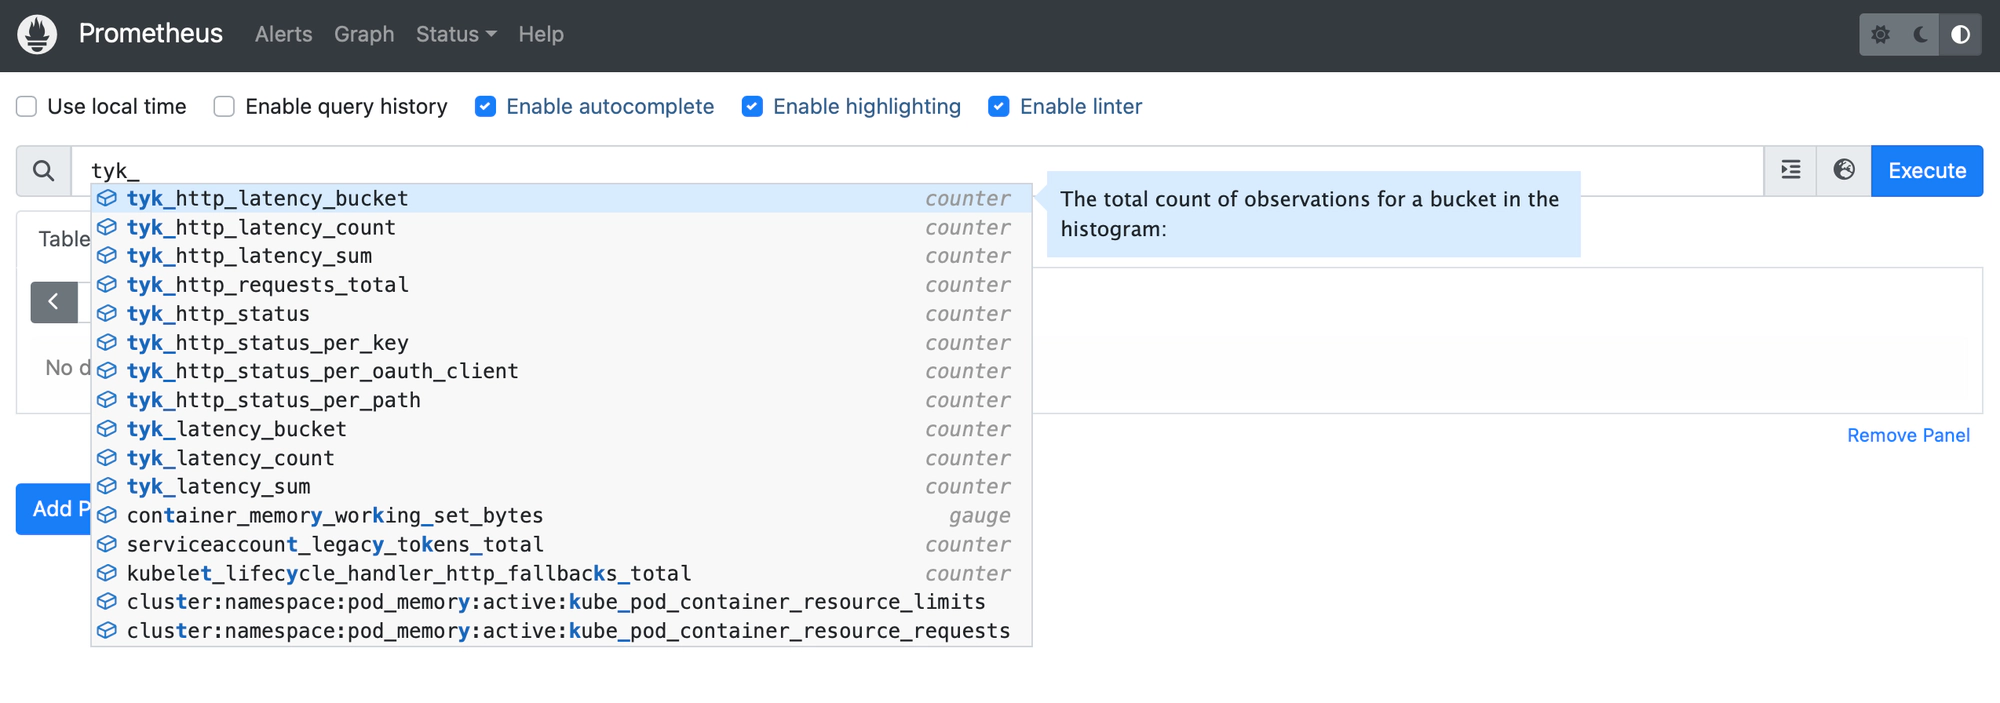
Also you can customise Prometheus Custom Metrics based on your analytics needs. We are using tyk_http_requests_total and tyk_http_latency described here for illustration:
NAMESPACE=tyk-oss
APISecret=foo
PromOperator_Release=prometheus-stack
Prometheus_Custom_Metrics='[{"name":"tyk_http_requests_total"\,"description":"Total of API requests"\,"metric_type":"counter"\,"labels":["response_code"\,"api_name"\,"method"\,"api_key"\,"alias"\,"path"]}\,          {              "name":"tyk_http_latency"\,              "description":"Latency of API requests"\,              "metric_type":"histogram"\,              "labels":["type"\,"response_code"\,"api_name"\,"method"\,"api_key"\,"alias"\,"path"]          }]'

helm upgrade tyk-redis oci://registry-1.docker.io/bitnamicharts/redis -n $NAMESPACE --create-namespace --install --set image.tag=6.2.13

helm upgrade tyk-oss tyk-helm/tyk-oss -n $NAMESPACE --create-namespace \
  --install \
  --set global.secrets.APISecret="$APISecret" \
  --set global.redis.addrs="{tyk-redis-master.$NAMESPACE.svc.cluster.local:6379}" \
  --set global.redis.passSecret.name=tyk-redis \
  --set global.redis.passSecret.keyName=redis-password \
  --set global.components.pump=true \
  --set "tyk-pump.pump.backend={prometheus}" \
  --set tyk-pump.pump.prometheusPump.customMetrics=$Prometheus_Custom_Metrics \
  --set tyk-pump.pump.prometheusPump.prometheusOperator.enabled=true \
  --set tyk-pump.pump.prometheusPump.prometheusOperator.podMonitorSelector.release=$PromOperator_Release
Note
For Custom Metrics, commas are escaped to be used in helm –set command. You can remove the backslashes in front of the commas if you are to set it in values.yaml. We have included an example in the default values.yaml comments section.
3. Verification
When successfully configured, you could see the following messages in pump log:
│ time="Jun 26 13:11:01" level=info msg="Starting prometheus listener on::9090" prefix=prometheus-pump                                                  │
│ time="Jun 26 13:11:01" level=info msg="Prometheus Pump Initialized" prefix=prometheus-pump                                                            │
│ time="Jun 26 13:11:01" level=info msg="Init Pump: PROMETHEUS" prefix=main
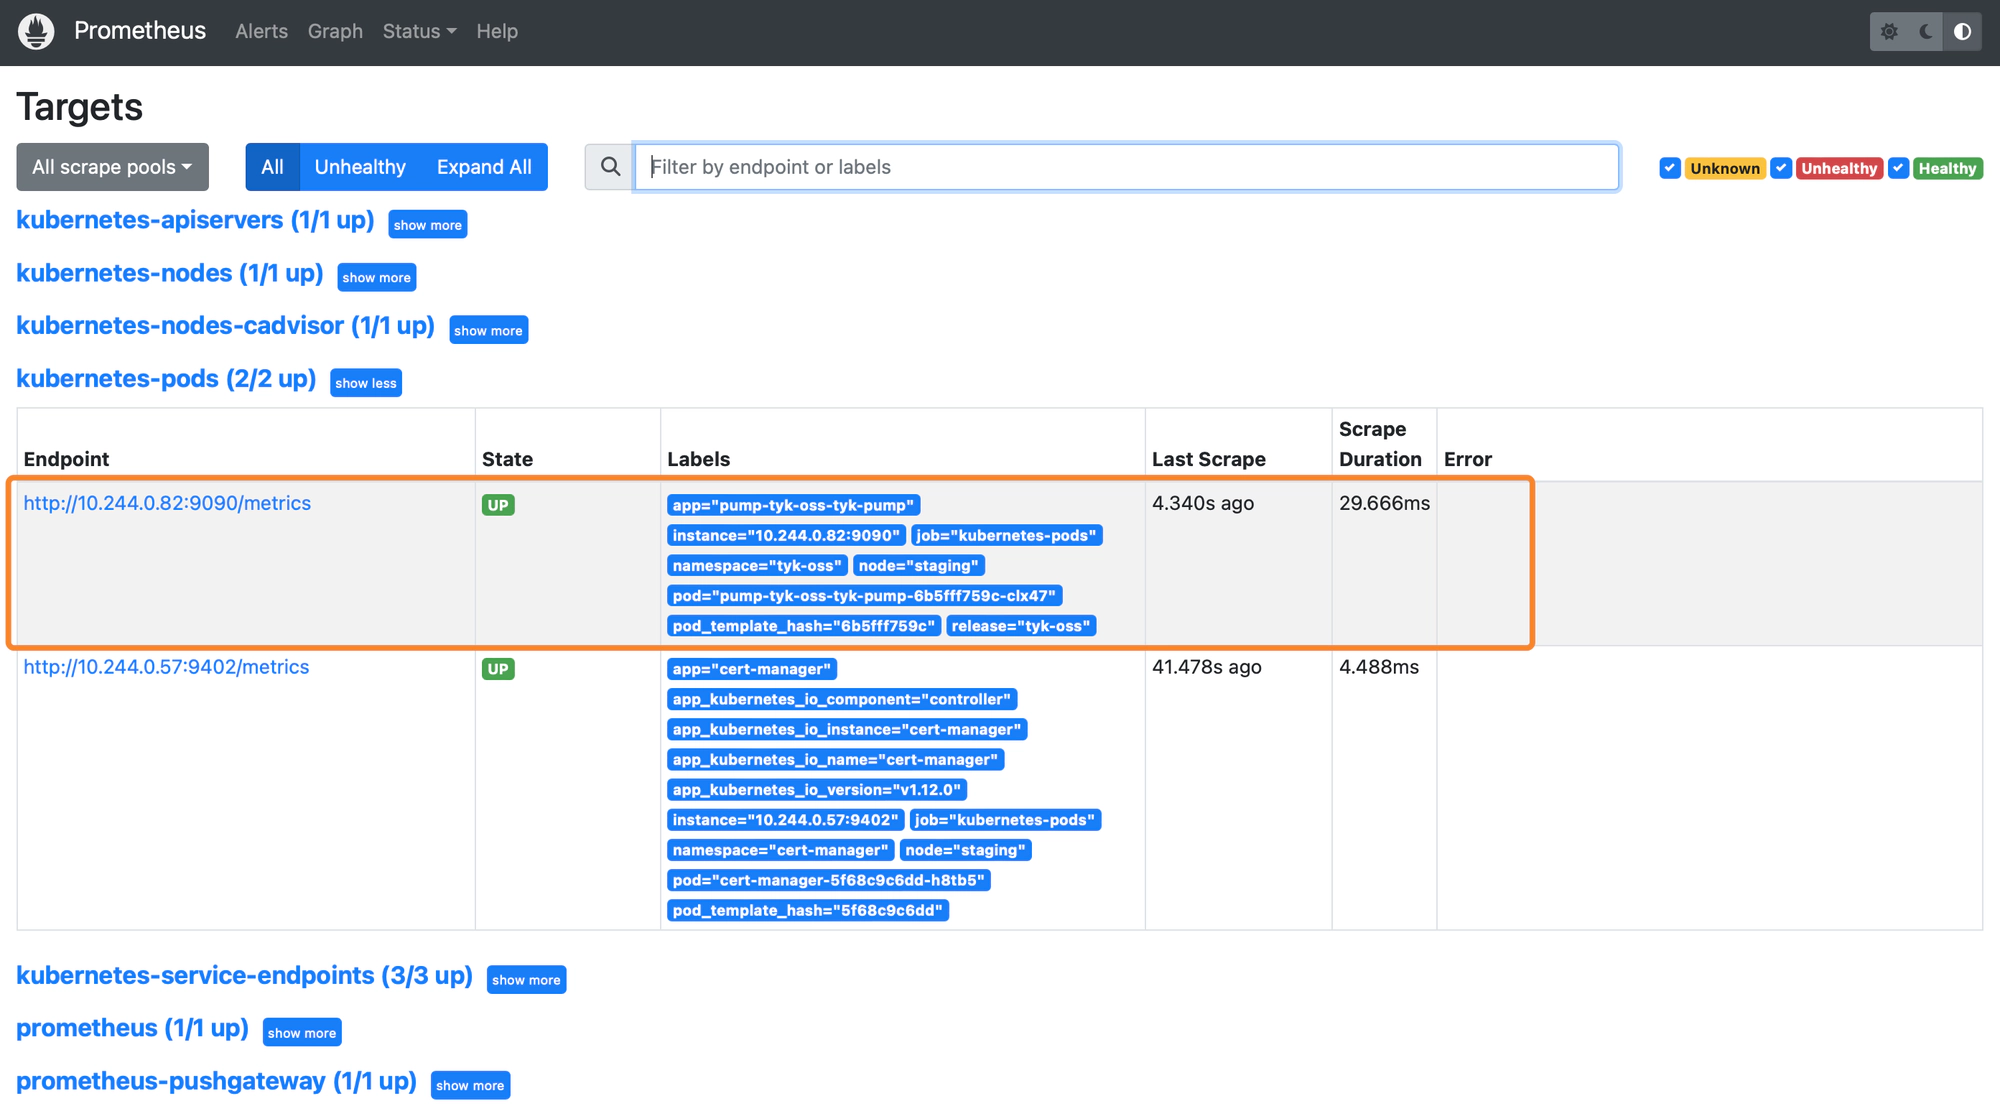
On Prometheus Dashboard, you can see the Pump is listed as one of the target and Prometheus is successfully scrapped from it.

You can check our Guide on Monitoring API with Prometheus for a list of useful queries you can setup and use.
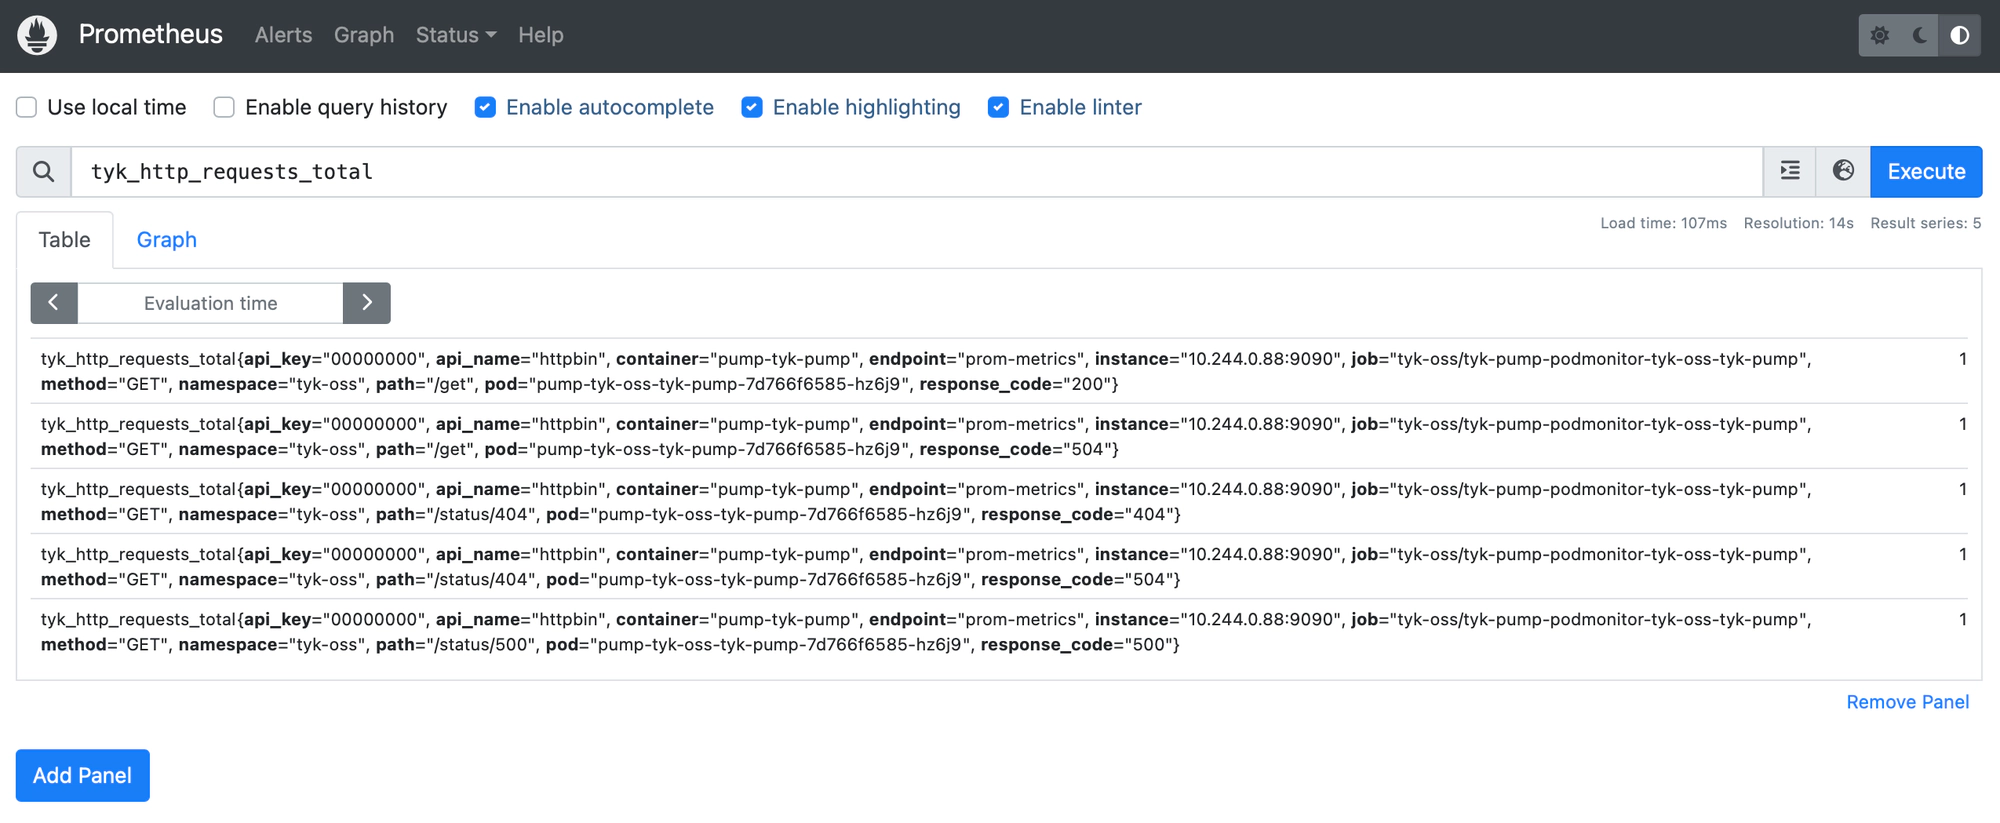
e.g. The custom metrics tyk_http_requests_total can be retrieved:


Example: Integrate with Prometheus using annotations
1. Setup Prometheus
Using the prometheus-community/prometheus chart
Alternatively, if you are not using Prometheus Operator, please check how your Prometheus can support service discovery. Let say you’re using the prometheus-community/prometheus chart, which configures Prometheus to scrape from any Pods with following annotations:
metadata:
  annotations:
    prometheus.io/scrape: "true"
    prometheus.io/path: /metrics
    prometheus.io/port: "9090"
To install Prometheus, run
helm install prometheus prometheus-community/prometheus -n monitoring --create-namespace
2. Install Tyk Pump with prometheus annotations
NAMESPACE=tyk-oss
APISecret=foo
PromOperator_Release=prometheus-stack
Prometheus_Custom_Metrics='[{"name":"tyk_http_requests_total"\,"description":"Total of API requests"\,"metric_type":"counter"\,"labels":["response_code"\,"api_name"\,"method"\,"api_key"\,"alias"\,"path"]}\,          {              "name":"tyk_http_latency"\,              "description":"Latency of API requests"\,              "metric_type":"histogram"\,              "labels":["type"\,"response_code"\,"api_name"\,"method"\,"api_key"\,"alias"\,"path"]          }]'

helm upgrade tyk-redis oci://registry-1.docker.io/bitnamicharts/redis -n $NAMESPACE --create-namespace --install --set image.tag=6.2.13

helm upgrade tyk-oss tyk-helm/tyk-oss -n $NAMESPACE --create-namespace \
  --install \
  --set global.secrets.APISecret="$APISecret" \
  --set global.redis.addrs="{tyk-redis-master.$NAMESPACE.svc.cluster.local:6379}" \
  --set global.redis.passSecret.name=tyk-redis \
  --set global.redis.passSecret.keyName=redis-password \
  --set global.components.pump=true \
  --set "tyk-pump.pump.backend={prometheus}" \
  --set tyk-pump.pump.prometheusPump.customMetrics=$Prometheus_Custom_Metrics \
  --set-string tyk-pump.pump.podAnnotations."prometheus\.io/scrape"=true \
  --set-string tyk-pump.pump.podAnnotations."prometheus\.io/port"=9090 \
  --set-string tyk-pump.pump.podAnnotations."prometheus\.io/path"=/metrics
3. Verification
After some time, you can see that Prometheus is successfully scraping from Tyk Pump:

Example: Expose a service for Prometheus to scrape
You can expose Pump as a service so that Prometheus can access the /metrics endpoint for scraping. Just enable service in tyk-pump.pump.service:
    service:
      # Tyk Pump svc is disabled by default. Set it to true to enable it.
      enabled: true
