OpenTelemetry with Datadog
Last updated: 3 minutes read.
This guide explains how to configure Tyk API Gateway and the OpenTelemetry Collector to collect distributed traces in Datadog. It follows the reference documentation from Datadog.
While this tutorial demonstrates using an OpenTelemetry Collector running in Docker, the core concepts remain consistent regardless of how and where the OpenTelemetry collector is deployed.
Whether you’re using Tyk API Gateway in an open-source (OSS) or commercial deployment, the configuration options remain identical.
Prerequisites
- Docker installed on your machine
- Tyk Gateway v5.2.0 or higher
- OpenTelemetry Collector Contrib docker image. Make sure to use the Contrib distribution of the OpenTelemetry Collector as it is required for the Datadog exporter.
Step 1: Configure the OpenTelemetry Collector
You will need:
- An API key from Datadog. For example,
6c35dacbf2e16aa8cda85a58d9015c3c. - Your Datadog site. Examples are:
datadoghq.com,us3.datadoghq.comanddatadoghq.eu.
Create a new YAML configuration file named otel-collector.yml with the following content:
receivers:
  otlp:
    protocols:
      grpc:
        endpoint: 0.0.0.0:4317
processors:
  batch:
    send_batch_max_size: 100
    send_batch_size: 10
    timeout: 10s
exporters:
  datadog:
    api:
      site: "YOUR-DATADOG-SITE"
      key: "YOUR-DATAGOG-API-KEY"
service:
  pipelines:
    traces:
      receivers: [otlp]
      processors: [batch]
      exporters: [datadog]
Step 2: Configure a test API
If you don’t have any APIs configured yet, create a subdirectory called apps in the current directory. Create a new file apidef-hello-world.json and copy this very simple API definition for testing purposes:
{
    "name": "Hello-World",
    "slug": "hello-world",
    "api_id": "Hello-World",
    "org_id": "1",
    "use_keyless": true,
    "detailed_tracing": true,
    "version_data": {
      "not_versioned": true,
      "versions": {
        "Default": {
          "name": "Default",
          "use_extended_paths": true
        }
      }
    },
    "proxy": {
      "listen_path": "/hello-world/",
      "target_url": "http://echo.tyk-demo.com:8080/",
      "strip_listen_path": true
    },
    "active": true
}
Step 3: Create the Docker-Compose file
Save the following YAML configuration to a file named docker-compose.yml.
version: "2"
services:
  # OpenTelemetry Collector Contrib
  otel-collector:
    image: otel/opentelemetry-collector-contrib:latest
    volumes:
      - ./otel-collector.yml:/etc/otel-collector.yml
    command: ["--config=/etc/otel-collector.yml"]
    ports:
      - "4317" # OTLP gRPC receiver
    networks:
      - tyk

  # Tyk API Gateway, open-source deployment
  tyk:
    image: tykio/tyk-gateway:v5.2
    ports:
      - 8080:8080
    environment:
      - TYK_GW_OPENTELEMETRY_ENABLED=true
      - TYK_GW_OPENTELEMETRY_EXPORTER=grpc
      - TYK_GW_OPENTELEMETRY_ENDPOINT=otel-collector:4317
    volumes:
      - ./apps:/opt/tyk-gateway/apps
    depends_on:
      - redis
    networks:
      - tyk

  redis:
    image: redis:4.0-alpine
    ports:
      - 6379:6379
    command: redis-server --appendonly yes
    networks:
      - tyk

networks:
  tyk:
To start the services, go to the directory that contains the docker-compose.yml file and run the following command:
docker-compose up
Step 4: Explore OpenTelemetry traces in Datadog
Begin by sending a few requests to the API endpoint configured in step 2:
http://localhost:8080/hello-world/
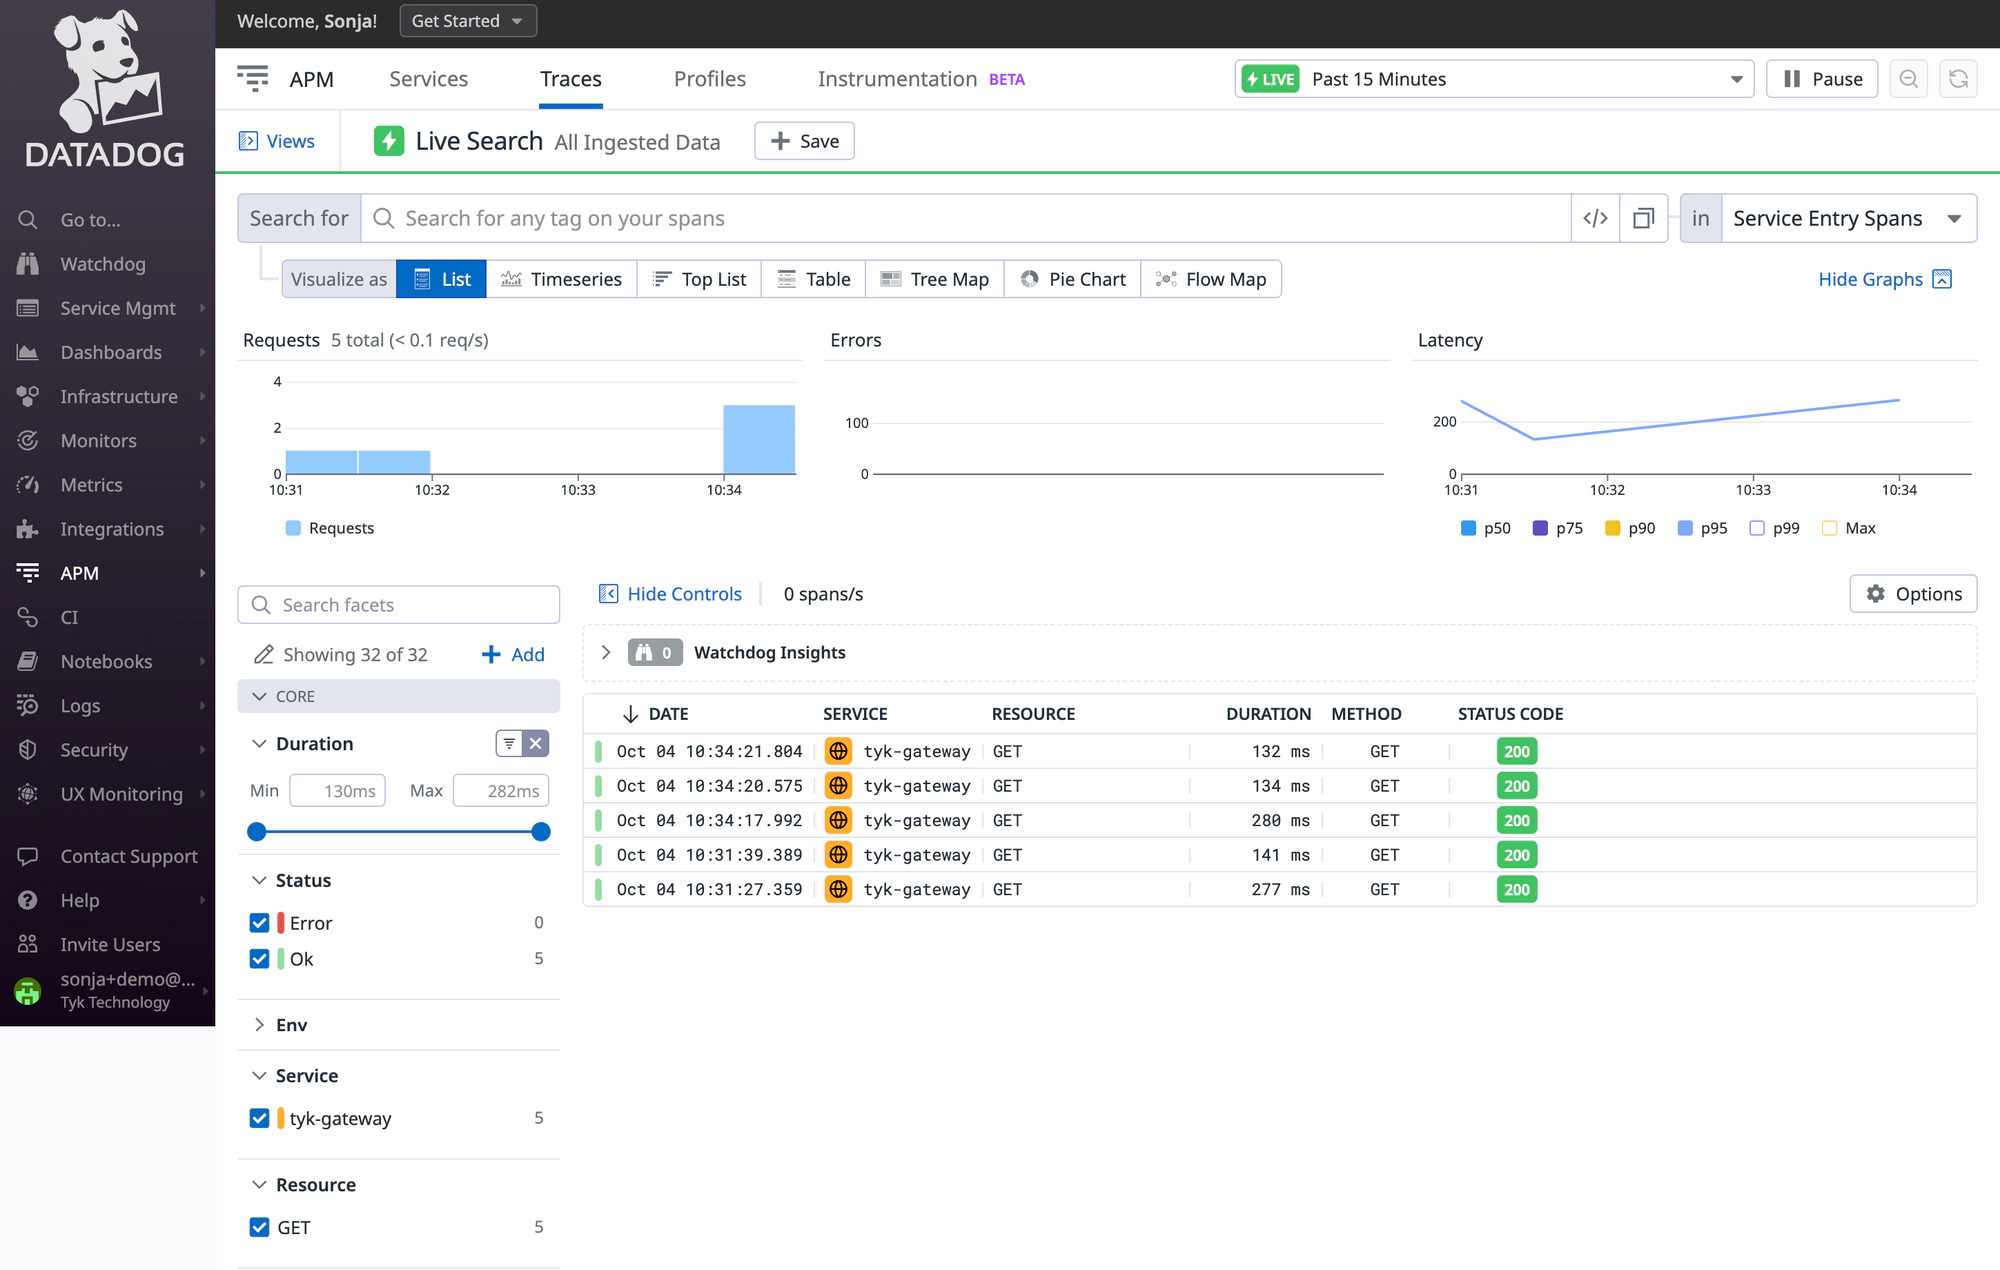
Next, log in to Datadog and navigate to the ‘APM’ / ‘Traces’ section. Here, you should start observing traces generated by Tyk:
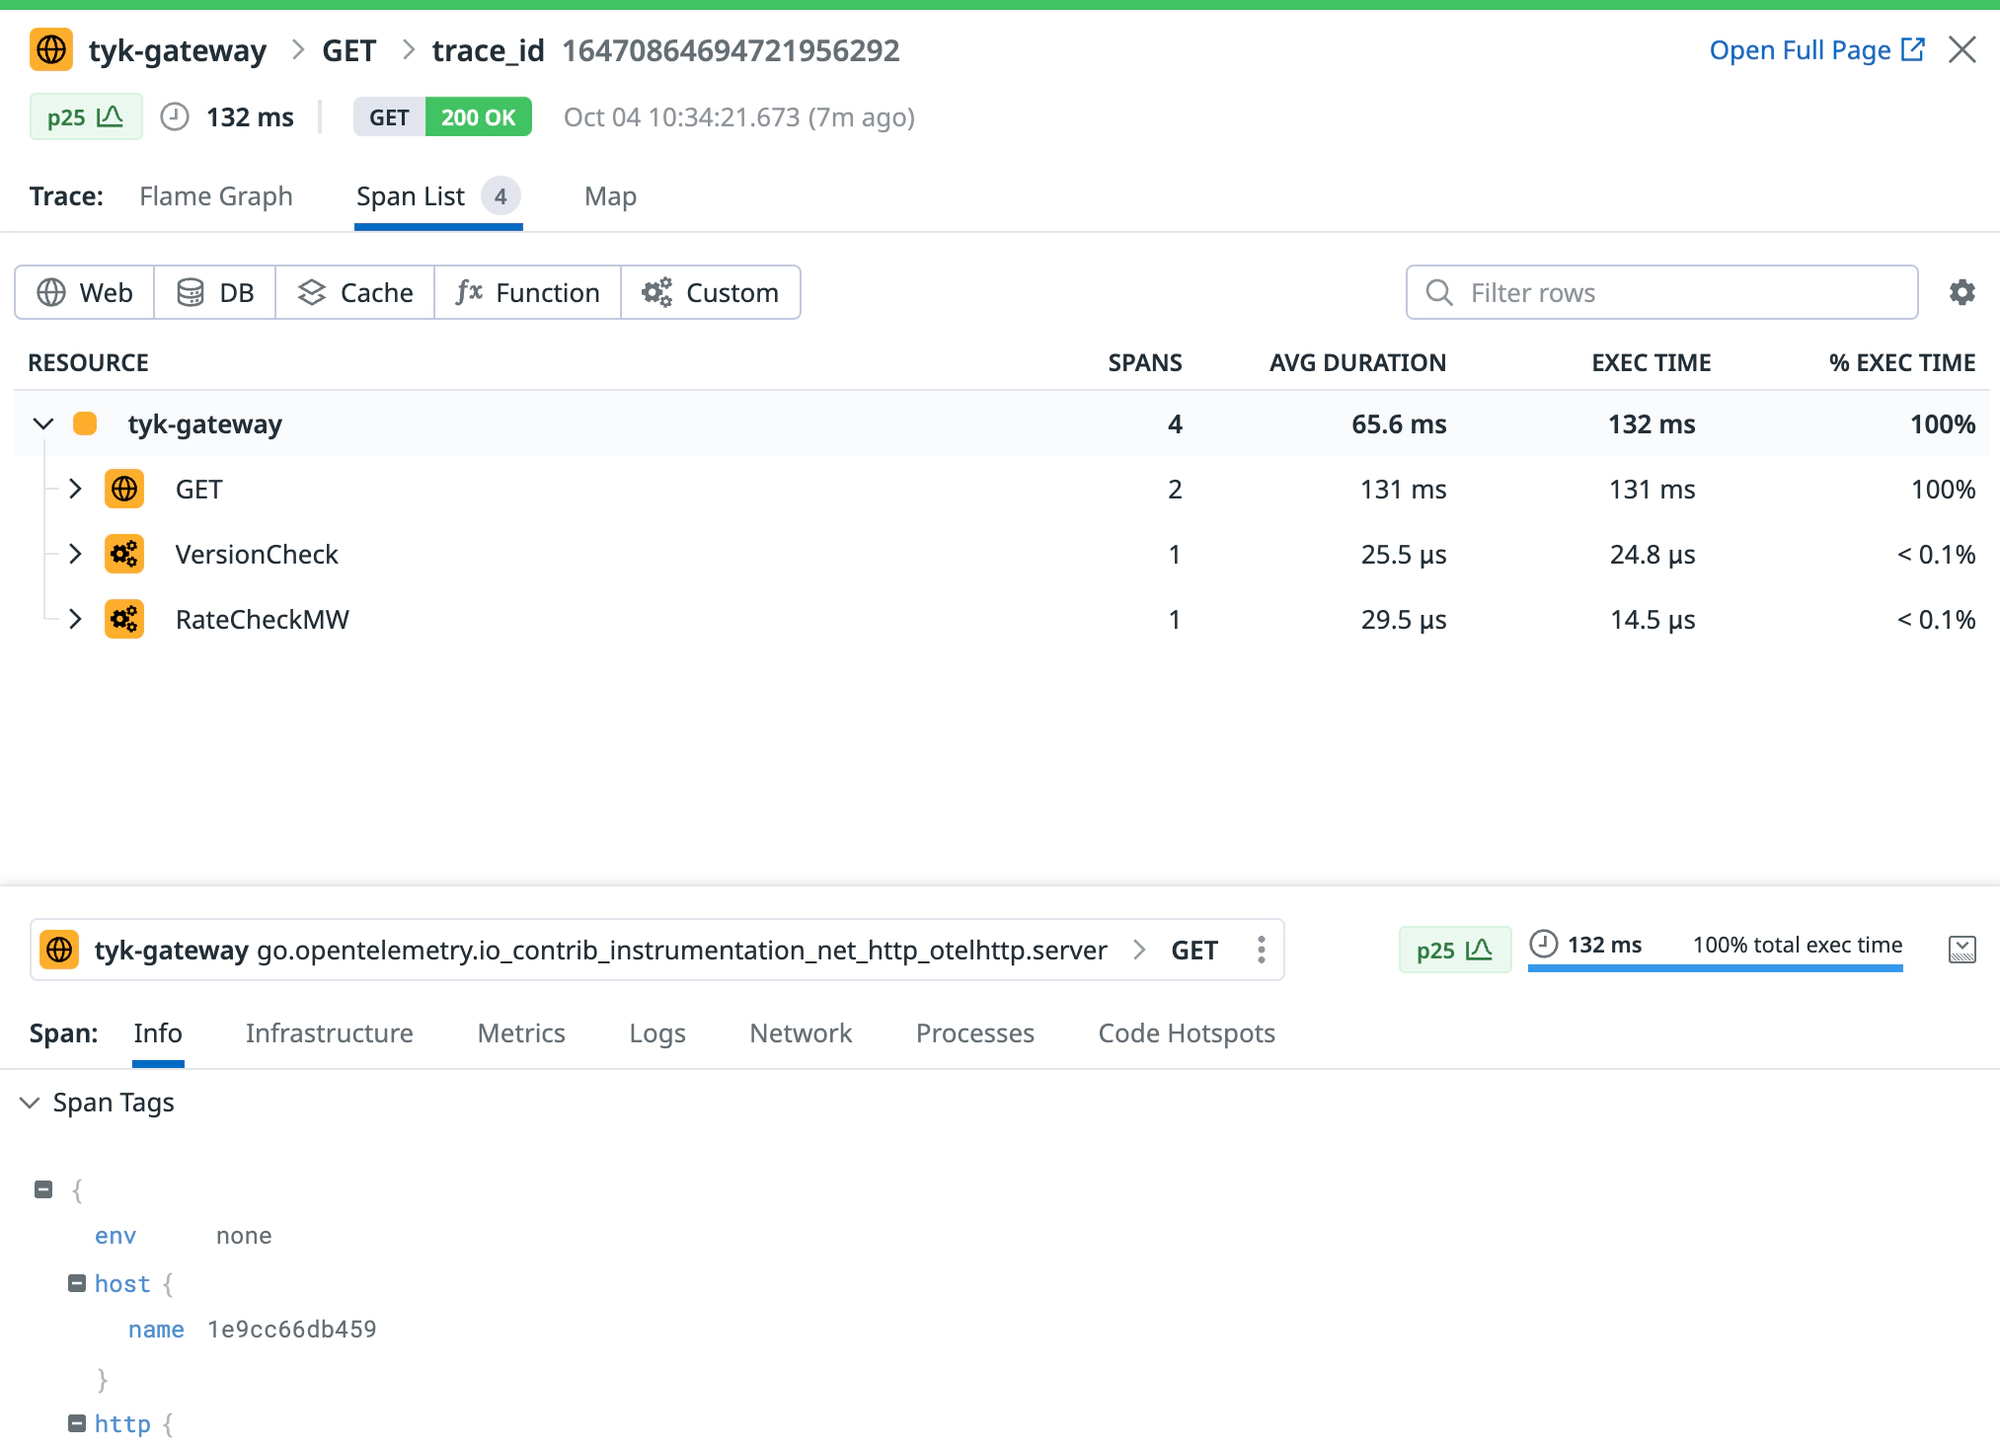
Click on a trace to view all its internal spans:
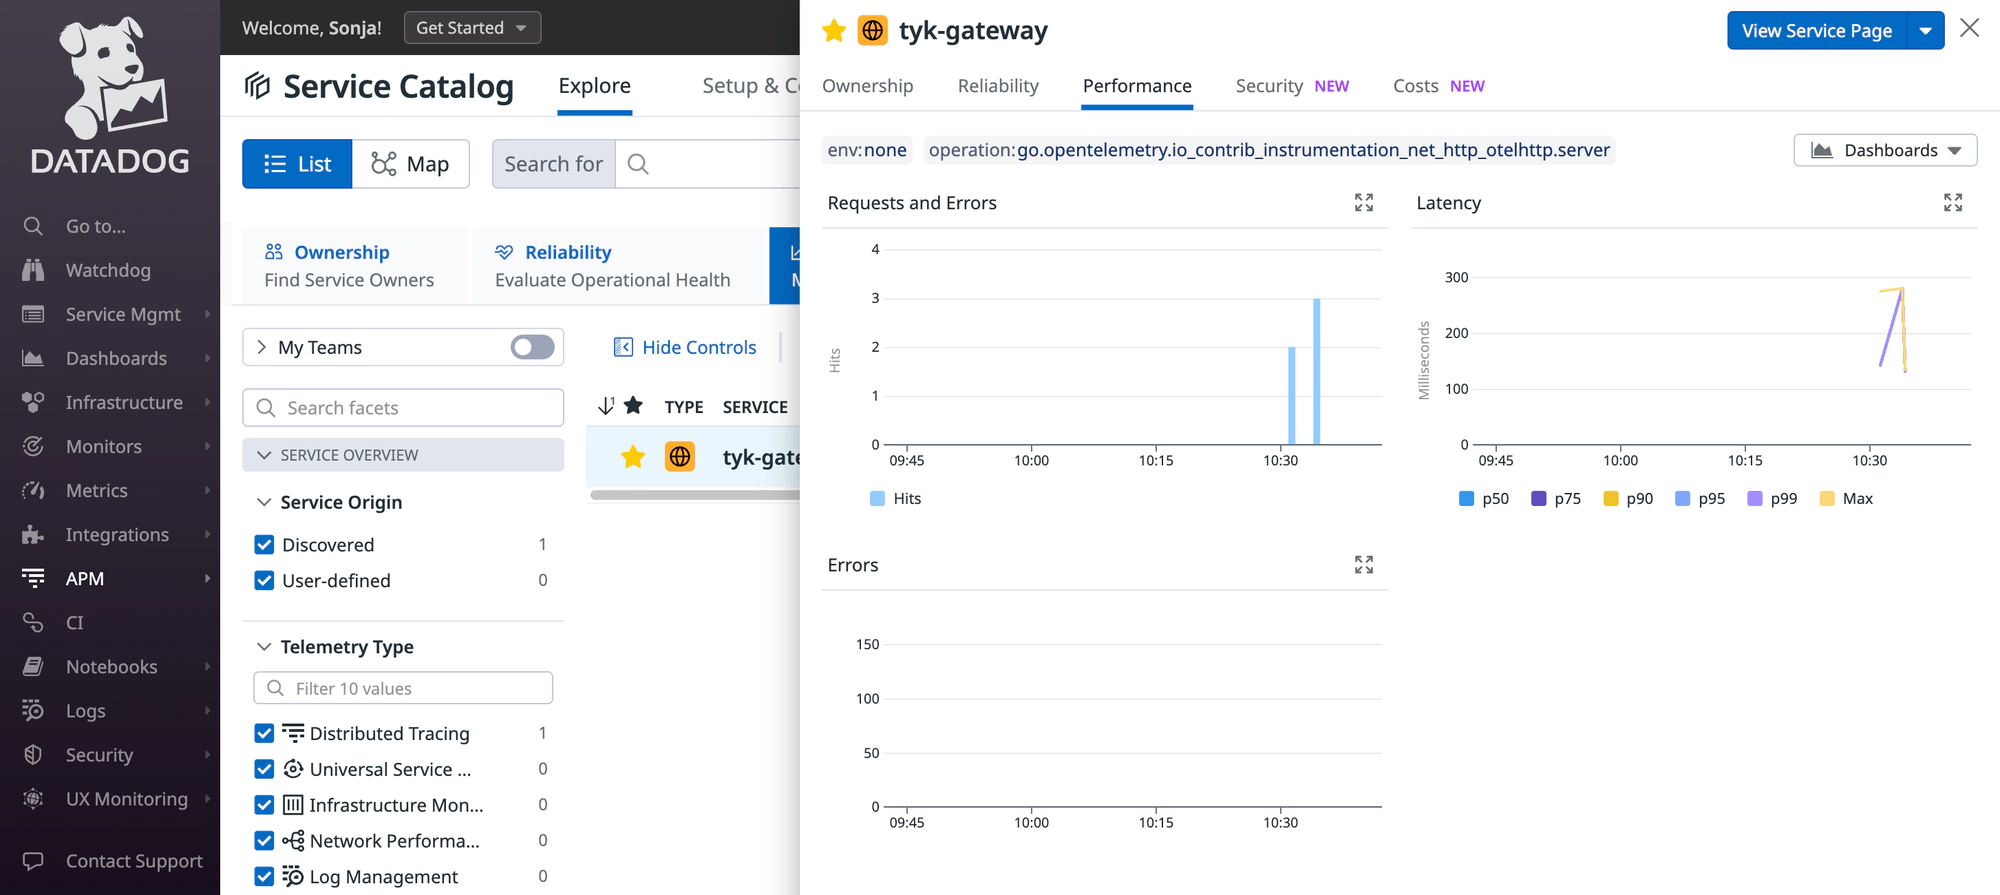
Datadog will generate a service entry to monitor Tyk API Gateway and will automatically compute valuable metrics using the ingested traces.
Troubleshooting
If you do not observe any traces appearing in Datadog, consider the following steps for resolution:
- Logging: Examine logs from Tyk API Gateway and from the OpenTelemetry Collector for any issues or warnings that might provide insights.
- Data Ingestion Delays: Be patient, as there could be some delay in data ingestion. Wait for 10 seconds to see if traces eventually appear, as this is the timeout we have configured in the batch processing of the OpenTelemetry collector within step 1.