All tyk container logs show up under the error status in Datadog logs
Last updated: 1 minute read.
With Datadog you can view logs of all your Tyk components. To allow Datadog Agent to scrape the logs of your Tyk deployment correctly you need to create a pipeline in Datadog, to process and underst and this data.
To do that, we need to access the /logs/pipelines path on your datadog web application.
This will take us to the pipeline configuration page.
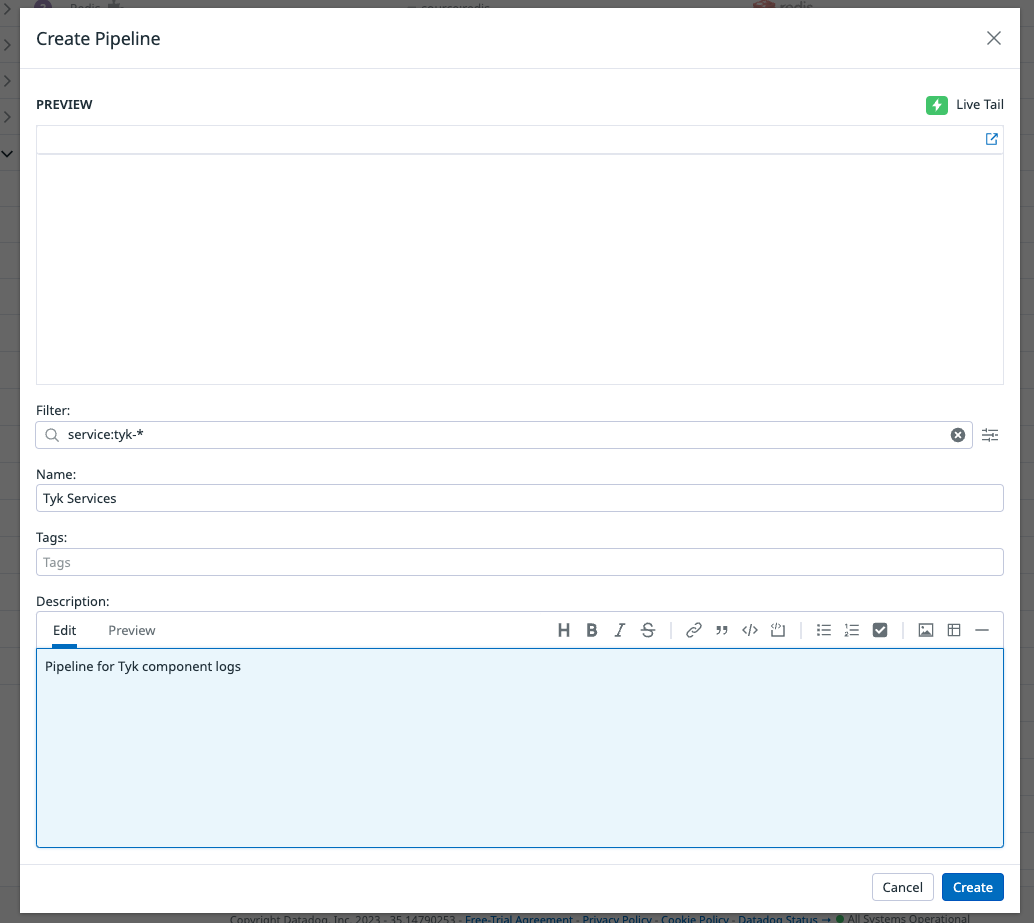
In here, we will create a new pipeline.
For the filter section, use Service:tyk-* this will capture logs for any of the Tyk related services.
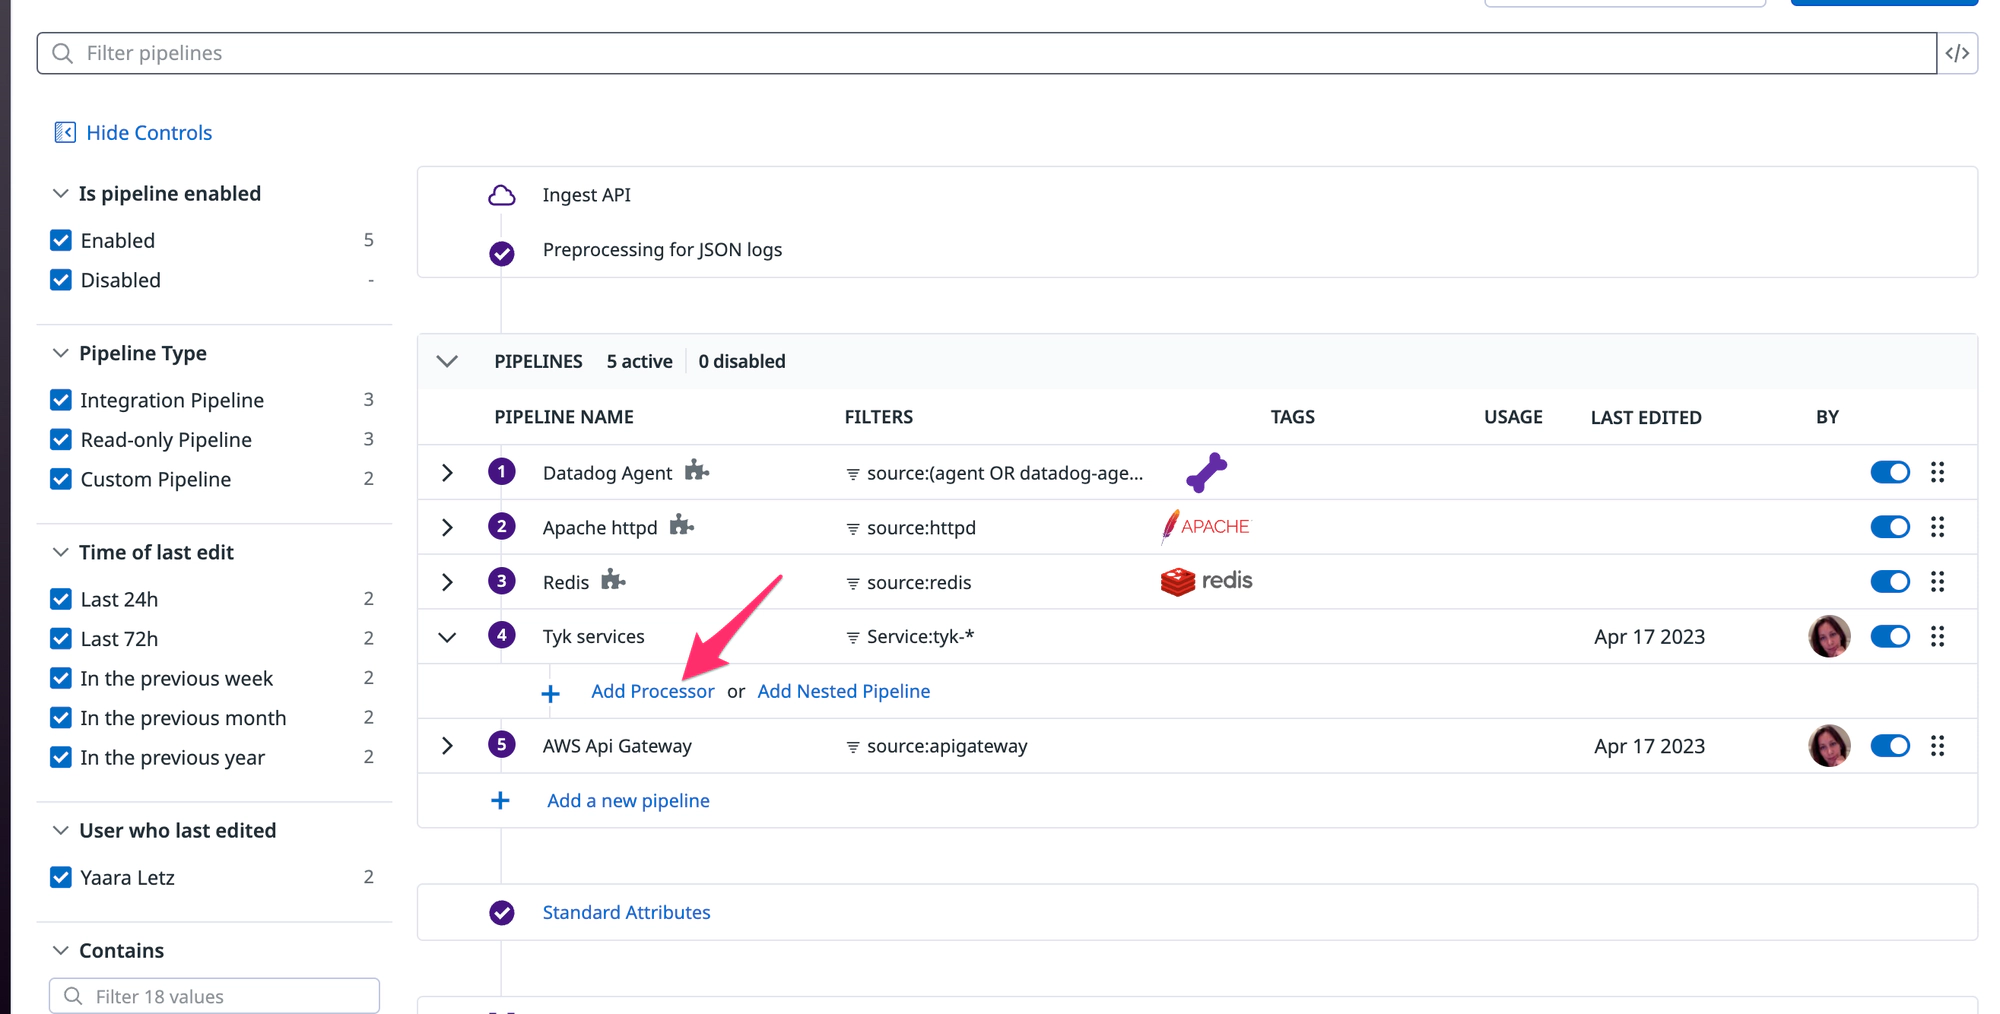
Next, we will need to add a processor to the pipeline.
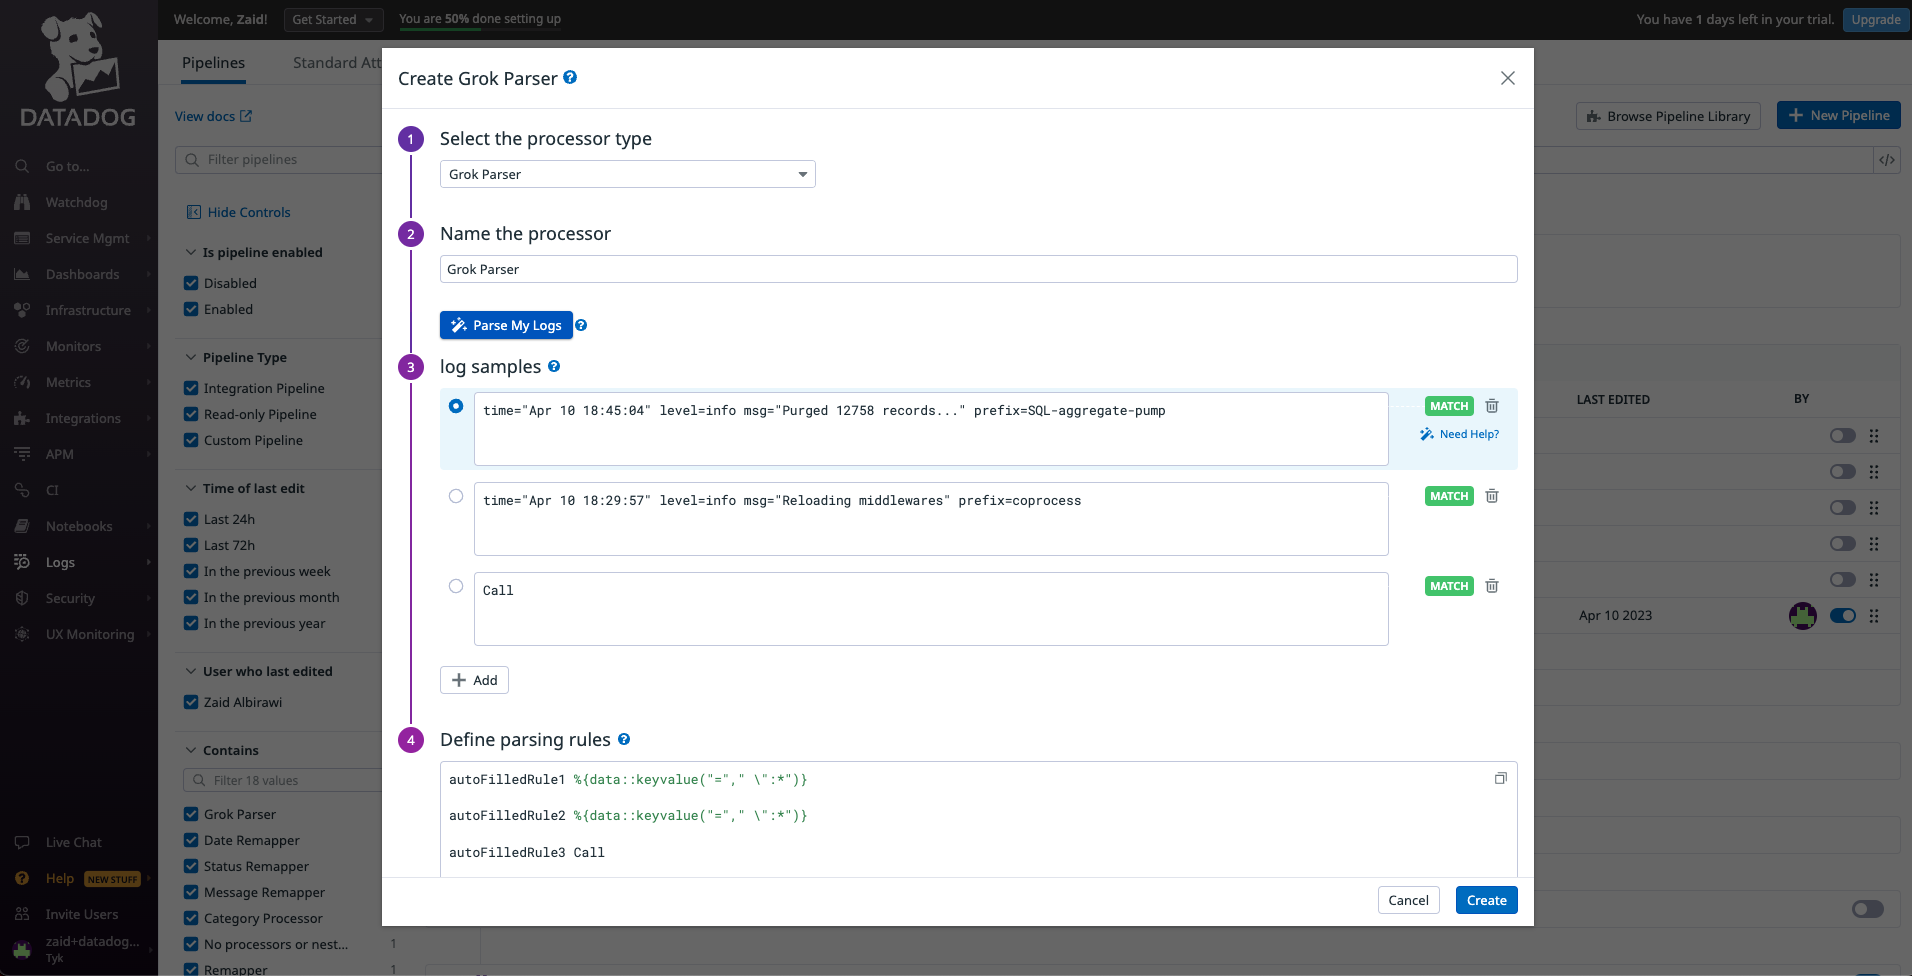
Select the Grok Parser processor type, give it a name and click on the Parse My Logs button and Create .
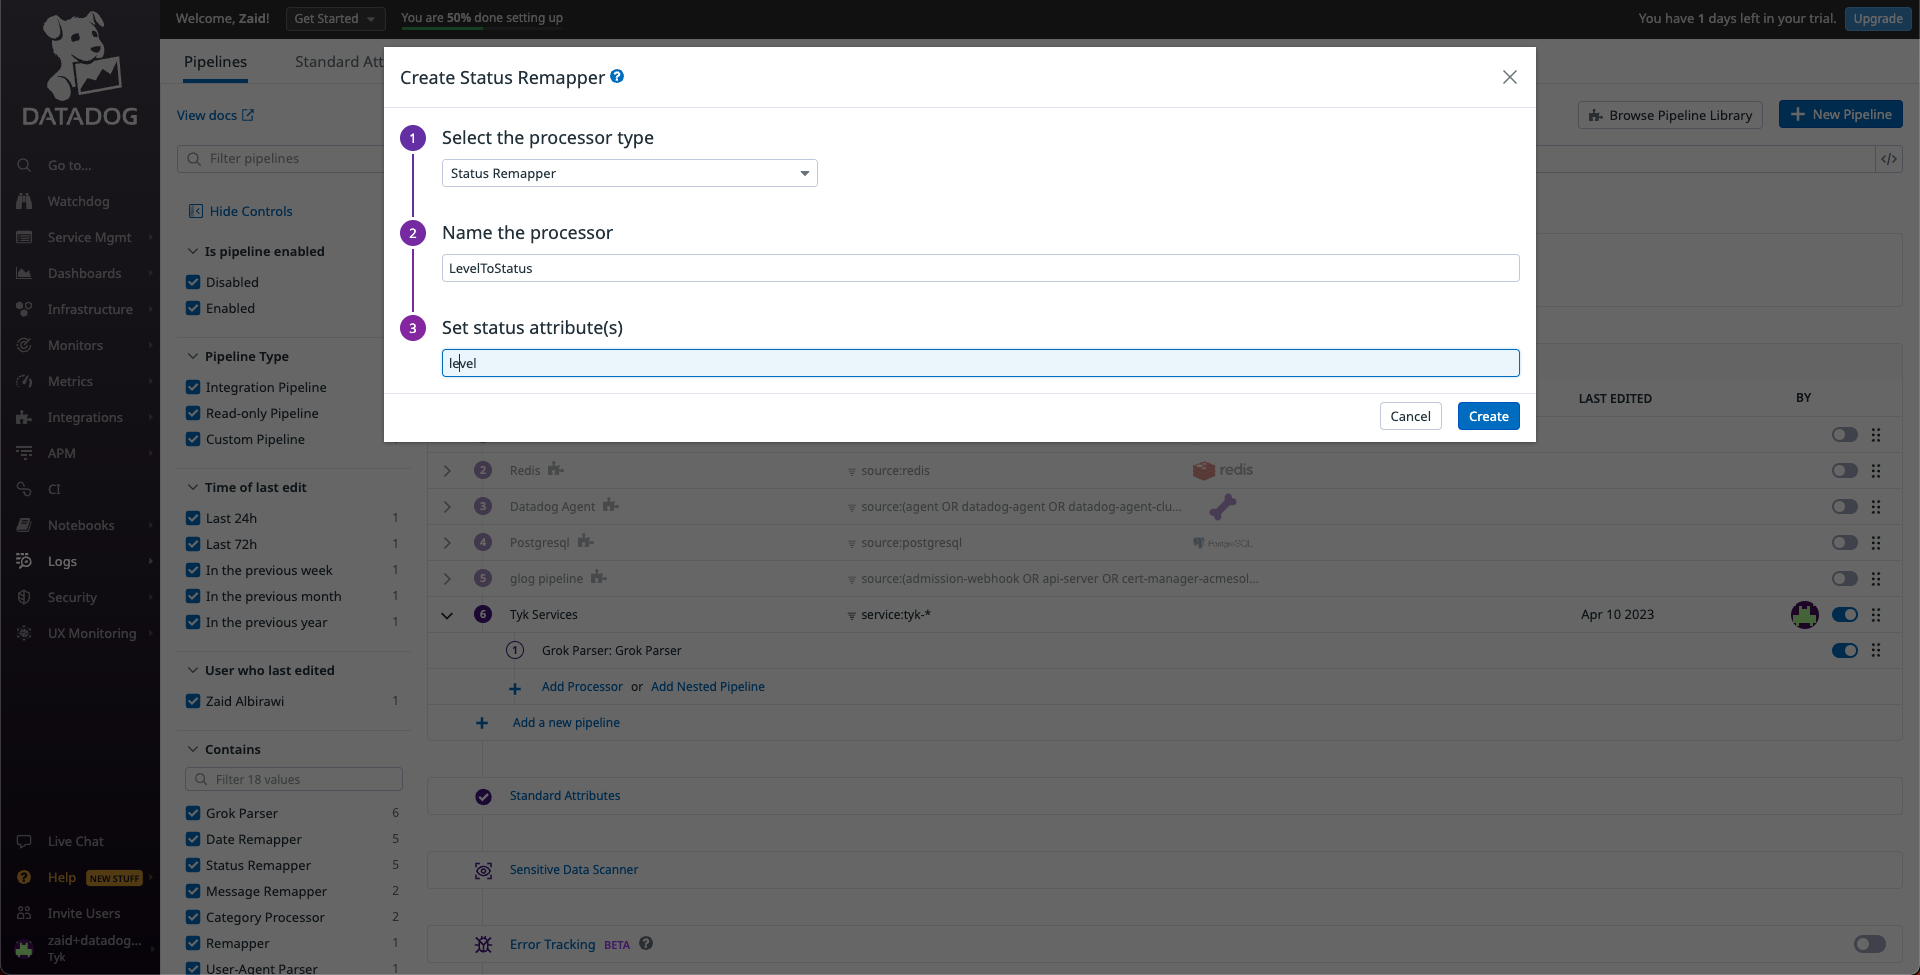
Lastly, add another processor to the pipeline. Select the Status Remapper processor type, give it a name and set the status attribute to level then Create.
The Tyk logs statuses should now be shown under the right status.
Contact us to learn more: