What Is The Performance Impact Of Analytics?
Last updated: 3 minutes read.
This FAQ explains how analytics may impact performance relating to high CPU load and reduced Requests Per Second (RPS). Subsequently, it describes how to configure Tyk to reduce this performance impact for platforms that exhibit high volumes of traffic.
What Are Analytics?
Tyk Gateway allows analytics to be recorded and stored in a persistent data store (MongoDB/SQL) for all APIs by default, via Tyk Pump.
Tyk Gateway generates transaction records for each API request and response, containing analytics data relating to: the originating host (where the request is coming from), which Tyk API version was used, the HTTP method requested and request path etc.
The transaction records are transmitted to Redis and subsequently transferred to a persistent data store of your choice via Tyk Pump. Furthermore, Tyk Pump can also be configured to aggregate the transaction records (using different data keys - API ID, access key, endpoint, response status code, location) and write to a persistent data store. Tyk Dashboard uses this data for:
- Aggregated analytics - Displaying analytics based on the aggregated data.
- Log Browser to display raw transaction records.
How Do Analytics Impact Performance?
Analytics may introduce the problem of increased CPU load and a decrease in the number of requests per second (RPS).
In the Tyk Dashboard API screen below, there are two APIs, track and notrack. The APIs were created to conduct a simple load test, to show the gateway’s RPS (requests per second) for each API:
- track: Traffic to this API is tracked, i.e. transaction records are generated for each request/response.
- notrack: Traffic to this API is not tracked, i.e. transaction records are not generated for each request/response.

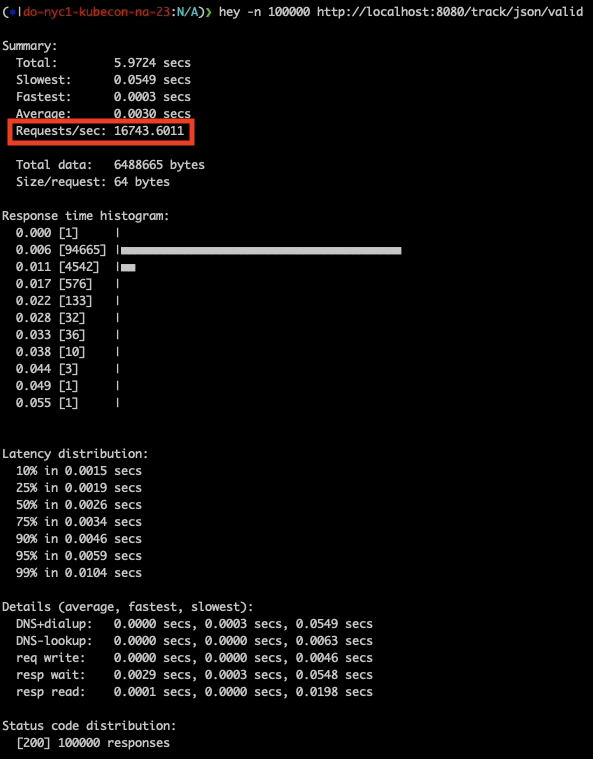
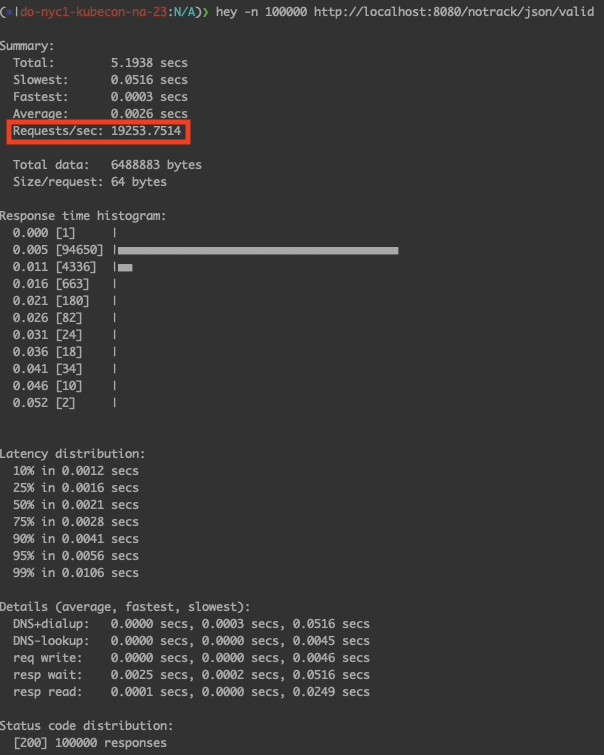
100,000 requests were sent to each API and the rate at which Tyk was able to handle those requests (number of requests per second) was measured. The results for the tracked API are displayed in the left pane terminal window; with the right pane showing the results for the untracked API.
Tracked API Performance

Untracked API Performance

Explaining the results
We can see that 19,253.75 RPS was recorded for the untracked API; with 16,743.6011 RPS reported for the tracked API. The number of requests per second decreased by ~13% when analytics was enabled.
What Can Be Done To Address This Performance Impact?
Tyk is configurable, allowing fine grained control over which information should be recorded and which can be skipped, thus reducing CPU cycles, traffic and storage.
Users can selectively prevent the generation of analytics for do_not_track middleware:
- Per API: Tyk Gateway will not create records for requests/responses for any endpoints of an API.
- Per Endpoint: Tyk Gateway will not create records for requests/responses for specific endpoints.
When set, this prevents Tyk Gateway from generating the transaction records. Without transaction records, Tyk Pump will not transfer analytics to the chosen persistent data store. It’s worth noting that the track middleware exclusively influences the generation of endpoint popularity aggregated data by Tyk Pump.
Conclusion
Disabling the creation of analytics (either per API or for specific endpoints) via the do_not_track configuration parameter helps to reduce CPU cycles and network requests for systems that exhibit high load and traffic, e.g. social media platforms, streaming, financial services and trading platforms.
Application decisions need to be made concerning which endpoints are non critical and can thus have analytics disabled. Furthermore, benchmarking and testing will be required to evaluate the actual benefits for the application specific use case.
Subsequently, it is worthwhile monitoring traffic and system load and using this feature to improve performance.