- Distributed Traces: Track request flow, identify bottlenecks, and troubleshoot issues.
- Gateway Metrics: Export RED (Rate, Error, Duration) metrics to monitor API performance.
- Application Logs: Stream application logs in real time to your configured provider.
Telemetry is an add-on feature in Tyk Cloud. Contact our support team to enable it for your account.
Available Telemetry Providers
Tyk Cloud integrates with:Instructions
Configuring telemetry is a two-step process:- Configure a provider at the organization level.
- Enable telemetry export on a Cloud Data Plane.
Step 1: Configure a telemetry provider
-
In the Tyk Cloud Console, select Telemetry. A grid shows all supported providers.
Only one provider can be configured at a time.

- Click your preferred provider to open its configuration form.
-
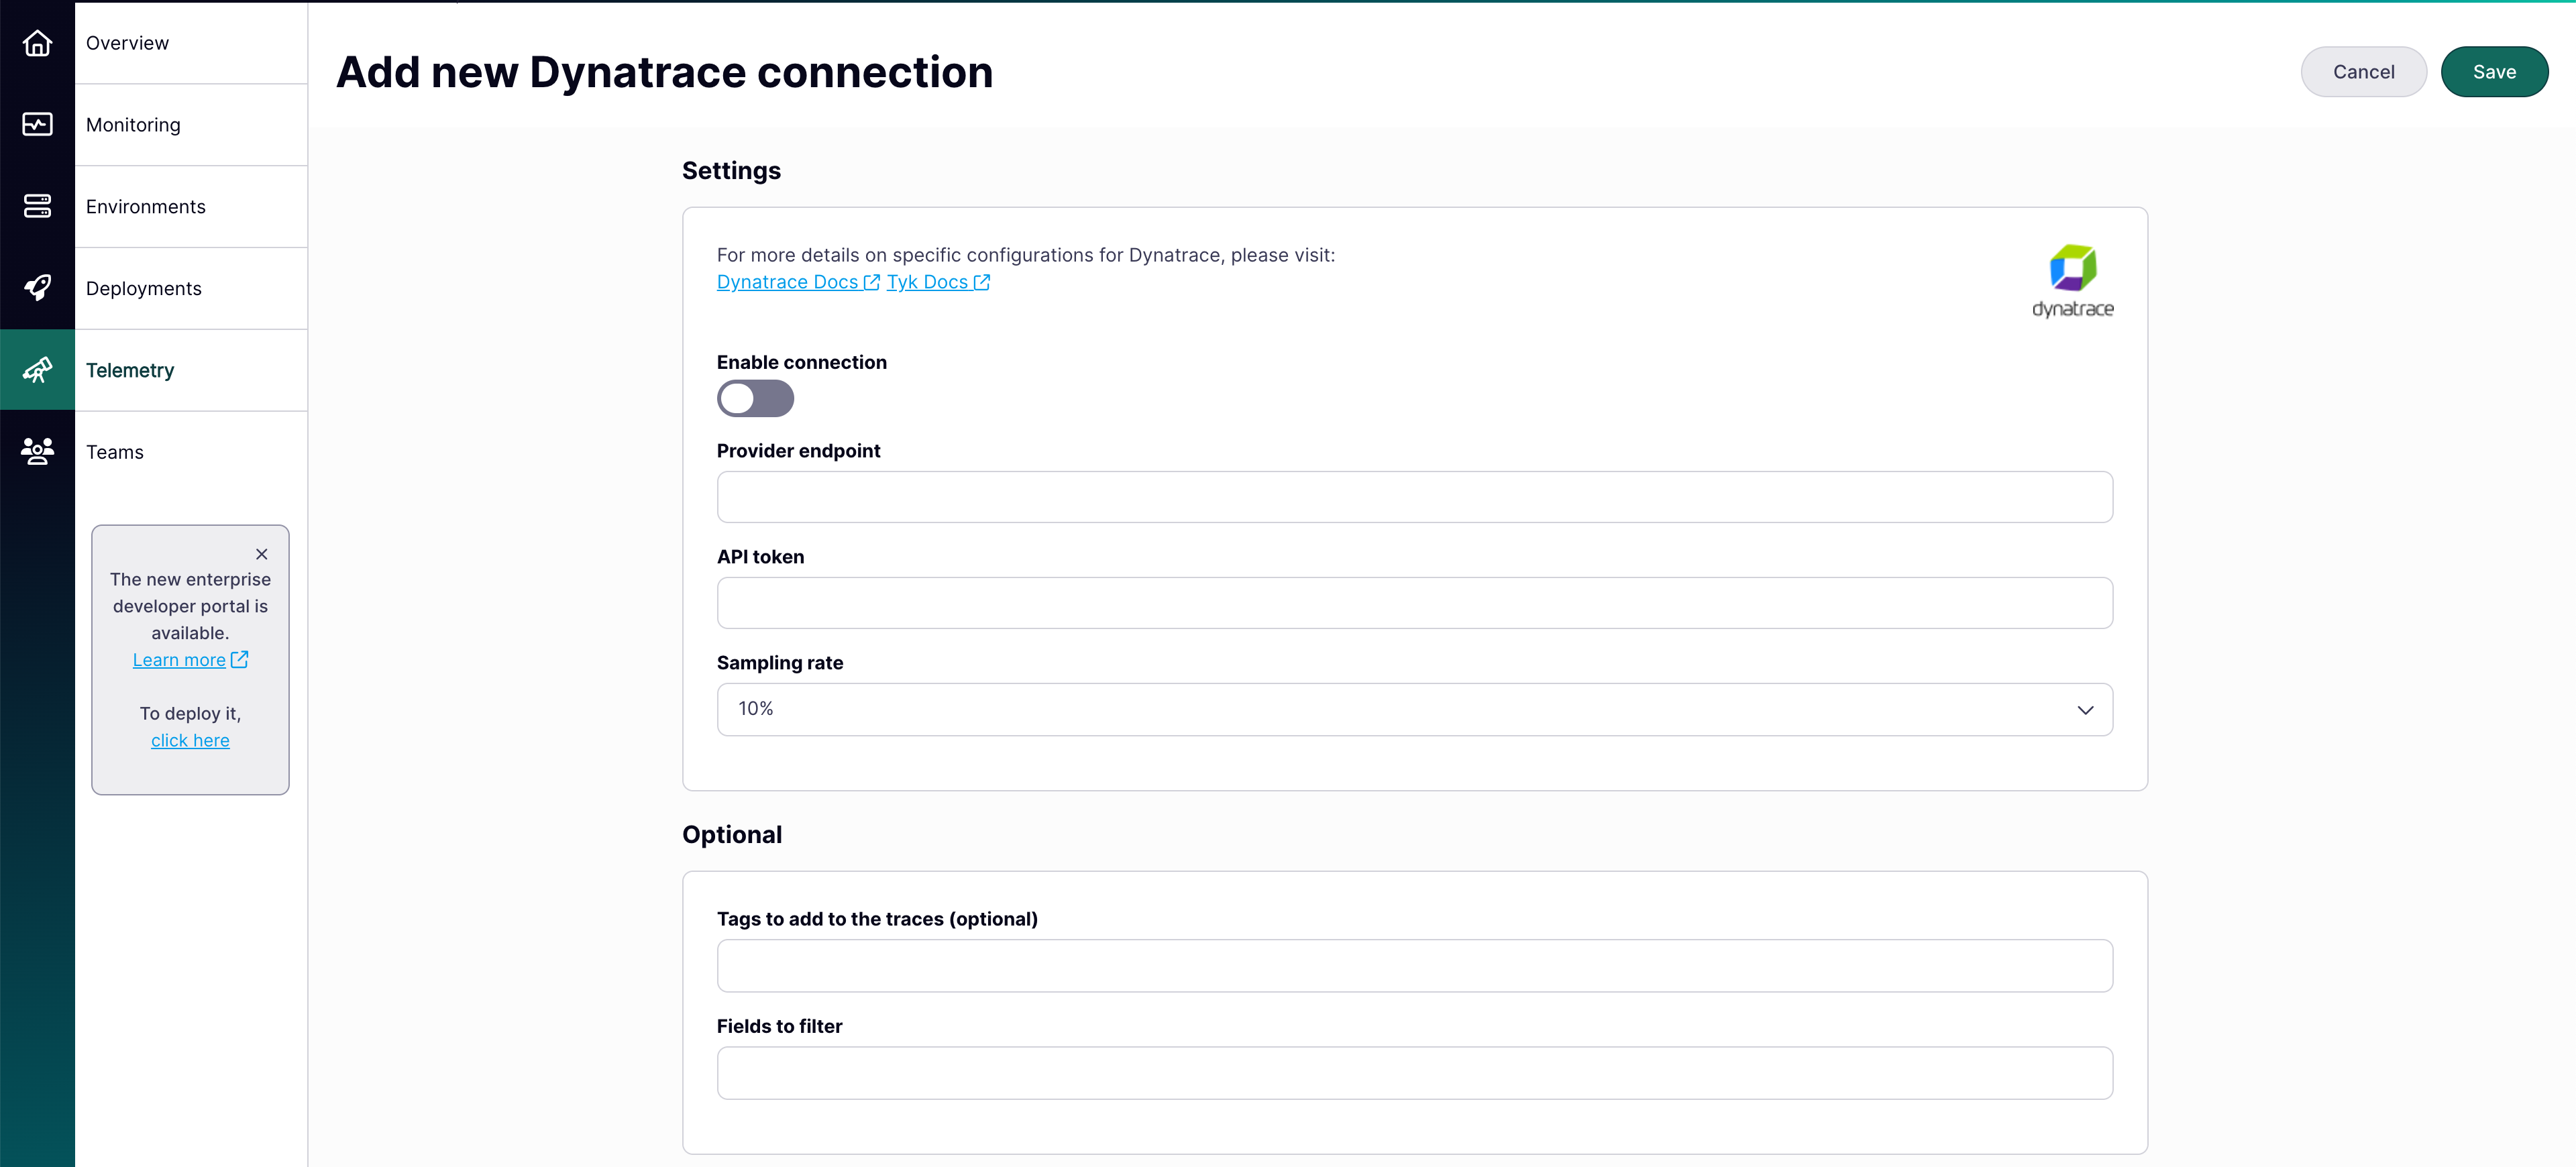
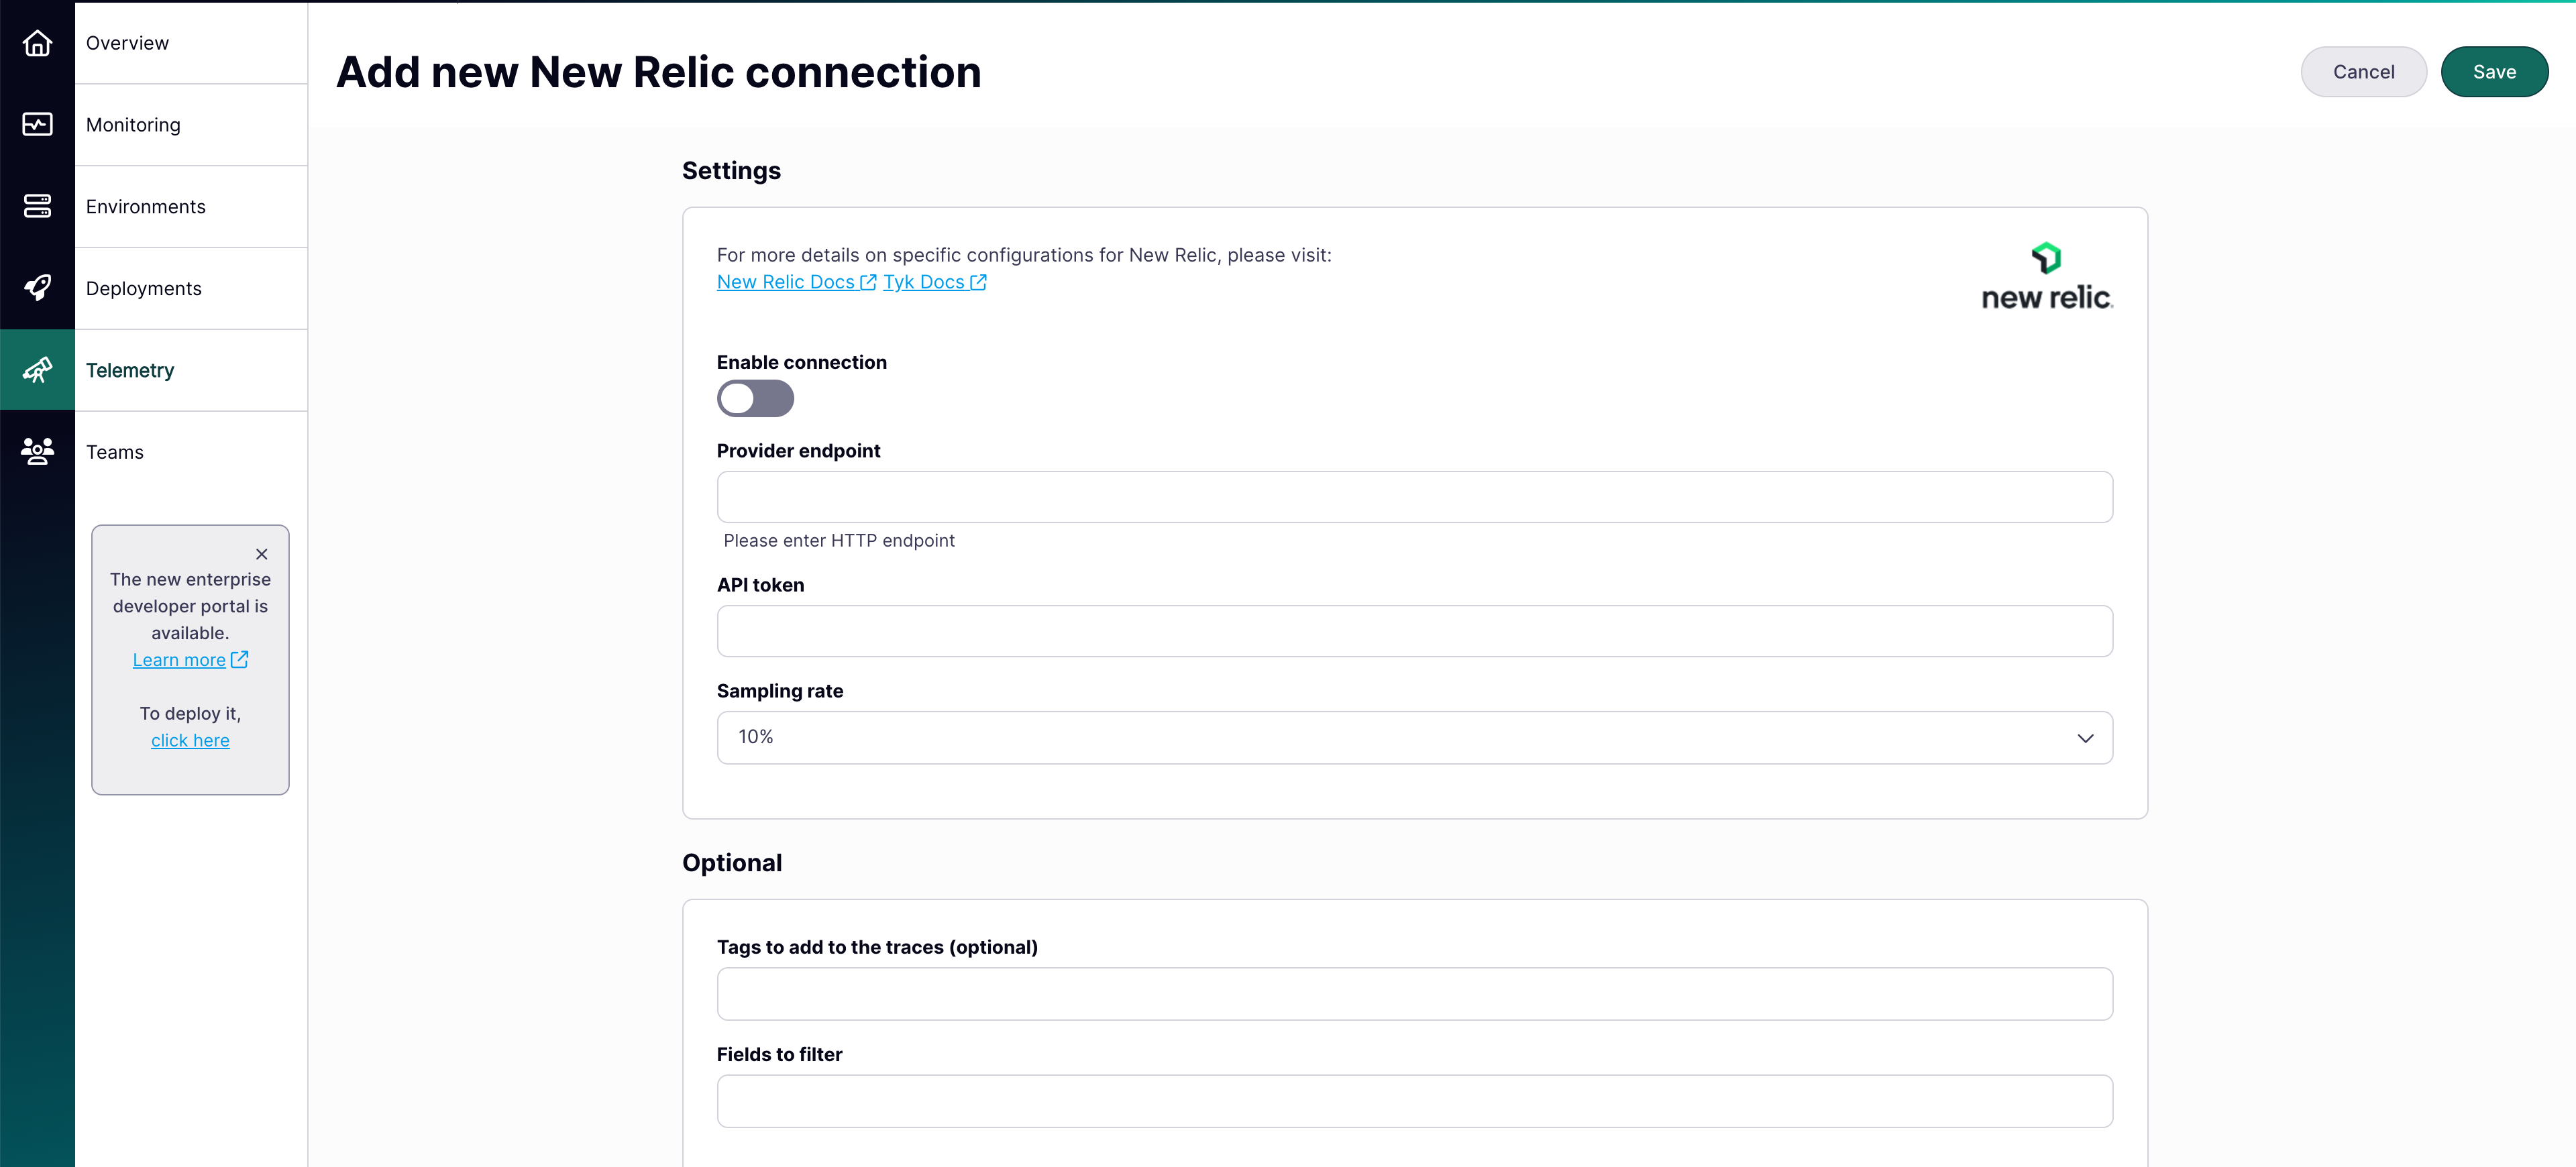
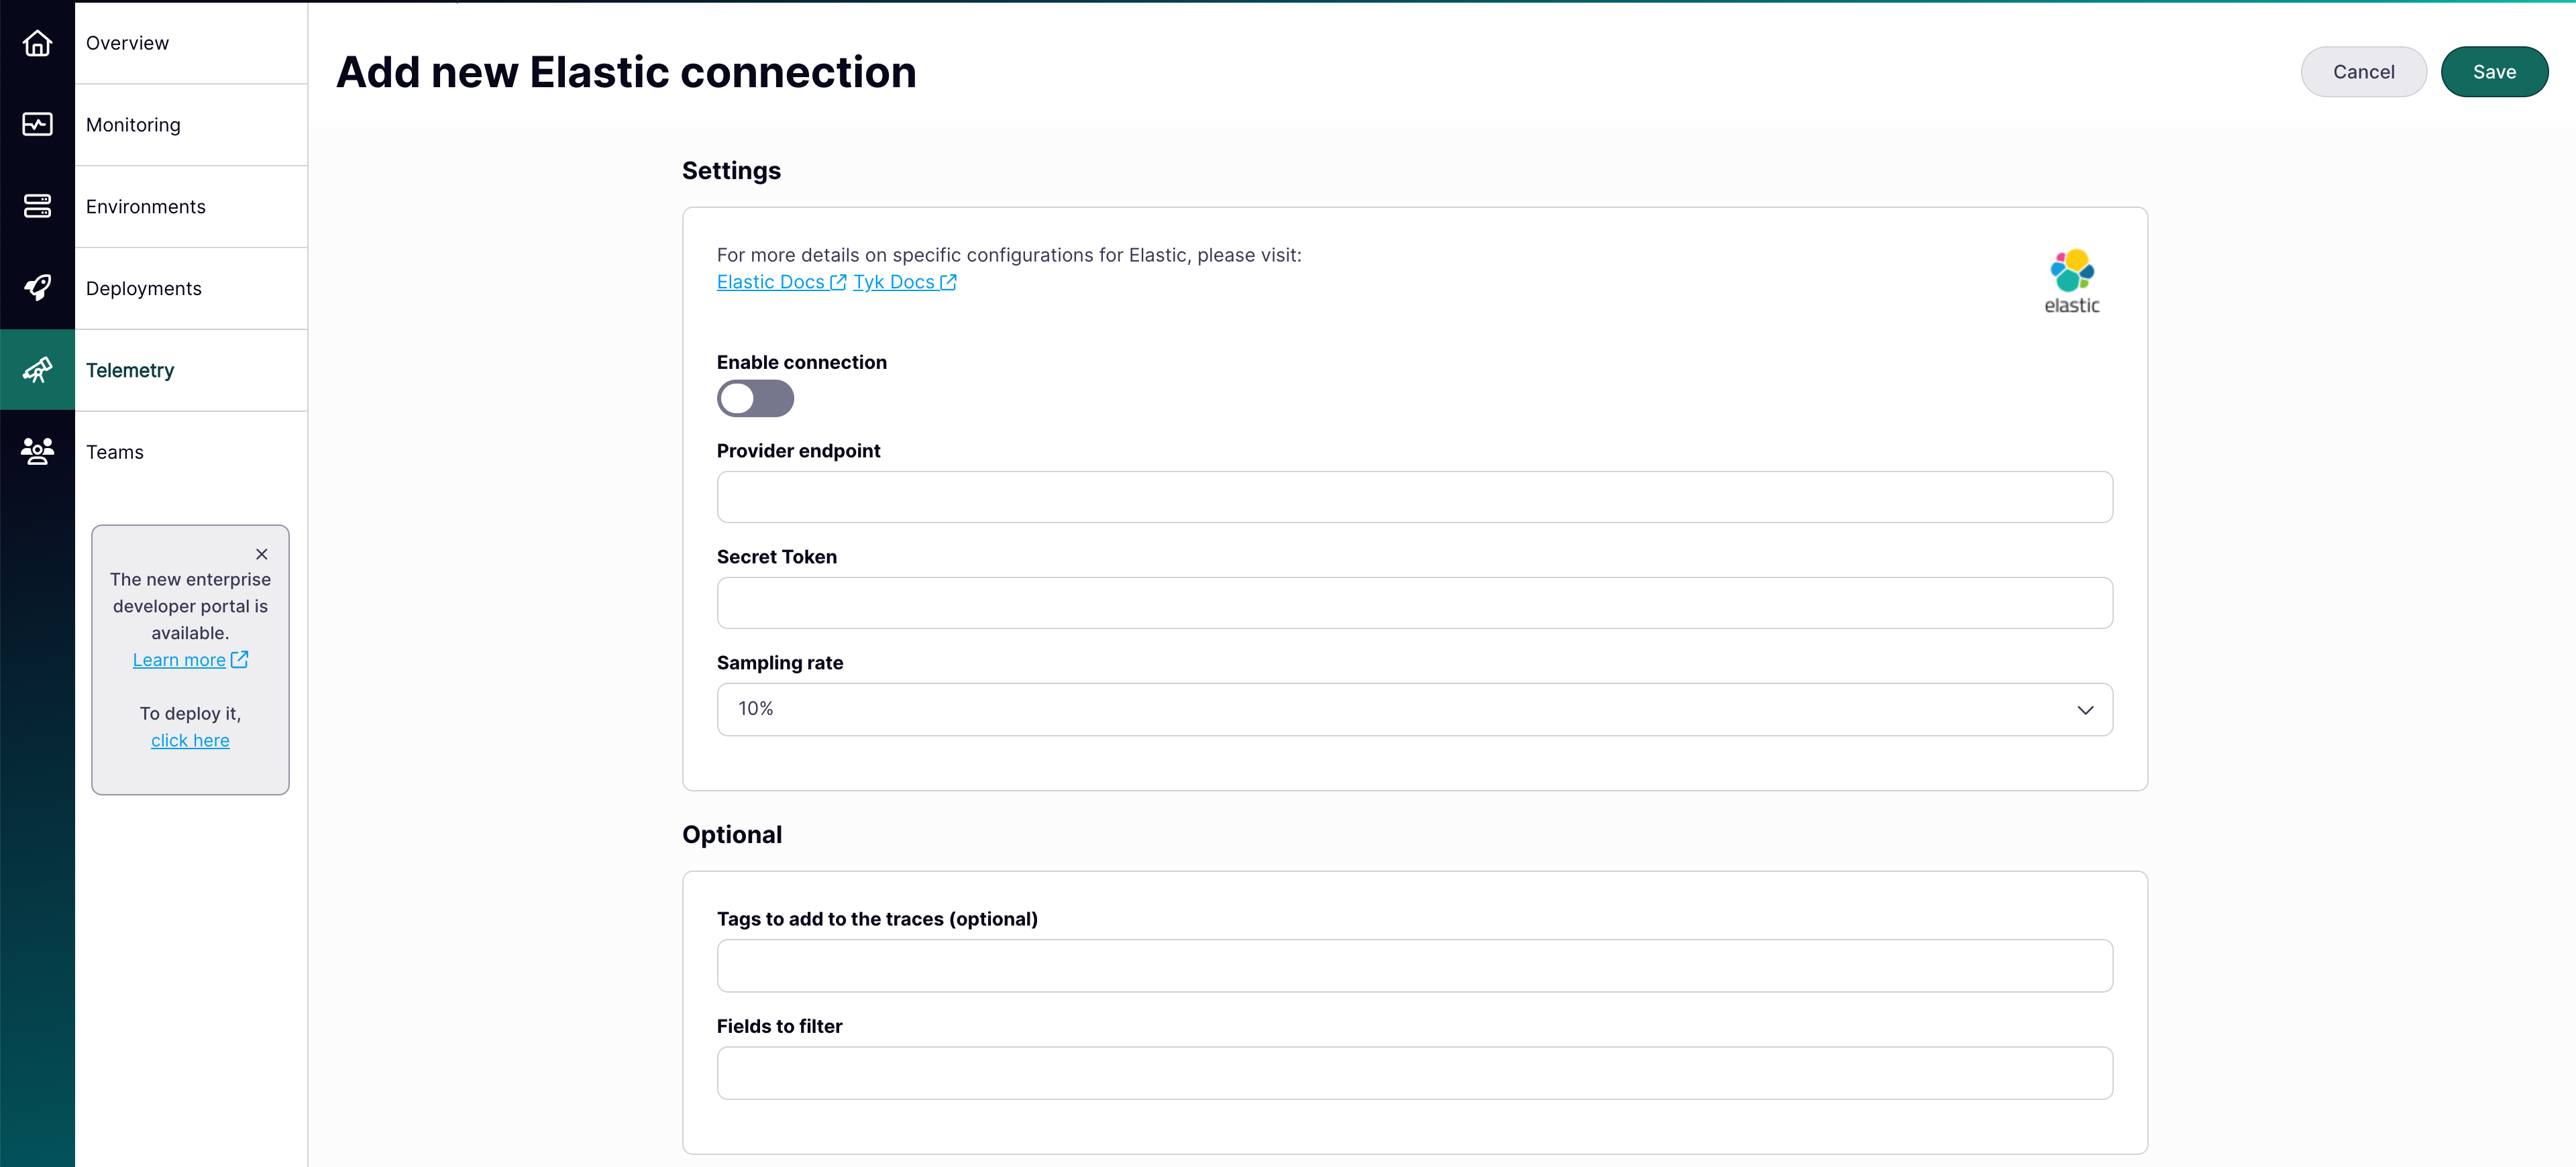
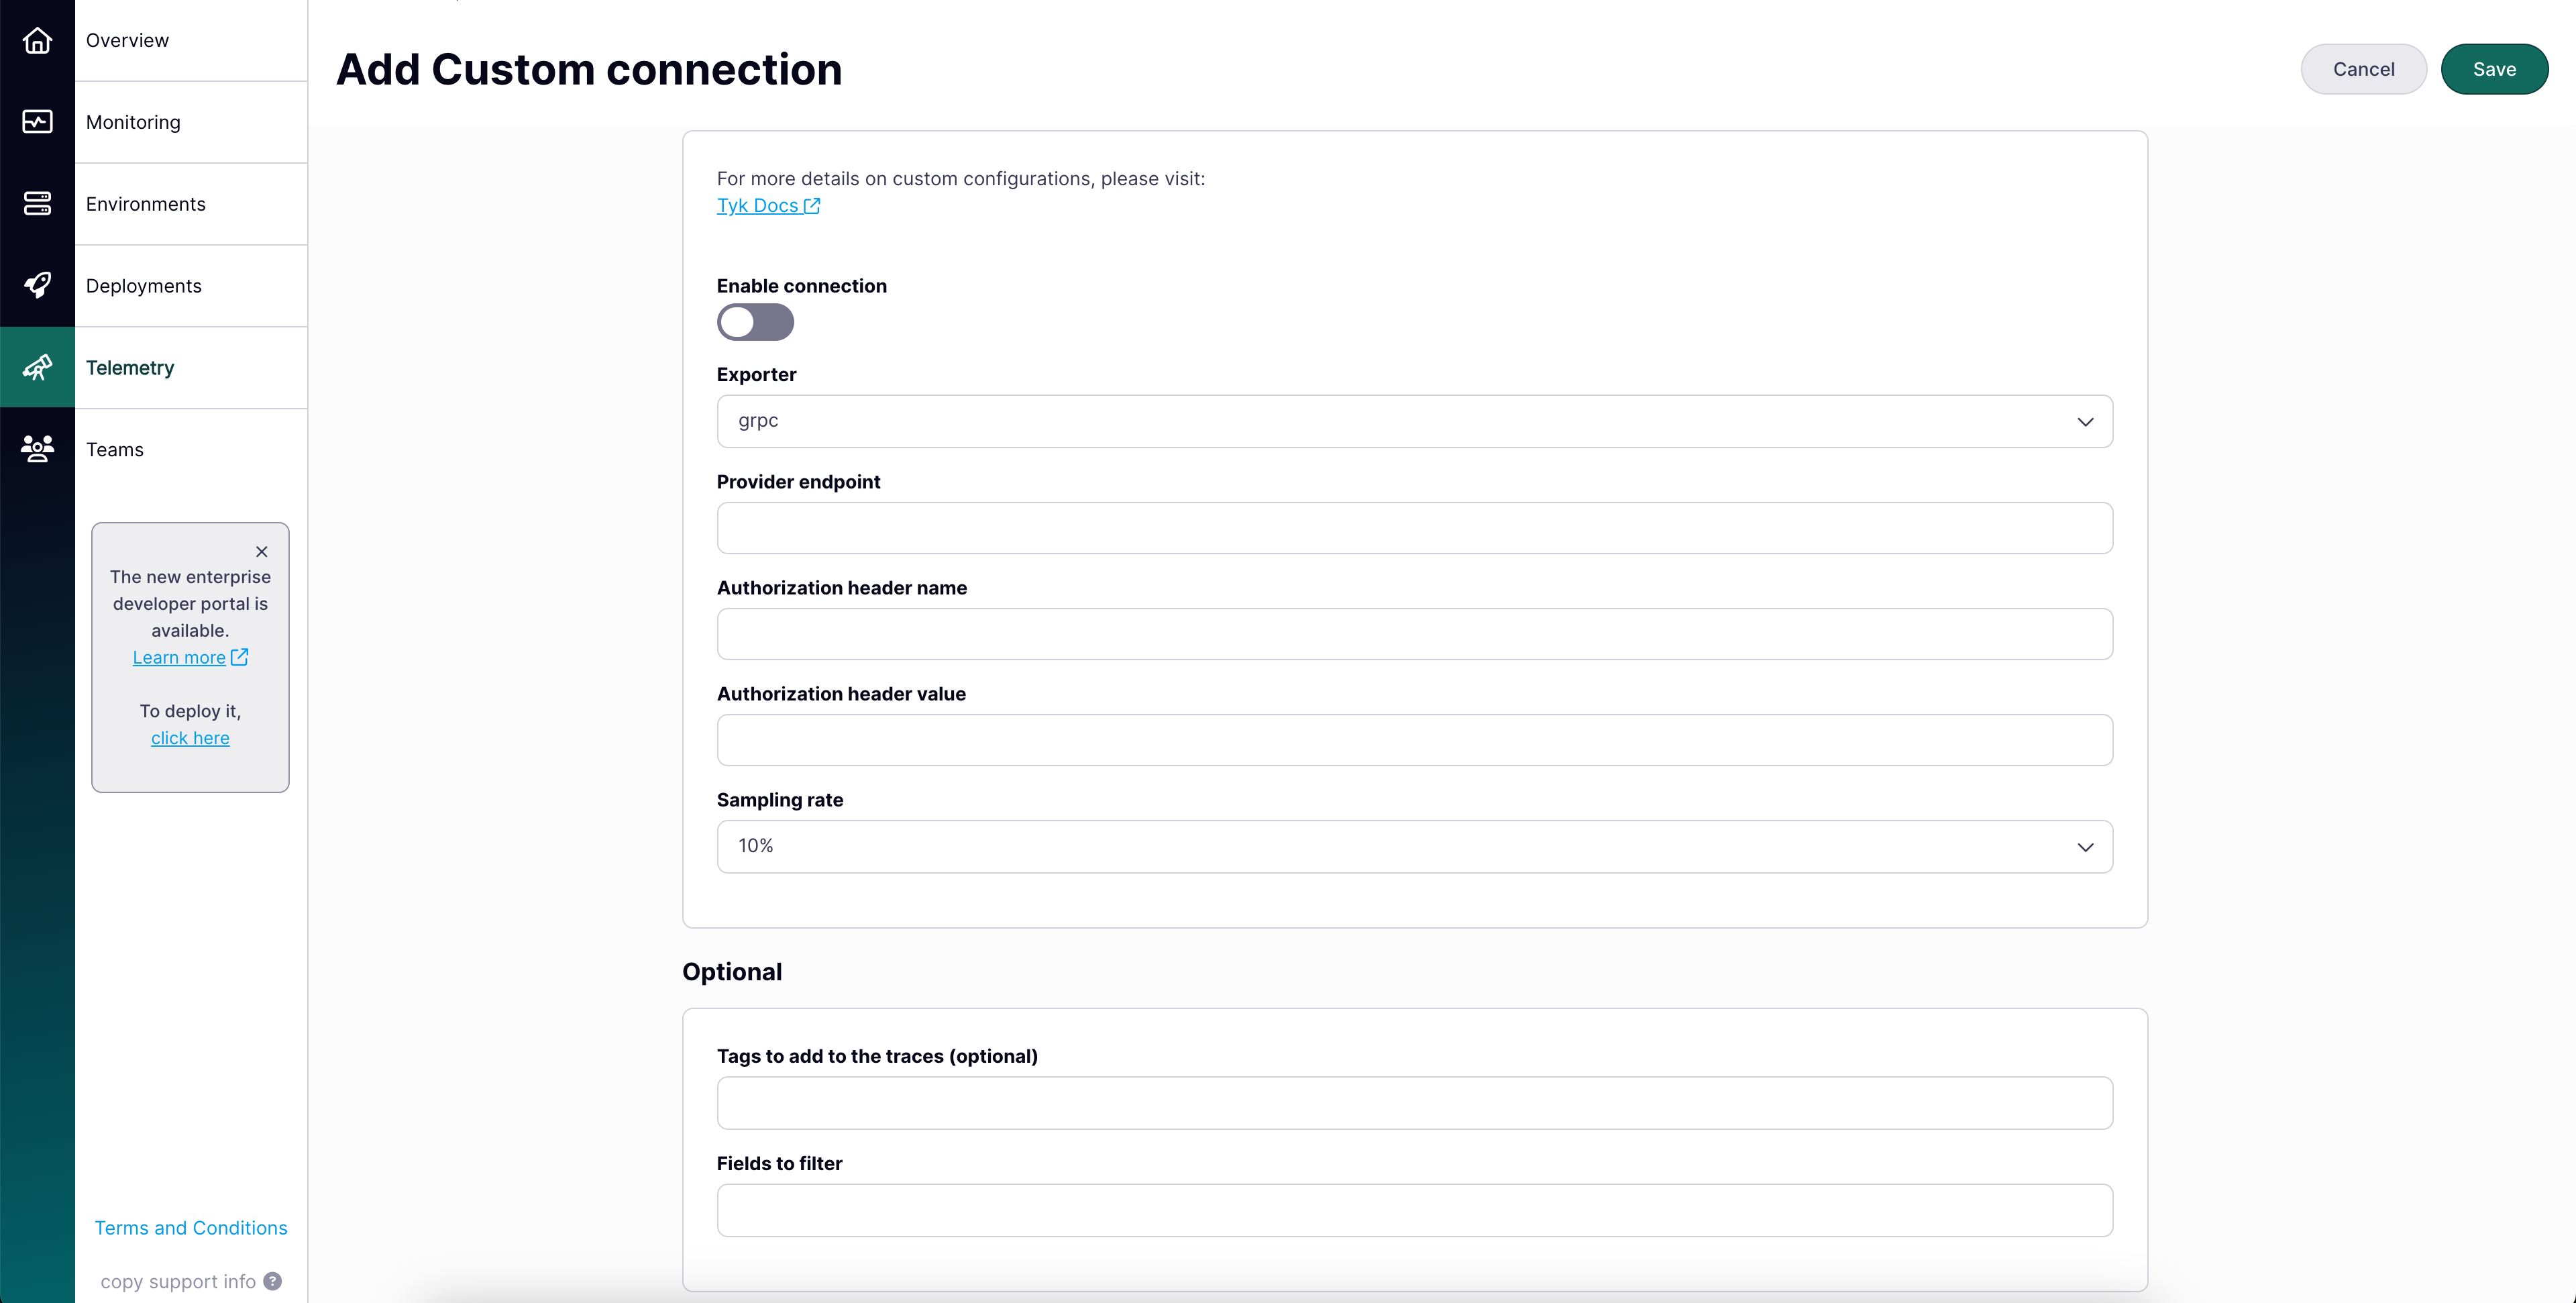
Configure the following settings shared by all providers:
- Connection Toggle: Activates or deactivates telemetry export. When enabled, Tyk sends monitoring data to your chosen platform.
- Sampling Rate: Percentage of API traffic to send (default: 10%, meaning one in every ten API calls).
-
Optionally configure:
-
Tags to Add to the Traces: Custom labels that make telemetry data easier to filter and analyze. For example:
- Fields to Filter: Fields to exclude from telemetry, useful for preventing sensitive data from reaching your monitoring platform.
-
Tags to Add to the Traces: Custom labels that make telemetry data easier to filter and analyze. For example:
-
Configure the provider-specific connection settings:
- Datadog
- Dynatrace
- New Relic
- Elastic
- Custom
-
Provider Site: Your Datadog URL (for example,
us5.datadoghq.com). See Datadog site documentation. -
API Key: Your Datadog API key. See Datadog API key documentation.

Step 2: Enable telemetry export on a Cloud Data Plane
Changes to telemetry settings require a Cloud Data Plane redeployment to take effect.- Navigate to your Cloud Data Plane deployment (create new or edit existing).
-
In the telemetry export section, enable the types you want:
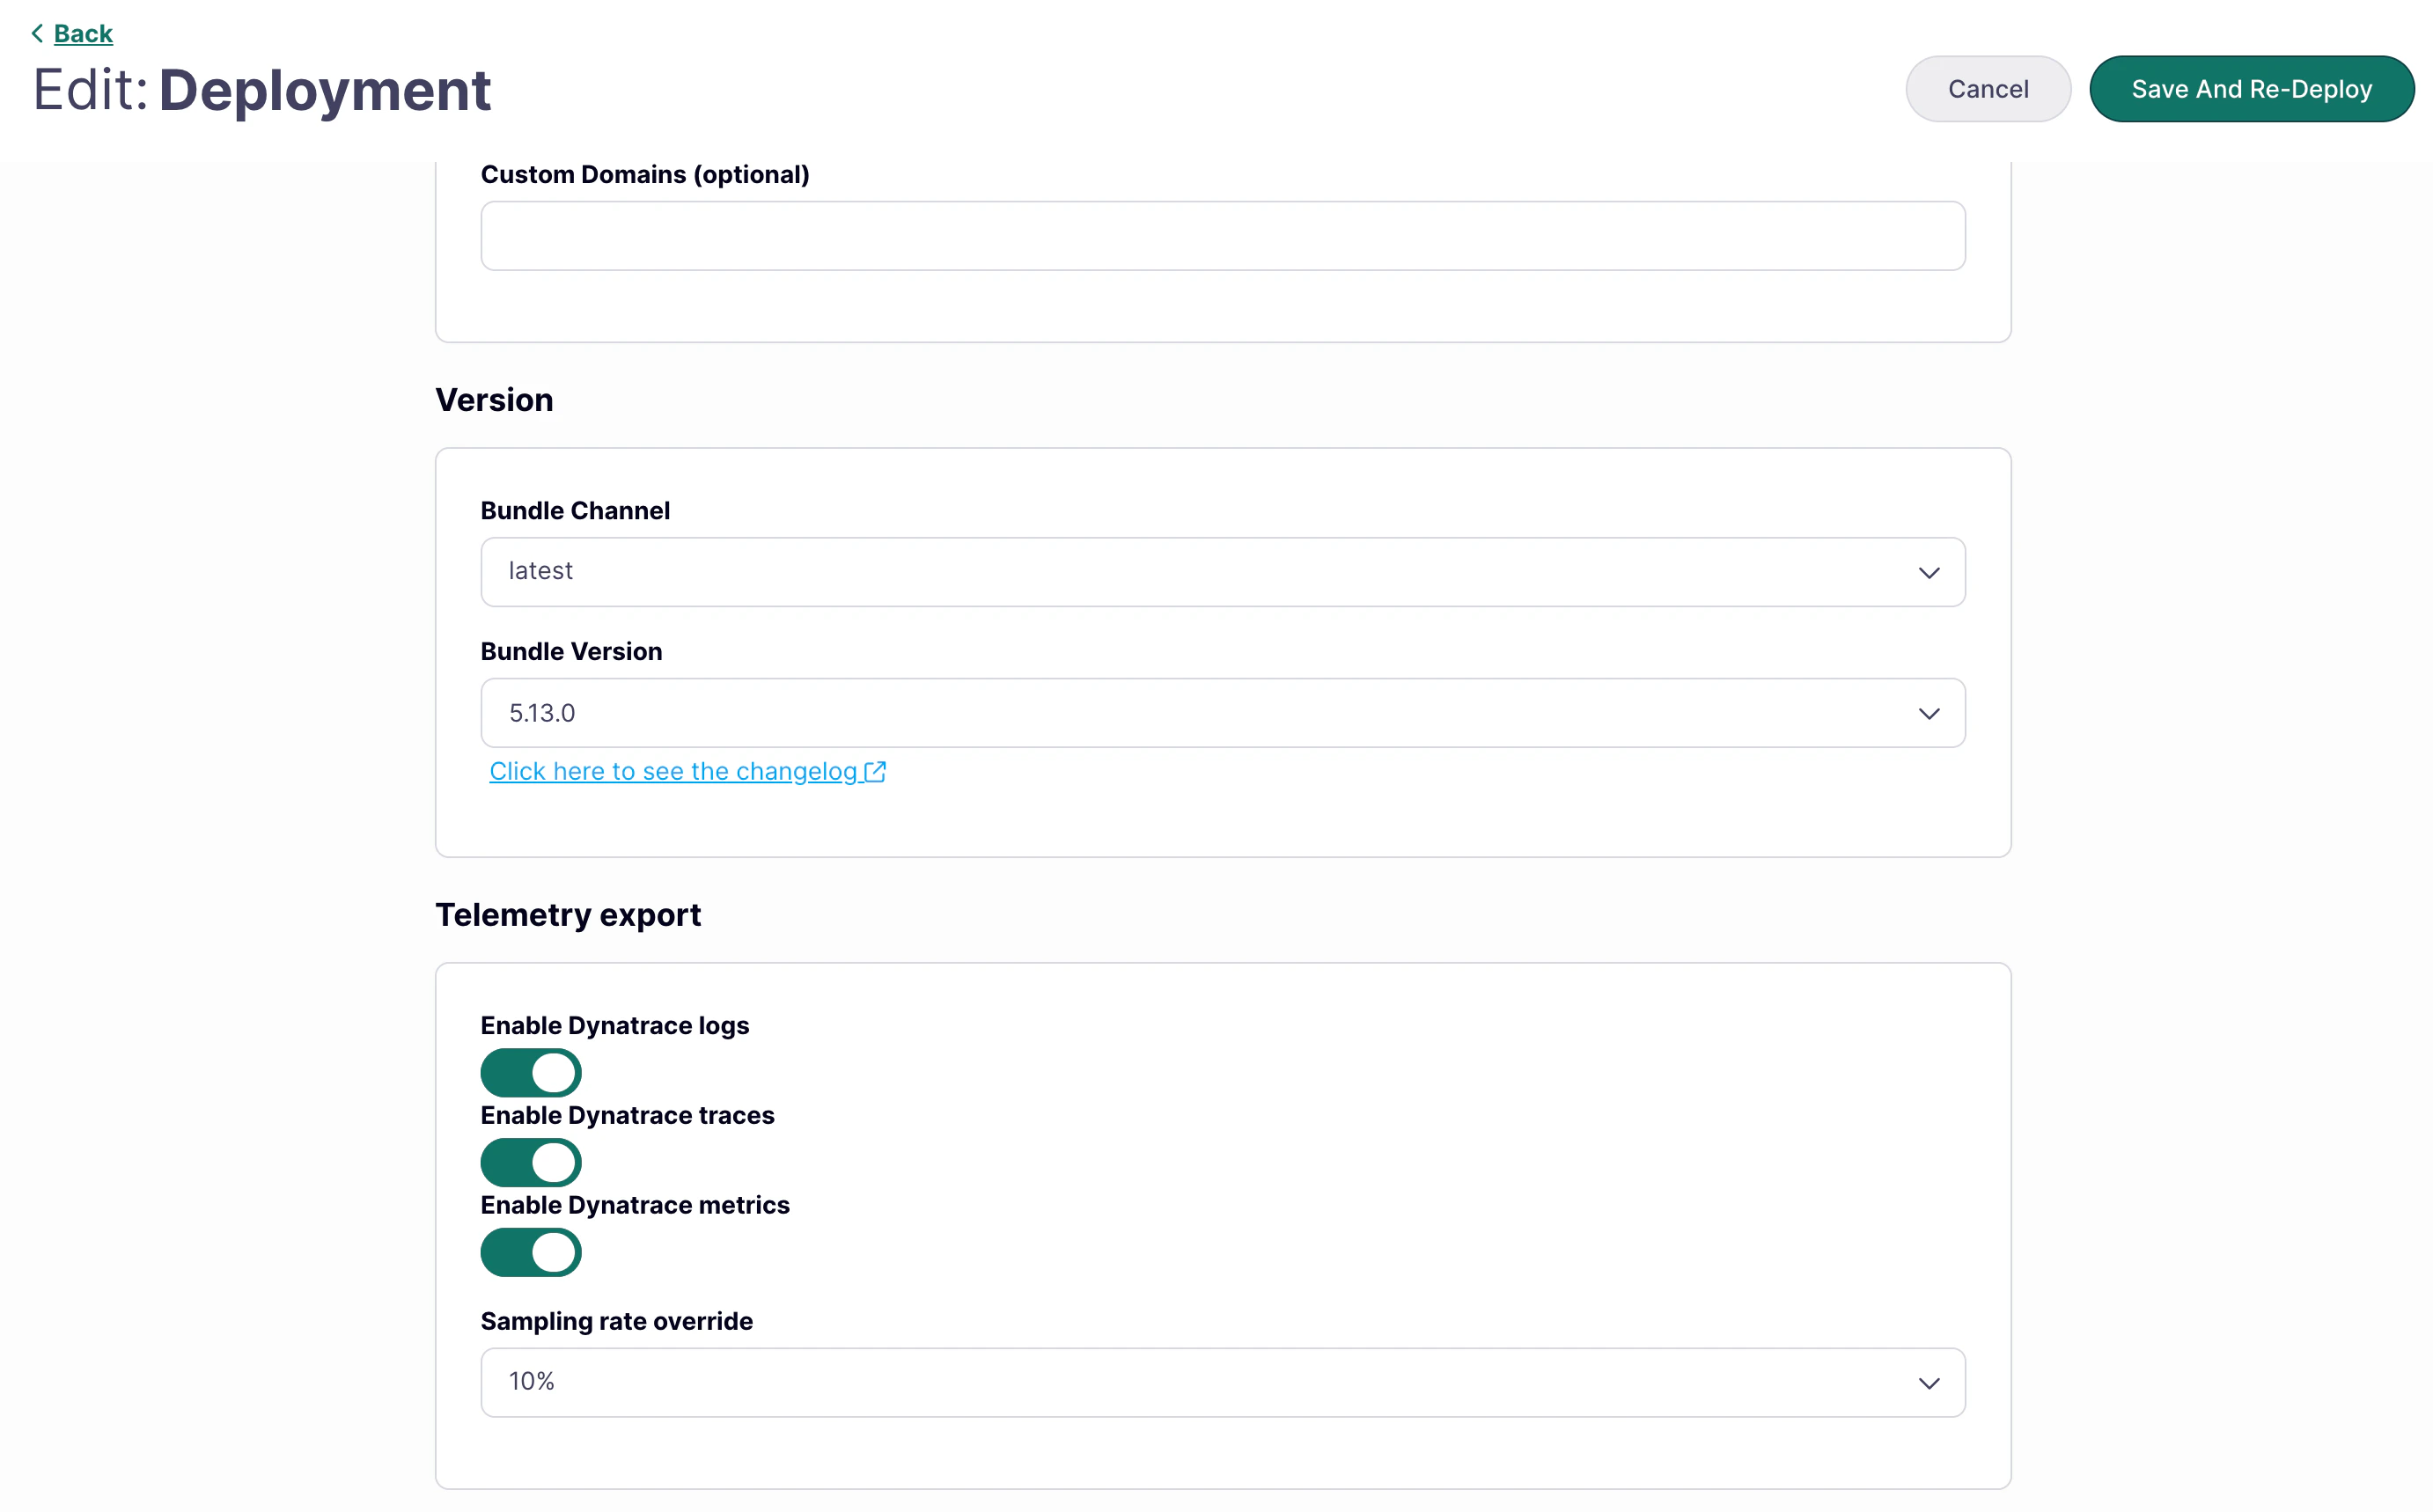
- Enable Traces: Enable distributed tracing.
- Enable Metrics: Enable gateway metrics export (requires Gateway v5.13.0 or later). See Default Metrics Exported for what is included.
- Enable Logs: Enable real-time application log streaming.
-
If traces are enabled, optionally set a Sampling Rate Override to control what percentage of trace data to export (default: 10%). This setting applies to traces only — not metrics or logs.
The sampling rate can be set at the organization level and overridden per Cloud Data Plane. The Cloud Data Plane setting takes precedence.
- Save and redeploy the Cloud Data Plane.
-
In the deployment overview, confirm that Telemetry Export shows as enabled:

Default Metrics Exported
When metrics are enabled, Tyk exports the following RED (Rate, Error, Duration) metrics by default:| Metric | Description | Example Values |
|---|---|---|
| HTTP Method | HTTP method used in the request | GET, POST, PUT, DELETE |
| API ID | Unique identifier of the API | api-12345 |
| HTTP Response Code | HTTP status code returned | 200, 404, 500 |
Metric customization (additional dimensions, filtering) is not self-service. Submit a support request at support.tyk.io to configure custom dimensions.Custom metric dimensions can significantly increase cardinality, which affects gateway memory usage and your observability platform’s storage costs.