The Tyk Dashboard is a powerful web-based interface that serves as the central management hub for your API ecosystem. It provides a user-friendly Graphical User Interface (GUI) for configuring, monitoring, and analyzing your APIs managed by Tyk.The Dashboard also exposes a REST API, allowing for programmatic control and integration with other tools and workflows.This page introduces general features of dashboard and how to configure them. If you are looking for global configurations of the Dashboard deployment refer this config file.We will delve into the following key topics:
Exploring the Dasbhoard API: Explore the Dashboard APIs, including their classification, authentication methods, and usage examples with Swagger and Postman collections.
Monitoring and Traffic Analytics: Exploration of Tyk’s traffic analytics capabilities, including logging mechanisms, error tracking, endpoint analysis, and various activity type measurements.
System Management: Detailed overview of Tyk’s system management capabilities, including Admin API functionalities, organization management and configuting audit logs.
Supported Database: We will examine Dashboard’s storage requirement, compatible database versions and how to configure them.
Exploring Data Storage Solution: We will explore Dashboard’s multi-layered storage architecture and understand how to configure each storage tier effectively.
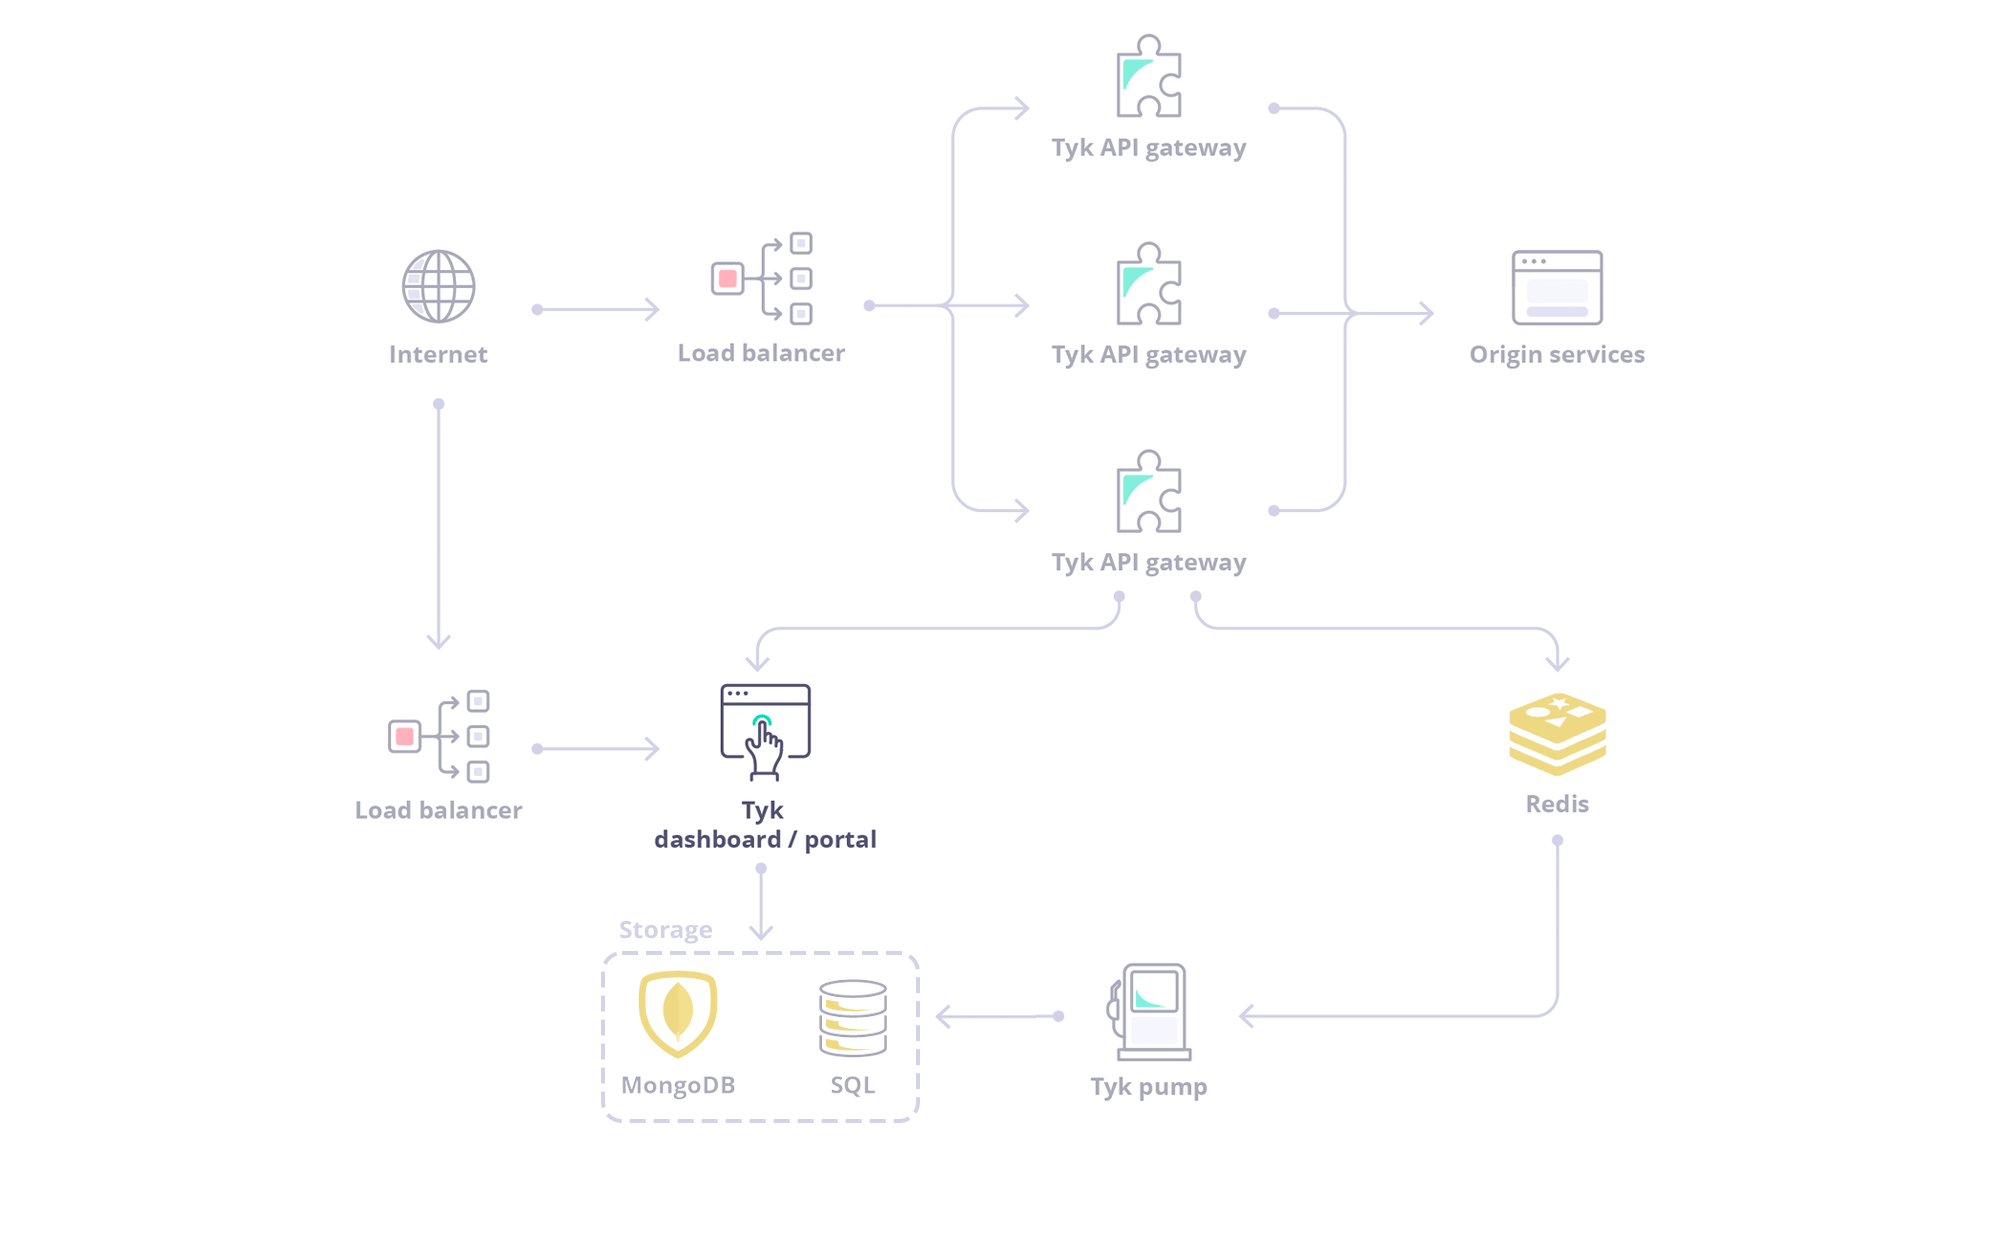
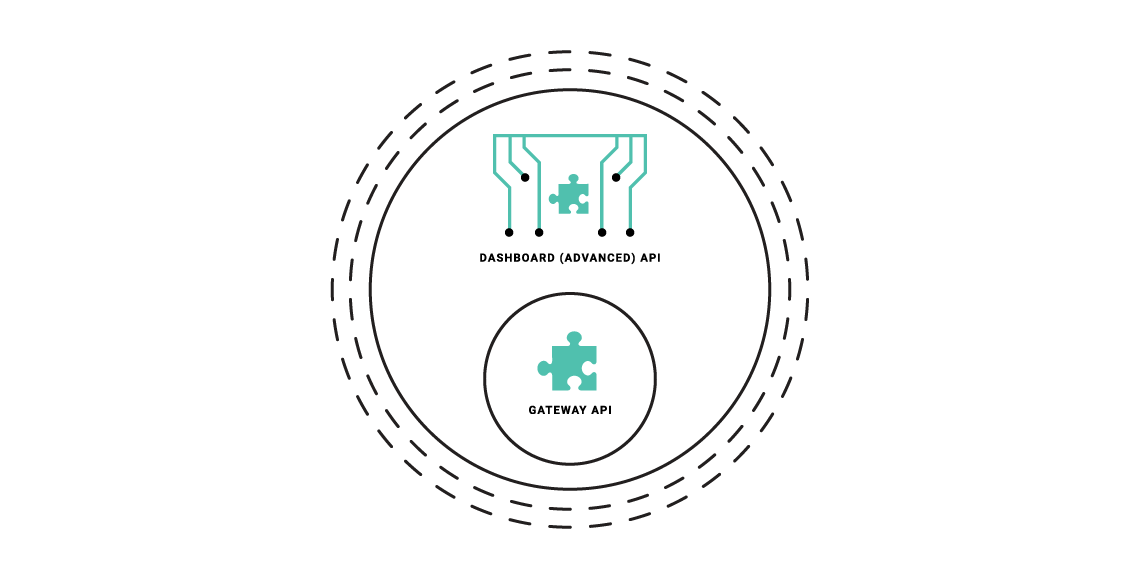
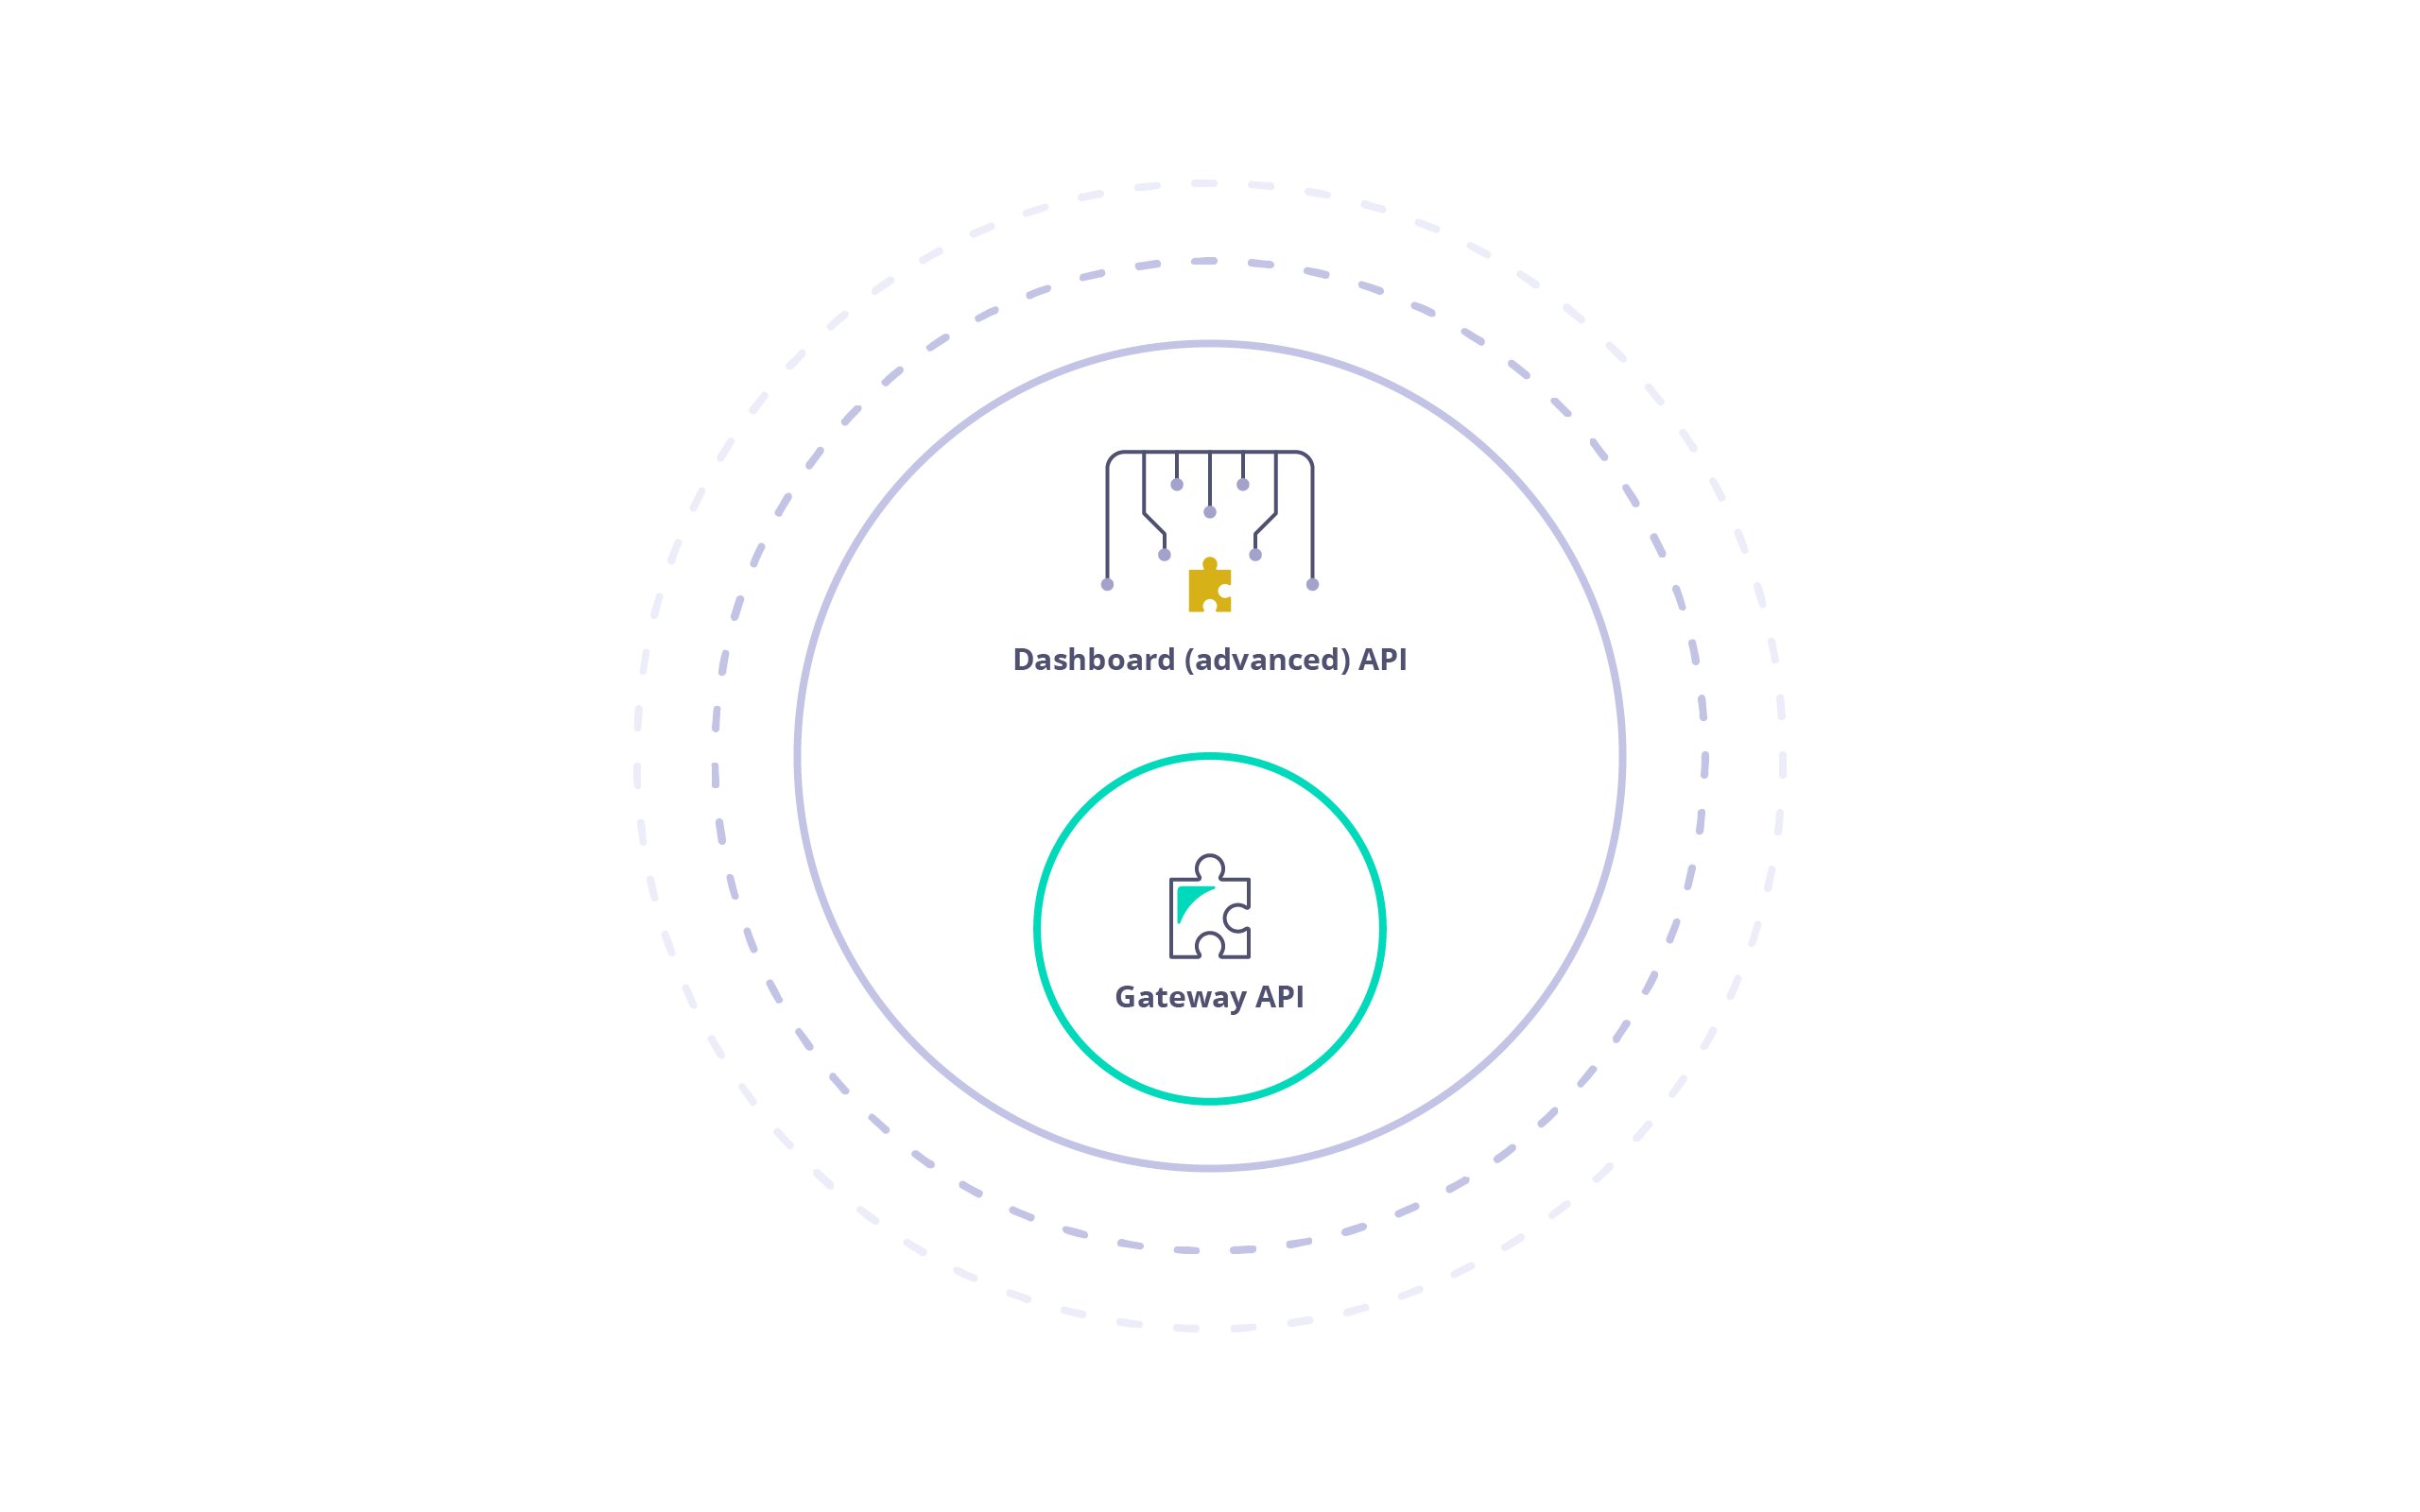
The Dashboard is a large, granular REST API with a thin-client web front-end, and if being deployed as part of a Tyk install, serves as the main integration point instead of the Gateway API.The Dashboard API is a superset of the Gateway API, providing the same functionality, with additional features (anything that can be done in the Dashboard has an API endpoint), and offers some additional advantages:
The Dashboard API has a granular structure, you can create separate clients easily.
The API features read/write permissions on a per-endpoint level to have extra control over integrations.
The API enforces a schema that can be modified and hardened depending on your usage requirements.
Dashboard API: Is used for operational management of Tyk resources (APIs, policies, keys, etc.). This API offers granular permissions based on user roles.To know more about Dashboard APIs, refer the following documents:
Dashboard Admin API: Is used for system-level administration and initial setup tasks like managing organizations, initial user creation, backups/migrations and SSO setup.To know more about Dashboard Admin APIs, refer the following documents:
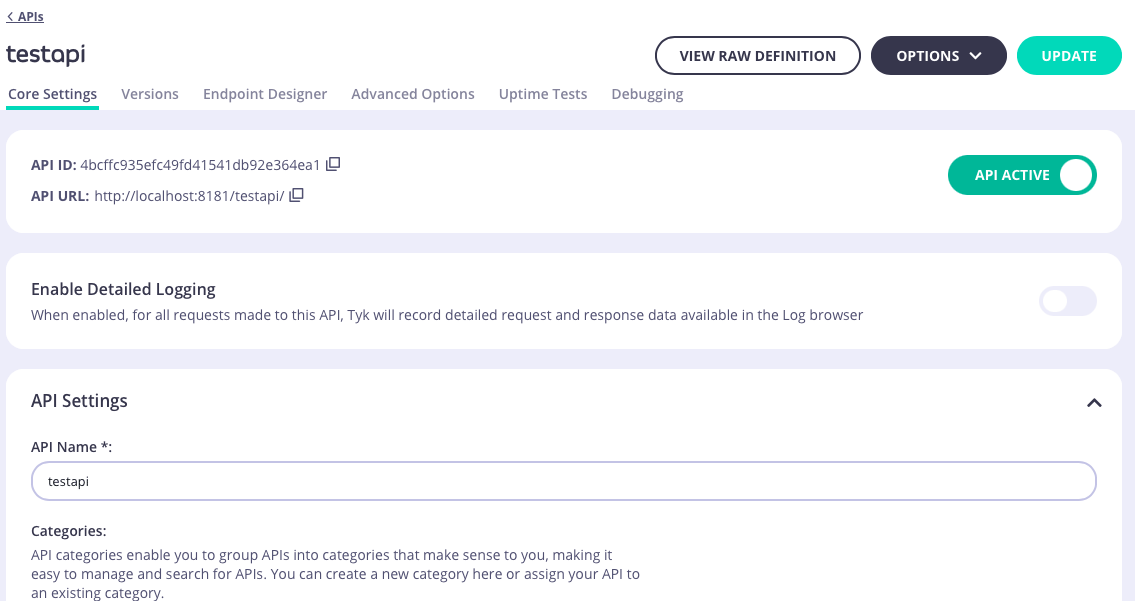
Dashboard APIThe Tyk Dashboard API is secured using an Authorization header that must be added to each request that is made. The Tyk Dashboard API Access CredentialsAuthorization key can be found within the Dashboard UI at the bottom of the Edit User section for a user.Dashboard Admin APIThe Tyk Dashboard Admin API is secured using a shared secret that is set in the tyk_analytics.conf file. Calls to the Admin API require the admin-auth header to be provided, to differentiate the call from a regular Dashboard API call.
The Tyk Dashboard API is a superset of the Tyk Gateway API, enabling (almost) all of the core features and adding many more. The Dashboard API is also more granular and supports Role Based Access Control (RBAC) on both a multi-tenant, and user basis.Using the Dashboard API it is possible to set Read / Write / ReadWrite / Deny access to sections of the API on a user by user basis, and also segregate User / Key / API Ownership by organization.The availability of RBAC varies depending on the license or subscription. For further information, please check our price comparison or consult our sales and expert engineers
For optimal results, it is advisable to exclusively employ the Tyk Dashboard API (avoiding direct calls to the Tyk Gateway API) within a Self-Managed setup, enabling the Dashboard to manage the Tyk API gateways cluster.
Selected Dashboard APIs can be paginated.You can select the number of result pages to return by adding a parameter p which starts at 1. At the default page size, this returns items 1-10. Setting p to 2 returns items 11-20 and so on. Alternatively, passing 0 or lower as a parameter will return all items.The default page size is 10. You can overwrite the default page size in your tyk_analytics.conf using the page_size key. It’s suggested you do not modify it as it will affect the performance of the Dashboard.Sample Request:
GET /api/apis/?p=1 HTTP/1.1Host: localhost:3000authorization:7a7b140f-2480-4d5a-4e78-24049e3ba7f8
Creating API definitions is slightly different to the core API, API definitions are wrapped inside an api_definition field and event handlers, such as webhooks are not embedded in the main api_defintion object (though they can be), webhooks are instead appended as references into the hook_references field, the API will embed the correct webhook data into the event handler interface.Please note that ID’s (both id and api_id) are auto-generated by Tyk and cannot be set by the user. In Self-Managed installations api_id can be overwritten with a call to the Update API Definition endpoint, but this is currently not possible when the Dashboard resides in Tyk Cloud.
Please note that Tyk matches the Ignored paths in the order in which they are specified in the ignored array. Subpaths of a route are matched automatically and so should be placed above parent routes if they need to be matched individually.
APIs that are created using the advanced Dashboard API are referenced by their internal ID instead of their API-ID.Please note that whilst api_id can be updated for Self-Managed installations, this is currently not possible when the Dashboard resides in Tyk Cloud. Updates to api_id in Tyk Cloud will be ignored.
Currently /api/data-graphs/ has only one endpoint called /data-sources with only a POST HTTP method.The Dashboard exposes the /api/data-graphs/data-sources/import endpoint which allows you to import an AsyncAPI or OpenAPI document.
The fetched document can be an OpenAPI or AsyncAPI document. The format will be detected automatically. The data source import API only checks the fetched data and tries to determine the document format, the status codes are ignored.
It returns an error if it fails to determine the format and the document type. HTTP 500 is returned if a programming or network error occurs. If the fetched request body is malformed then HTTP 400 is returned.
It returns analytics of the endpoints of all APIs called using KEY between start and end date.Sample Request
To get analytics of all endpoints called using the key 7f3c3ca87376cabe between October 13th 2020 and October 14th 2020, make the following call:
GET api/activity/keys/endpoint/7f3c3ca87376cabe/13/10/2020/14/10/2020 HTTP/1.1Host: localhost:3000authorization: 7a7b140f-2480-4d5a-4e78-24049e3ba7f8
It returns analytics of the all endpoints called using the given OAuth Client ID.Sample Request
To get activity of all endpoints which used OAuth client 27b35a9ed46e429eb2361e440cc4005c between October 13th 2020 and October 14th 2020, make the following call:
GET /api/activity/oauthid/endpoint/27b35a9ed46e429eb2361e440cc4005c/13/10/2020/14/10/2020 HTTP/1.1Host: localhost:3000authorization: 7a7b140f-2480-4d5a-4e78-24049e3ba7f8
You can add a user via the API without a password by leaving out the password field. You then use Set User Password request to add a password.
You need to have the usersPermission object set to write to use Add User.If you do set a password, you need to keep a record of it, to enable the password to be reset in the future.
If a user is created with a blank password, you will need to add a password in a second API call to set a password. In this scenario, the current_password field is not required. To change an current password, you need to know the existing password set in Add User.You need to have the usersPermission object set to read to use Set User Password.
This call allows you to reset a user’s current Dashboard session.You need to have the usersPermission object set to write to use this call.
This also resets the user’s Dashboard API credentials.
Property
Description
Resource URL
/api/users/{USER_ID}/actions/key/reset
Method
PUT
Type
None
Body
{"userId":"{USER_ID}"}
Param
None
Sample Request
PUT /api/users/54c25e845d932847067402e2/actions/key/reset HTTP/1.1Host: localhost:3000authorization:7a7b140f-2480-4d5a-4e78-24049e3ba7f8{ "userId":"{USER_ID}"}
This API helps you to add and delete (CRUD) a list of additional (custom) permissions for your Dashboard users.
Once created, a custom permission will be added to standard list of user permissions. Only Admin Dashboard users will be authorized to use this API.
This API returns by default the initial set of additional permissions defined in your Tyk Dashboard configuration, under security.additional_permissions.Once you update the permissions via the API, they will be stored at organization level.
Property
Description
Resource URL
/api/org/permissions
Method
GET
Type
None
Body
None
Param
None
Sample Request
GET /api/org/permissions HTTP/1.1Host: localhost:3000authorization:7a7b140f-2480-4d5a-4e78-24049e3ba7f8
Whenever you want to add/update/delete an additional permission, just send back the updated list of permissions, through a PUT request to the API.
Property
Description
Resource URL
/api/org/permission
Method
PUT
Type
None
Body
Permissions Object
Param
None
Sample RequestLet’s imagine we have already defined two additional permissions: api_developer and api_manager. In order to add a new permission to this list, just send
an updated list of permissions by appending the values you want. In this example we will add a custom_permission permission.
GET /api/apis/39d2c98be05c424371c600bd8b3e2242/keys/54b53d3aeba6db5c3500000289a8fbc2bbba4ebc4934bb113588c792 HTTP/1.1Host: localhost:3000authorization:7a7b140f-2480-4d5a-4e78-24049e3ba7f8
You might be wondering why access_rights is necessary, as we are adding a security policy and inheriting the access rights from there. That’s because of legacy functionality. We need to add any APIs api_id to the key of the access_rights map, as well as the api_id value of that key. This will all get overwritten by the policy, but we need to add it.Sample Response:
You can now use my-custom-key as a key to access the API. Furthermore, you can use it to lookup the key in the Dashboard as well as the generated key_hash in the response.Let’s try curling it:
Basic Auth users are essentially a form of API token, just with a customized, pre-set organization-specific ID instead of a generated one. To interact with basic auth users, you can use the API Token API calls (list, get delete etc.)
Retrieve All Current Tokens for Specified OAuth2.0 Client
This endpoint allows you to retrieve a list of all current tokens and their expiry date for a provided API ID and OAuth-client ID in the following format. This endpoint will work only for newly created tokens.
This option is available from v2.6.0 onwards.
Property
Description
Resource URL
/api/apis/oauth/{apiID}/{oauthClientId}/tokens
Method
GET
Type
Body
NONE
Sample Request
GET /api/apis/oauth/528a67c1ac9940964f9a41ae79235fcc/25348e8cf157409b52e39357fd9578f1/tokens HTTP/1.1Host: localhost:3000Authorization: {{API Access Credentials}}Cache-Control: no-cache
You can control how long you want to store expired tokens in this list using oauth_token_expired_retain_period which specifies retain period for expired tokens stored in Redis. By default expired token not get removed. See here for more details.
This endpoint is used in the Authorization Code Grant flow, generating an authorization code that can be used by the client to request an access token.
Property
Description
Resource URL
/api/apis/oauth/{{api_id}}/authorize-client/
Method
POST
Type
Form-Encoded
Body
Fields (see below)
api_id: Unlike the other requests on this page, this must be the api_id value and NOT the API’s id value.
response_type: Should be provided by requesting client as part of authorization request, this should be either code or token depending on the methods you have specified for the API.
client_id: Should be provided by requesting client as part of authorization request. The Client ID that is making the request.
redirect_uri: Should be provided by requesting client as part of authorization request. Must match with the record stored with Tyk.
key_rules: A string representation of a Session Object (form-encoded). This should be provided by your application in order to apply any quotas or rules to the key.
Note that in the following example, the policy_id isn’t included in the request as these are optional. OAuth2.0 Flow also supports callbacks which can be added to the key_rules in the payload in requests that don’t include the policy_id.Sample Request
This functionality is available from v2.9.0. If you have an older version please using the admin api
The Dashboard SSO API allows you to implement custom authentication schemes for the Dashboard and Portal.
Our Tyk Identity Broker (TIB) internally also uses this API.
The Dashboard exposes the /api/sso Dashboard API which allows you to generate a temporary authentication token, valid for 60 seconds.You should provide JSON payload with the following data:
ForSection - scope with possible values of "dashboard" or "portal" only.
OrgID - organization id
EmailAddress - user email
GroupID - user group id ( it is the mongo id and you can can find it in the url when opening a user group via Tyk- Dashboard UI or if you call Tyk-Dashboard REST API /api/usergroups )
The Open Policy Agent API helps you to manage (CRUD) the OPA (Open Policy Agent) rules that are being applied to the Tyk Dashboard. You can also change the OPA settings, such as to enable/disable it or enable/disable the debug mode.Only Admin role Dashboard users are authorized to use it.
This endpoint returns by defaul the initial set of OPA rules defined in your Tyk Dashboard, which are located in schema/dashboard.rego (accessible in Self-Managed installations).Once you update the rules via the API, the OPA rules will be stored at the organization level.
Property
Description
Resource URL
/api/org/opa
Method
GET
Type
None
Body
None
Param
None
Sample Request
GET /api/org/opa HTTP/1.1Host: localhost:3000authorization:7a7b140f-2480-4d5a-4e78-24049e3ba7f8
Sample Response
{ "open_policy": { "enabled": true, "rules": "default hello = false\r\n\r\nhello {\r\n m := input.message\r\n m == \"world\"\r\n}" }}
Whenever you want to update OPA rules or its settings, send the updated value of the OPA rules or changed values for the settings (enabled) via a PUT request to the permissions endpoint.
Property
Description
Resource URL
/api/org/permission
Method
PUT
Type
None
Body
Permissions Object
Param
None
Sample Request
PUT /api/org/opa HTTP/1.1Host: localhost:3000authorization:7a7b140f-2480-4d5a-4e78-24049e3ba7f8
{ "open_policy": { "enabled": false, "rules": "default hello = false\r\n\r\nhello {\r\n m := input.message\r\n m == \"world\"\r\n}" }}
Sample Response
{ "Status": "OK", "Message": "OPA rules has been updated on org level", "Meta": null}
Important Note on Spelling:While our documentation now uses American English (en-us), the product itself, including all user interfaces, configuration
fields, environment variables, and APIs, continues to use British English spellings. When interacting with the product,
please continue using the British English (en-gb) spellings as appear in the interface and API. This change does not affect
how you use the product; all functionality remains the same. Example: The API endpoint /organisations as shown throughout this page uses British spelling (with an ‘s’ not ‘z’).
In all other instances, such as when describing or referring to this object in the documentation, we will use the
American spelling “organization” with a ‘z’.
In a production environment, you must change the default admin_Secret in thetyk_analytics.conf file. Admin APIs use this value for authentication, and you should set it in the admin-auth header while sending the request.
For the official Tyk Dashboard Admin API Reference, please visit our API Documentation.
When you add a new user, they are created without a password being set. After adding a user, you need to use the Set Password call to set a password using the user-id created.
You can also create a user without an org_id. This will create a “Super User”, who has global access to all APIs, Policies, etc, for all organizations created within Tyk.
If you are modifying a user password, you will need to include an access_key in the body of your request. This can be obtained from doing a GET to the same Resource URL.
The Dashboard Admin SSO API endpoint allows you to implement custom authentication schemes for the Dashboard and Portal. Our Tyk Identity Broker (TIB) internally also uses this API. See Single Sign On for more details.
The Dashboard exposes the /admin/sso Admin API which allows you to generate a temporary authentication token, valid for 60 seconds.You should provide JSON payload with the following data:
ForSection - scope with possible values of "dashboard" or "portal"
To make Tyk installations more portable, the Export API enables you to export key configuration objects required to back-up and re-deploy a basic Tyk Pro installation.
To enable this feature, the minimum required versions for the Gateway and Dashboard are v2.3 and v1.3.1.2, respectively.
The organization object is the most fundamental object in a Tyk setup, all other ownership properties hang off the relationship between an organization and its APIs, Policies and API Tokens.
Property
Description
Resource URL
/admin/organisations/{ORG-ID}
Method
GET
Type
None
Body
None
Param
None
Sample Request
GET /admin/organisations/54bd0ad9ff4329b88985aafb HTTP/1.1Host: localhost:3000admin-auth: 12345
To export APIs and Policies you should use the standard GET APIS endpoint and GET POLICIES list endpoints. The output from these endpoints can be used by the Import API.
The import API enables you to add Organizations, APIs and Policies back into a Tyk installation while retaining their base IDs so that they work together.
To enable this feature, the minimum required versions for the Gateway and Dashboard are v2.3 and v1.3.1.2, respectively.
The Organization object is the most fundamental object in a Tyk setup, all other ownership properties hang off the relationship between an Organization and its APIs, Policies and API Tokens.
Tyk Dashboard’s Endpoint Designer provides a graphical environment for the creation and update of your Tyk Classic APIs.The Endpoint Designer allows to configure all elements of your Tyk Classic API and consists of several tabs, plus a Raw Definition view which allows you to directly edit the Tyk Classic API Definition (in JSON format). Note that
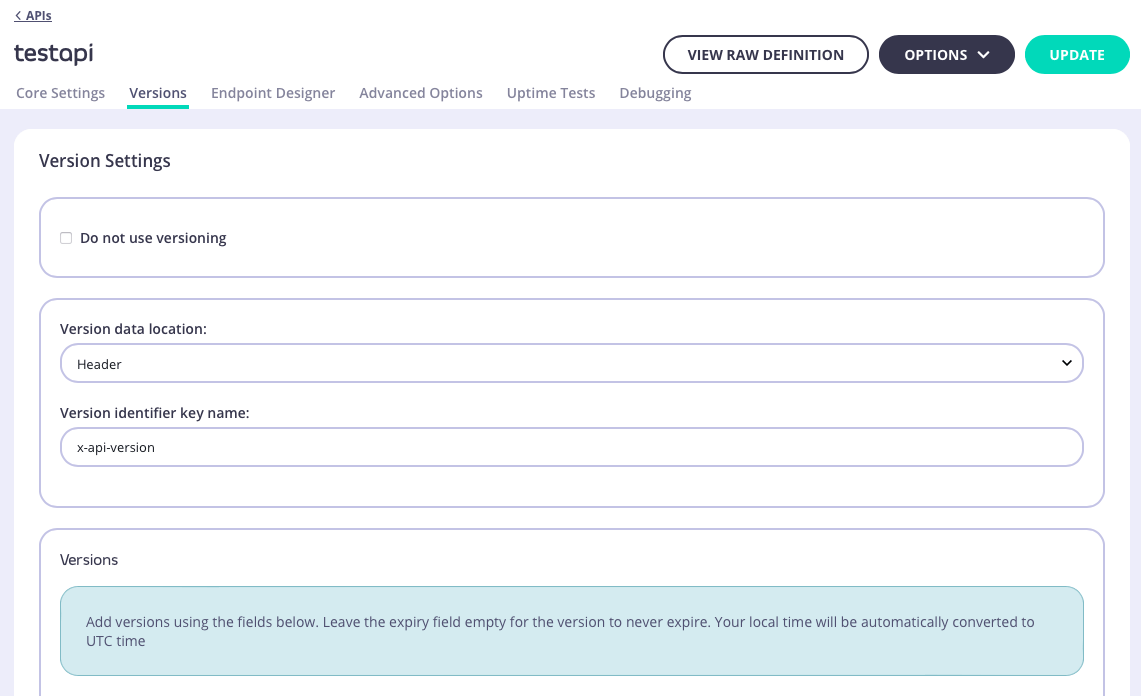
The Versions tab allows you to create and manage API versioning for the API.At the top of the Endpoint Designer, you can see which version you are currently editing. If you have more than one option, selecting it from the drop-down will load its endpoint configuration into the editor.
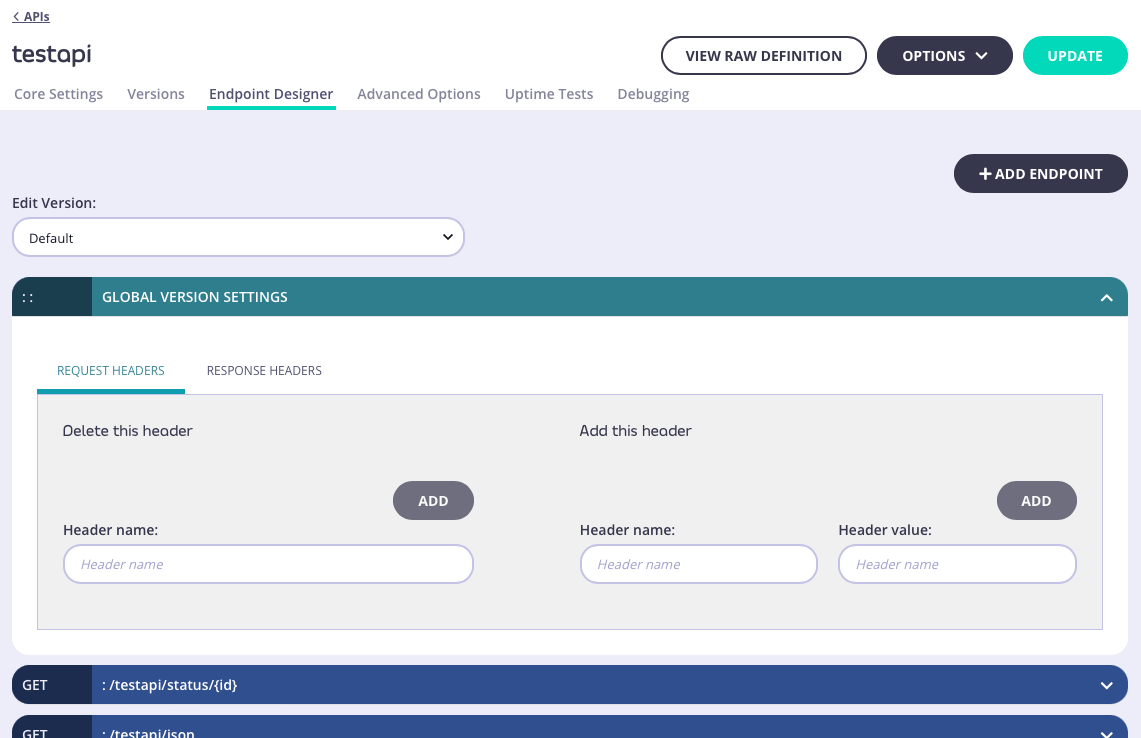
The Endpoint Designer is where you can define endpoints for your API so that you can enable and configure Tyk middleware to perform checks and transformations on the API traffic.In some cases, you will want to set global settings that affect all paths that are managed by Tyk. The Global Version Settings section will enable you to configure API-level request and response header transformation.
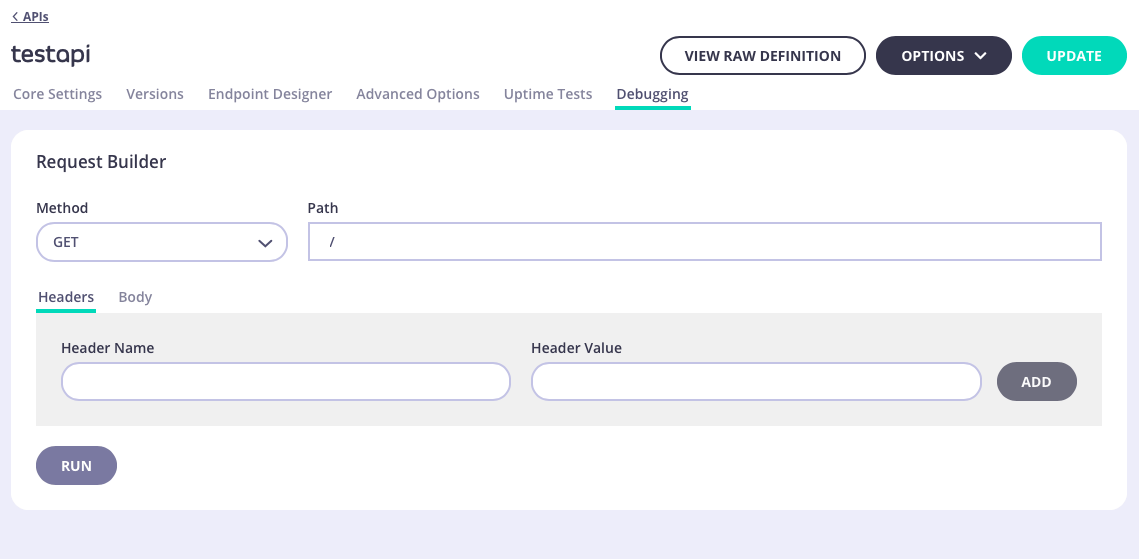
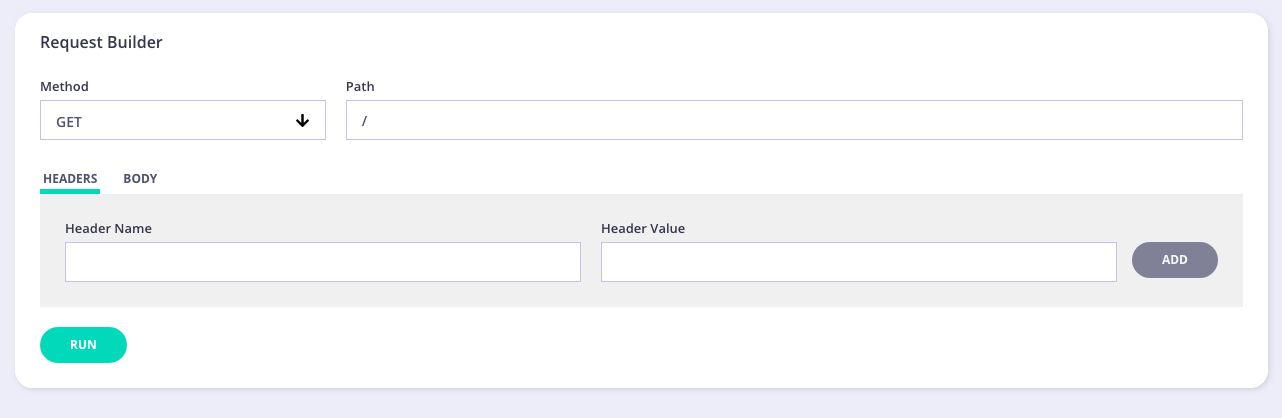
The Debugging tab allows you to test your endpoints before you publish or update them. You can also use it for testing any middleware plugins you have implemented. Any debugging you create will persist while still in the current API, enabling you to make changes in the rest of the API settings without losing the debugging scenario.The Debugging tab consists of the following sections:
Request
Response
Logs
Request
In this section, you can enter the following information:
Method - select the method for your test from the drop-down list
Path - your endpoint to test
Headers/Body - enter any header information, such as Authorization, etc. Enter any body information. For example, entering user information if creating/updating a user.
Once you have entered all the requested information, click Run. Debugging Response and Log information will be displayed:
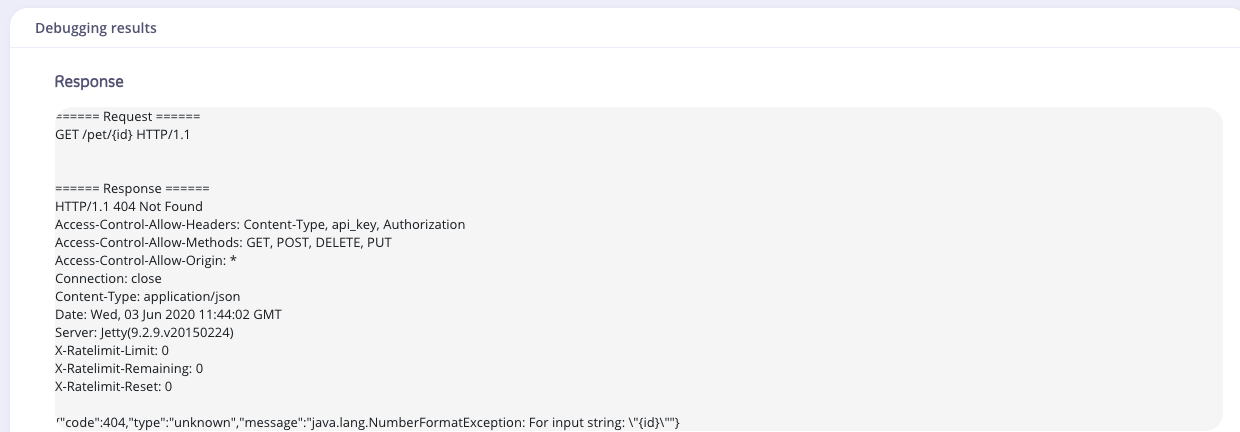
Response
The Response section shows the JSON response to your request.
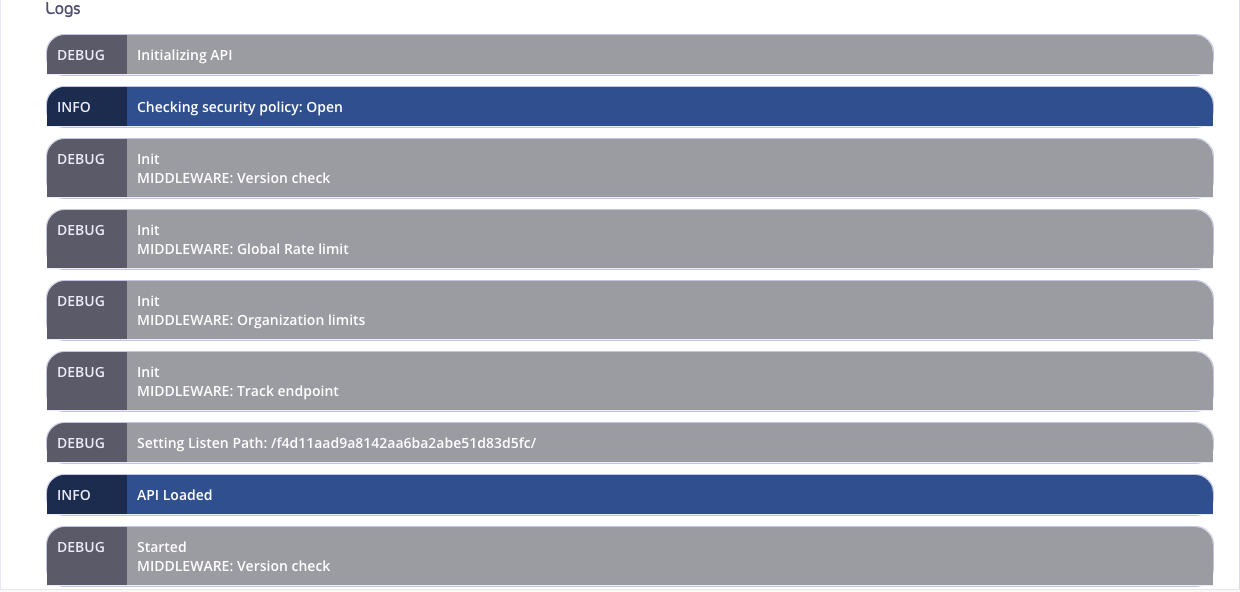
Logs
The debugging level is set to debug for the request. This outputs all logging information in the Endpoint Designer. In the Tyk Gateway logs you will see a single request. Any Error messages will be displayed at the bottom of the Logs output.
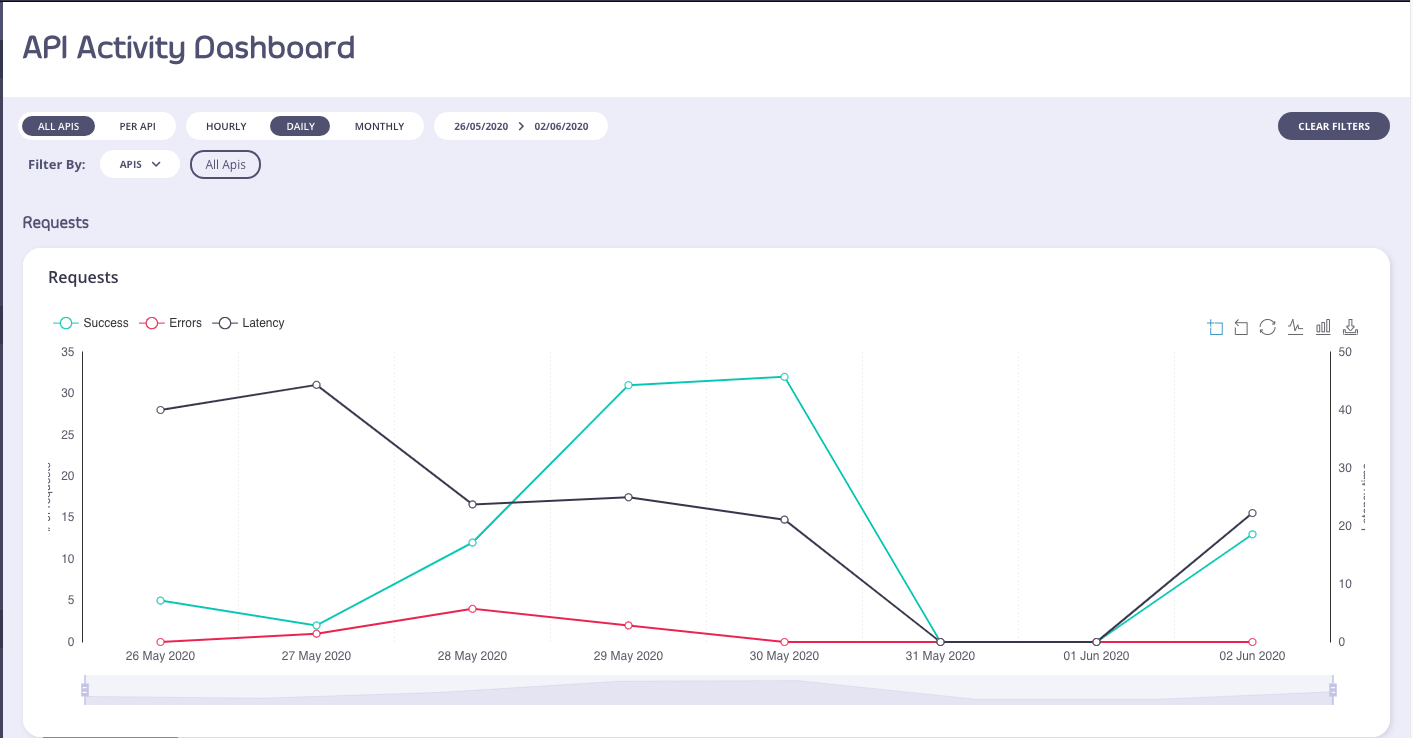
The Tyk Dashboard provides a full set of analytics functions and graphs that you can use to segment and view your API traffic and activity. The Dashboard offers a great way for you to debug your APIs and quickly pin down where errors might be cropping up and for which clients.User Owned Analytics, introduced in Tyk v5.1, can be used to limit the visibility of aggregate statistics to users when API Ownership is enabled. Due to the way that the analytics data are aggregated, not all statistics can be filtered by API and so may be inaccessible to users with the Owned Analytics permission.
For the Tyk Dashboard’s analytics functionality to work, you must configure both per-request and aggregated pumps for the database platform that you are using. For more details see the Setup Dashboard Analytics section.
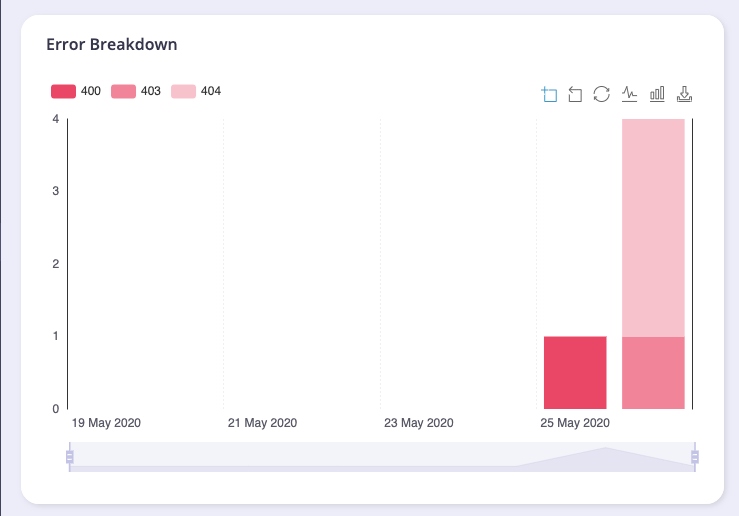
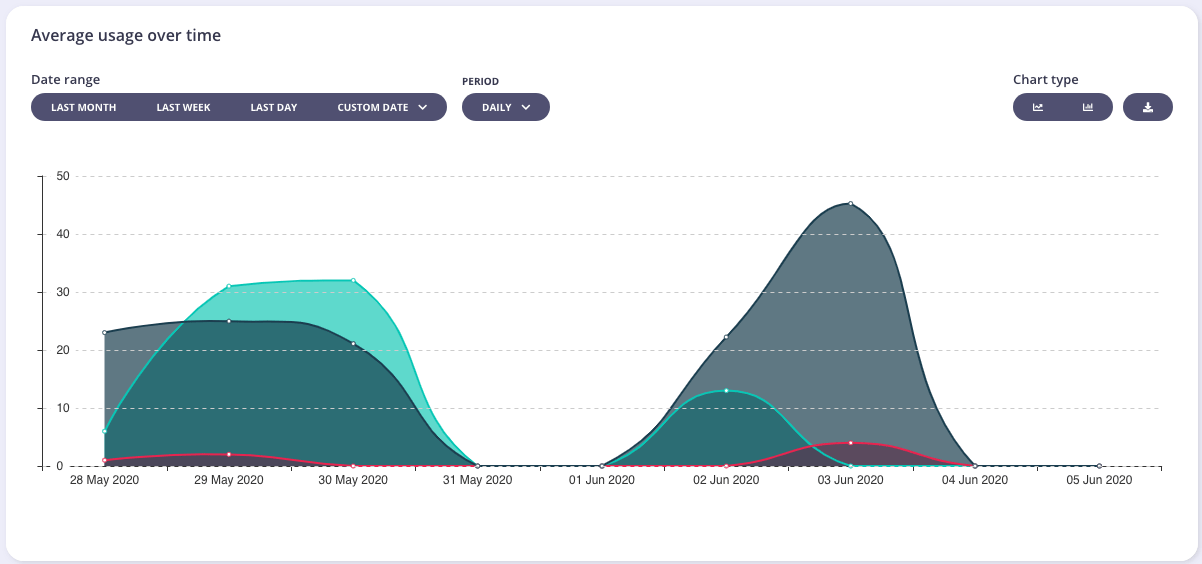
The first screen (and main view) of the Tyk Dashboard will show you an overview of the aggregate usage of your APIs, this view includes the number of hits, the number of errors and the average latency over time for all of your APIs as an average:You can toggle the graphs by clicking the circular toggles above the graph to isolate only the stats you want to see.Use the Start and End dates to set the range of the graph, and the version drop-down to select the API and version you wish to see traffic for.You can change the granularity of the data by selecting the granularity drop down (in the above screenshot: it is set to “Day”).The filter by tag option, in a graph view, will enable you to see the graph filtered by any tags you add to the search.Below the aggregate graph, you’ll see an error breakdown and endpoint popularity chart. These charts will show you the overall error type (and code) for your APIs as an aggregate and the popularity of the endpoints that are being targeted by your clients:
From Tyk v5.1 (and LTS patches v4.0.14 and v5.0.3) the Error Breakdown and Endpoint Popularity charts will not be visible to a user if they are assigned the Owned Analytics permission.
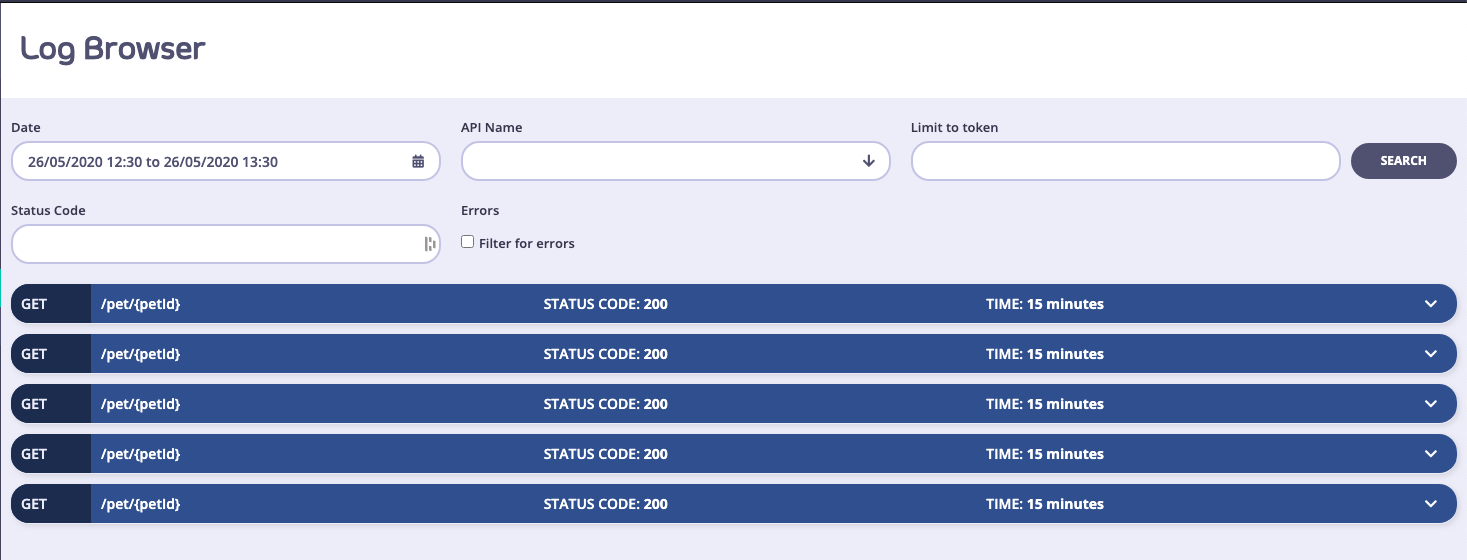
When you look through your Dashboard and your error breakdown statistics, you’ll find that you will want to drill down to the root cause of the errors. This is what the Log Browser is for.The Log Browser will isolate individual log lines in your analytics data set and allow you to filter them by:
API Name
Token ID (hashed)
Errors Only
By Status Code
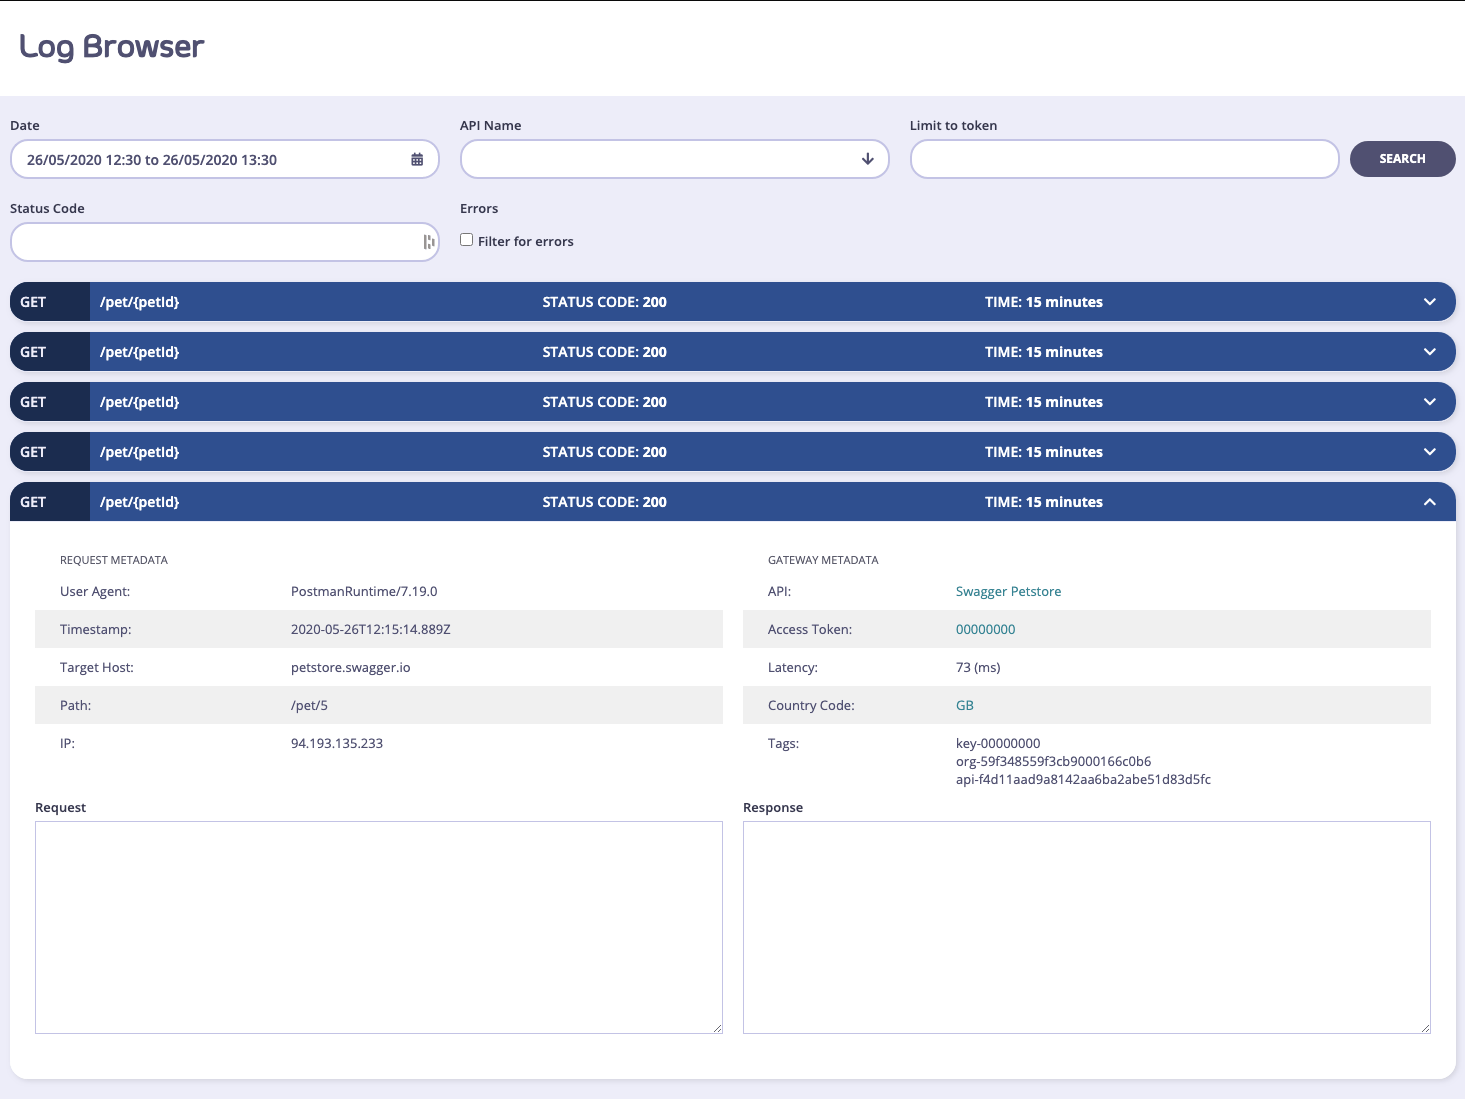
You will be presented with a list of requests, and their metadata:Click a request to view its details.
In an Self-Managed installation, if you have request and response logging enabled, then you can also view the request payload and the response if it is available.
To enable request and response logging, please take a look at useful debug modes .A warning on detailed logging: This mode generates a very large amount of data, and that data exponentially increases the size of your log data set, and may cause problems with delivering analytics in bulk to your MongoDB instances. This mode should only be used to debug your APIs for short periods of time.
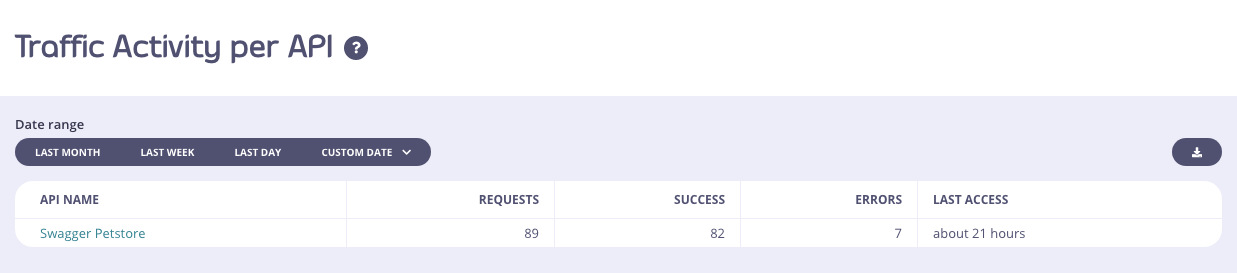
To get a tabular view of how your API traffic is performing, you can select the Activity by API option in the navigation and see a tabular view of your APIs. This table will list out your APIs by their traffic volume and you’ll be able to see when they were last accessed:You can use the same range selectors as with the Dashboard view to modify how you see the data. However, granularity and tag views will not work since they do not apply to a tabulated view.If you select an API name, you will be taken to the drill-down view for that specific API, here you will have a similar Dashboard as you do with the aggregate API Dashboard that you first visit on log in, but the whole view will be constrained to just the single API in question:You will also see an error breakdown and the endpoint popularity stats for the API:Tyk will try to normalize endpoint metrics by identifying IDs and UUIDs in a URL string and replacing them with normalized tags, this can help make your analytics more useful. It is possible to configure custom tags in the configuration file of your Tyk Self-Managed or Multi-Cloud installation.
From Tyk v5.1 (and LTS patches v4.0.14 and v5.0.3) the Error Breakdown and Endpoint Popularity charts will not be visible to a user if they are assigned the Owned Analytics permission.
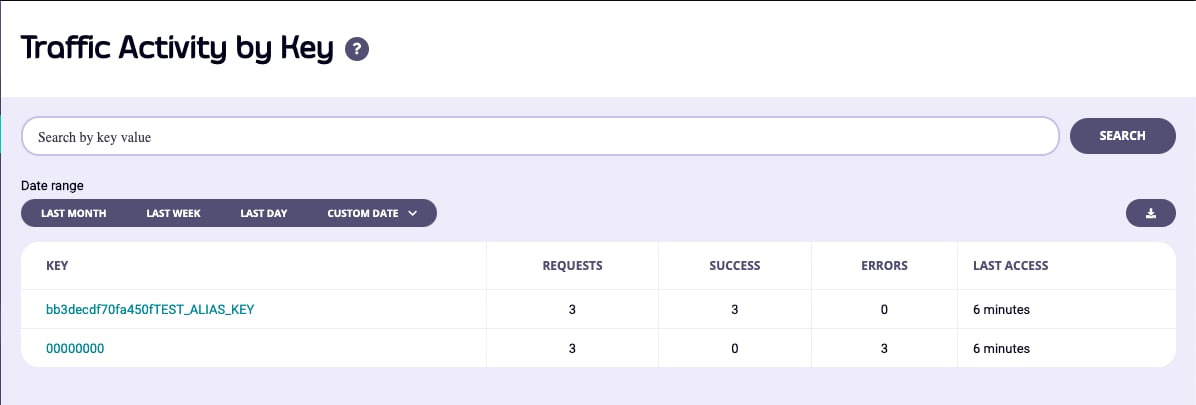
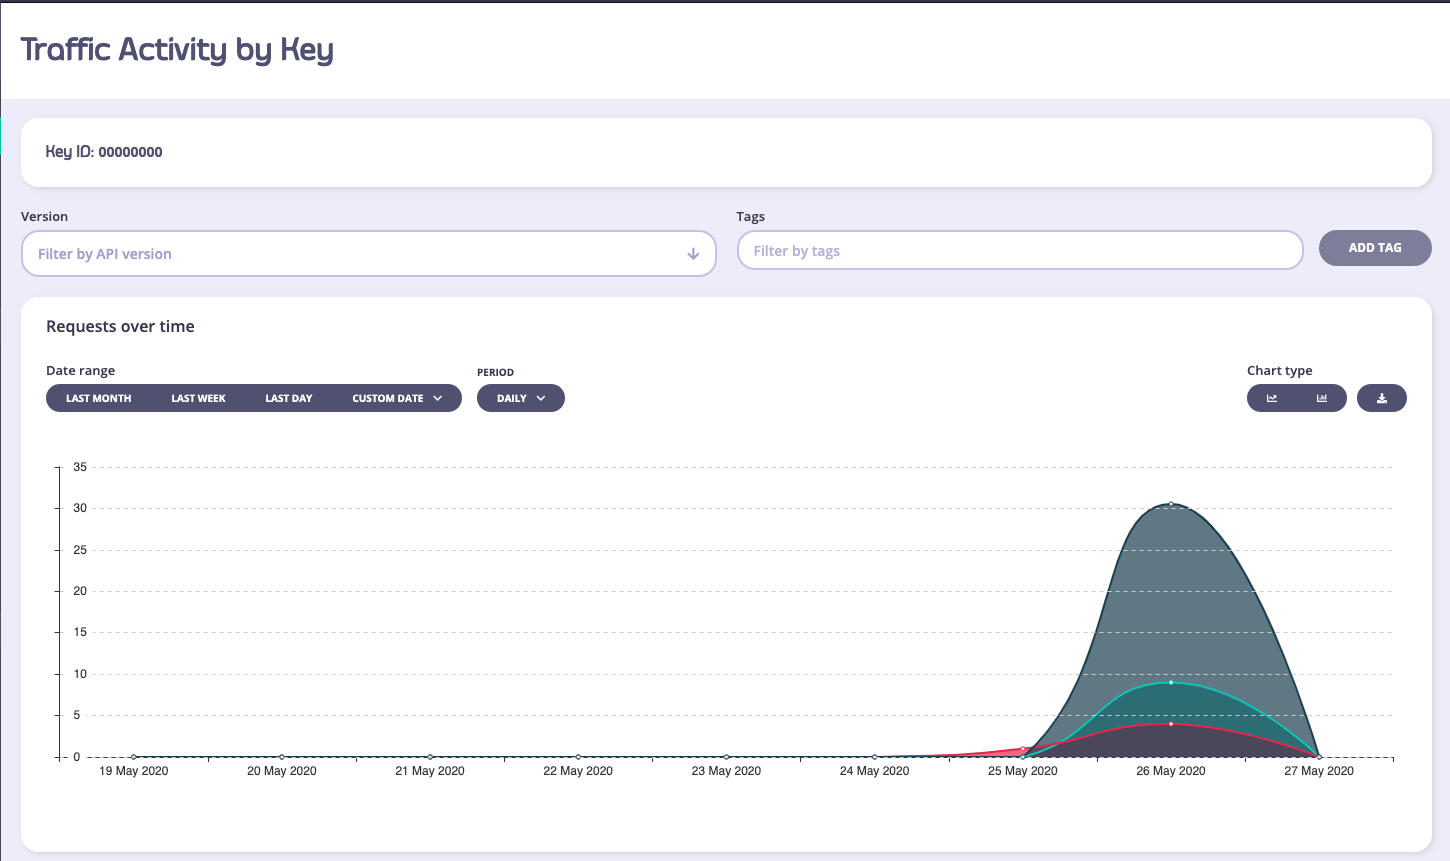
You will often want to see what individual keys are up to in Tyk, and you can do this with the Activity per Key section of your analytics Dashboard. This view will show a tabular layout of all keys that Tyk has seen in the range period and provide analytics for them:You’ll notice in the screenshot above that the keys look completely different to the ones you can generate in the key designer (or via the API), this is because, by default, Tyk will hash all keys once they are created in order for them to not be snooped should your key-store be breached.This poses a problem though, and that is that the keys also no longer have any meaning as analytics entries. You’ll notice in the screenshot above, one of the keys is appended by the text TEST_ALIAS_KEY. This is what we call an Alias, and you can add an alias to any key you generate and that information will be transposed into your analytics to make the information more human-readable.The key 00000000 is an empty token, or an open-request. If you have an API that is open, or a request generates an error before we can identify the API key, then it will be automatically assigned this nil value.If you select a key, you can get a drill down view of the activity of that key, and the errors and codes that the token has generated:(The filters in this view will not be of any use except to filter by API Version).
From Tyk v5.1 (and LTS patches v4.0.14 and v5.0.3) the Traffic per Key screen will not be visible to a user if they are assigned the Owned Analytics permission.
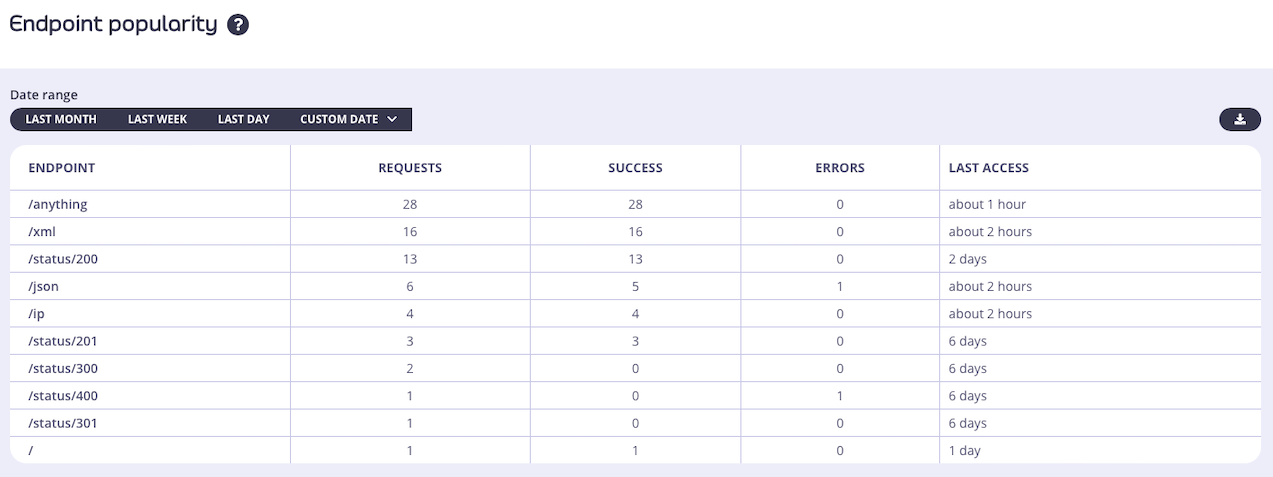
To get a tabular view of how your API traffic is performing at the endpoint level, you can select the Activity by Endpoint option in the navigation and see a tabular view of your API endpoints. This table will list your API endpoints by their traffic volume and you’ll be able to see when they were last accessed:
Controlling which endpoints appear in the analytics data
The aggregate pumps have an option to track_all_paths which will ensure that all analytics records generated by the Tyk Gateway will be included in the aggregated statistics on the Endpoint Popularity screen. Set this to true to capture all endpoints in the aggregated data and subsequently on the Dashboard page.You can alternatively select only a subset of the endpoints to include in the aggregated data by setting track_all_paths to false and identifying specific endpoints to be “tracked”. These are identified by the TrackPathflag being set to true in the record. In this configuration, the Pump will only include transaction records from “tracked” endpoints in the aggregated data.Tyk Gateway will set TrackPath to true in transaction records generated for endpoints that have the track endpoint middleware enabled.
The track endpoint middleware only affects the inclusion of endpoints in the per-endpoint aggregates, it does not have any impact on other aggregated data nor the per-request data.
The design of the Tyk OAS API Definition takes advantage of the operationId defined in the OpenAPI Document that declares both the path and method for which the middleware should be added. The path can contain wildcards in the form of any string bracketed by curly braces, for example {user_id}. These wildcards are so they are human readable and do not translate to variable names. Under the hood, a wildcard translates to the “match everything” regex of: (.*).The track endpoint middleware (trackEndpoint) can be added to the operations section of the Tyk OAS Extension (x-tyk-api-gateway) in your Tyk OAS API Definition for the appropriate operationId (as configured in the paths section of your OpenAPI Document).The trackEndpoint object has the following configuration:
In this example the track endpoint middleware has been configured for requests to the GET /anything endpoint. These requests will appear in the Endpoint Popularity analytics screen, located within the API Usage section of Tyk Dashboard.The configuration above is a complete and valid Tyk OAS API Definition that you can import into Tyk to try out the track endpoint middleware.
Configuring the middleware in the API Designer
Adding the track endpoint middleware to your API endpoints is easy when using the API Designer in the Tyk Dashboard, simply follow these steps:
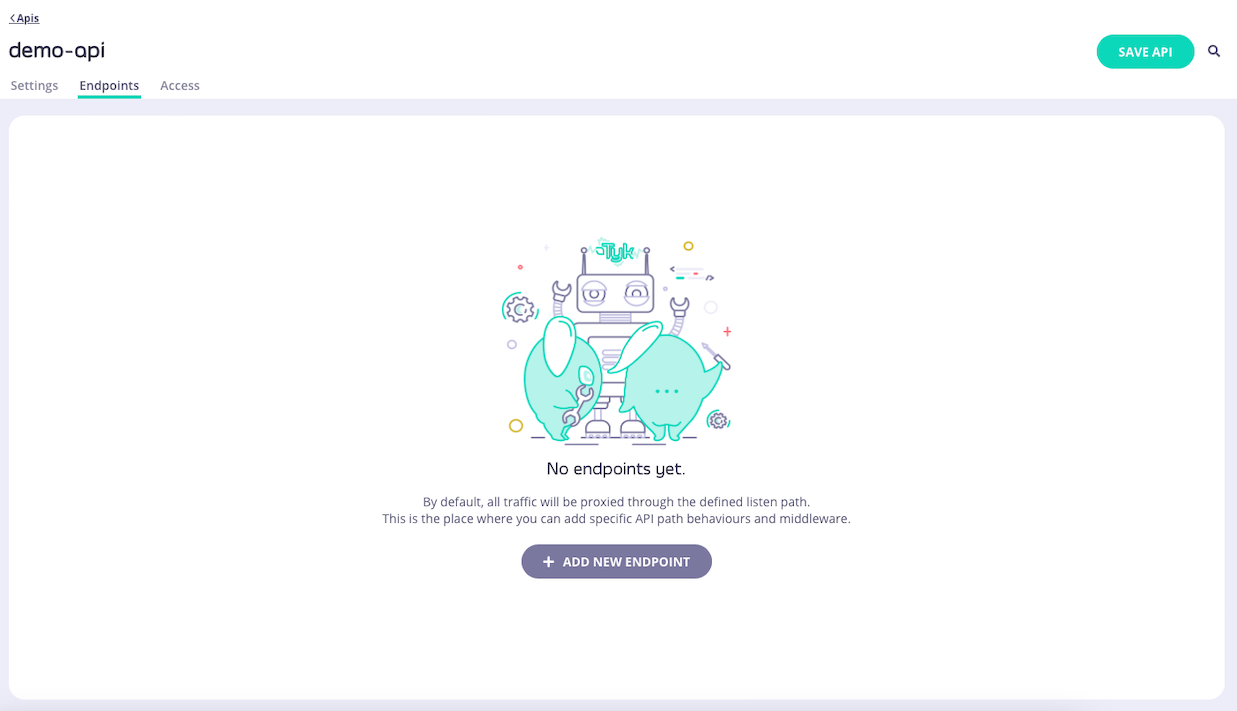
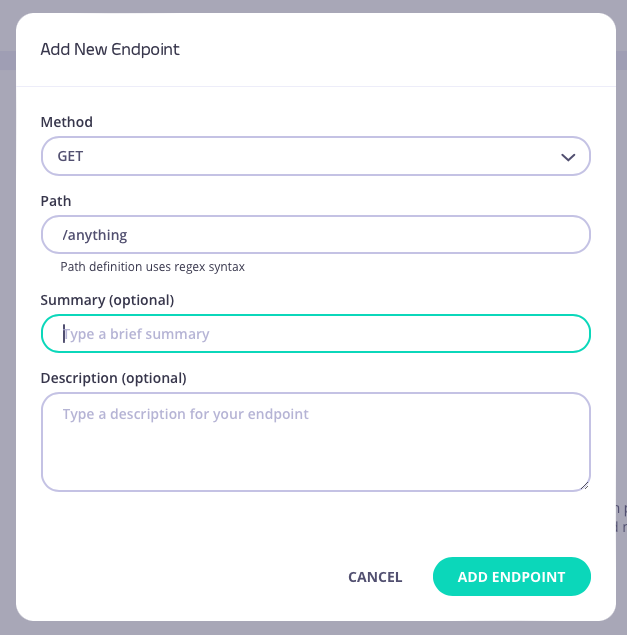
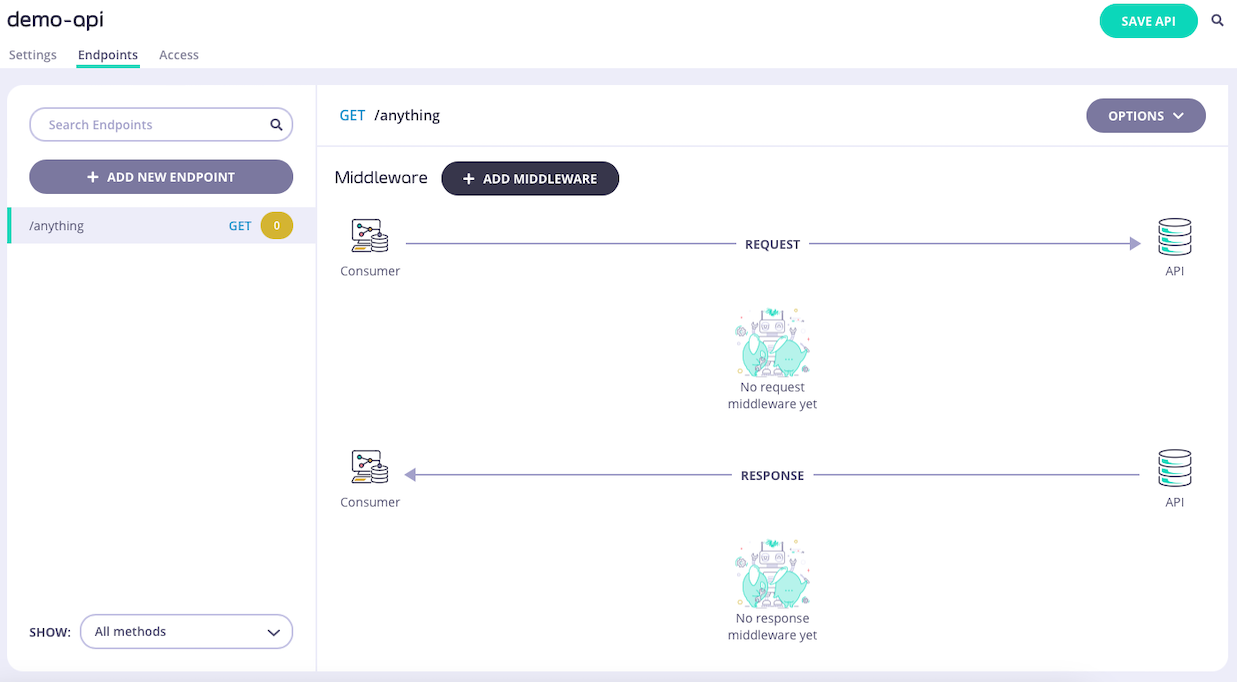
Add an endpointFrom the API Designer add an endpoint that matches the path and method to which you want to apply the middleware.
Select the Track Endpoint middlewareSelect ADD MIDDLEWARE and choose the Track Endpoint middleware from the Add Middleware screen.
Save the APISelect SAVE API to apply the changes to your API.
If you are working with Tyk Classic APIs then you must add a new track_endpoints object to the extended_paths section of your API definition.The track_endpoints object has the following configuration:
In this example the track endpoint middleware has been configured for HTTP GET requests to the /anything endpoint. These requests will appear in the Endpoint Popularity analytics screen, located within the API Usage section of Tyk Dashboard.
Configuring the middleware in the API Designer
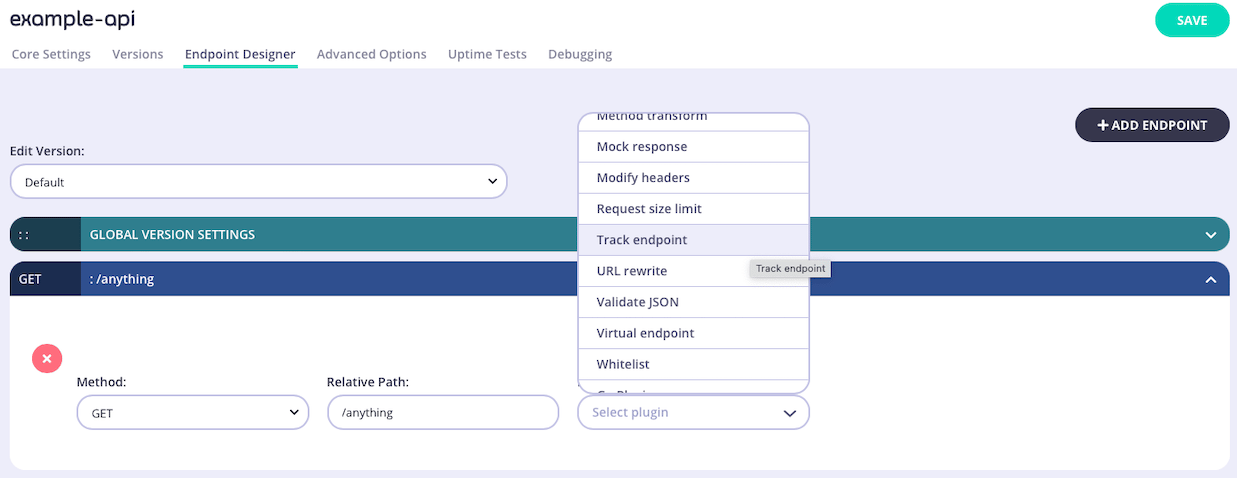
You can use the API Designer in the Tyk Dashboard to configure the track endpoint middleware for your Tyk Classic API by following these steps.
Add an endpoint for the path and select the pluginFrom the Endpoint Designer add an endpoint that matches the path for which you want to allow access. Select the Track endpoint plugin.
Save the APIUse the save or create buttons to save the changes and activate the middleware for the selected endpoint.
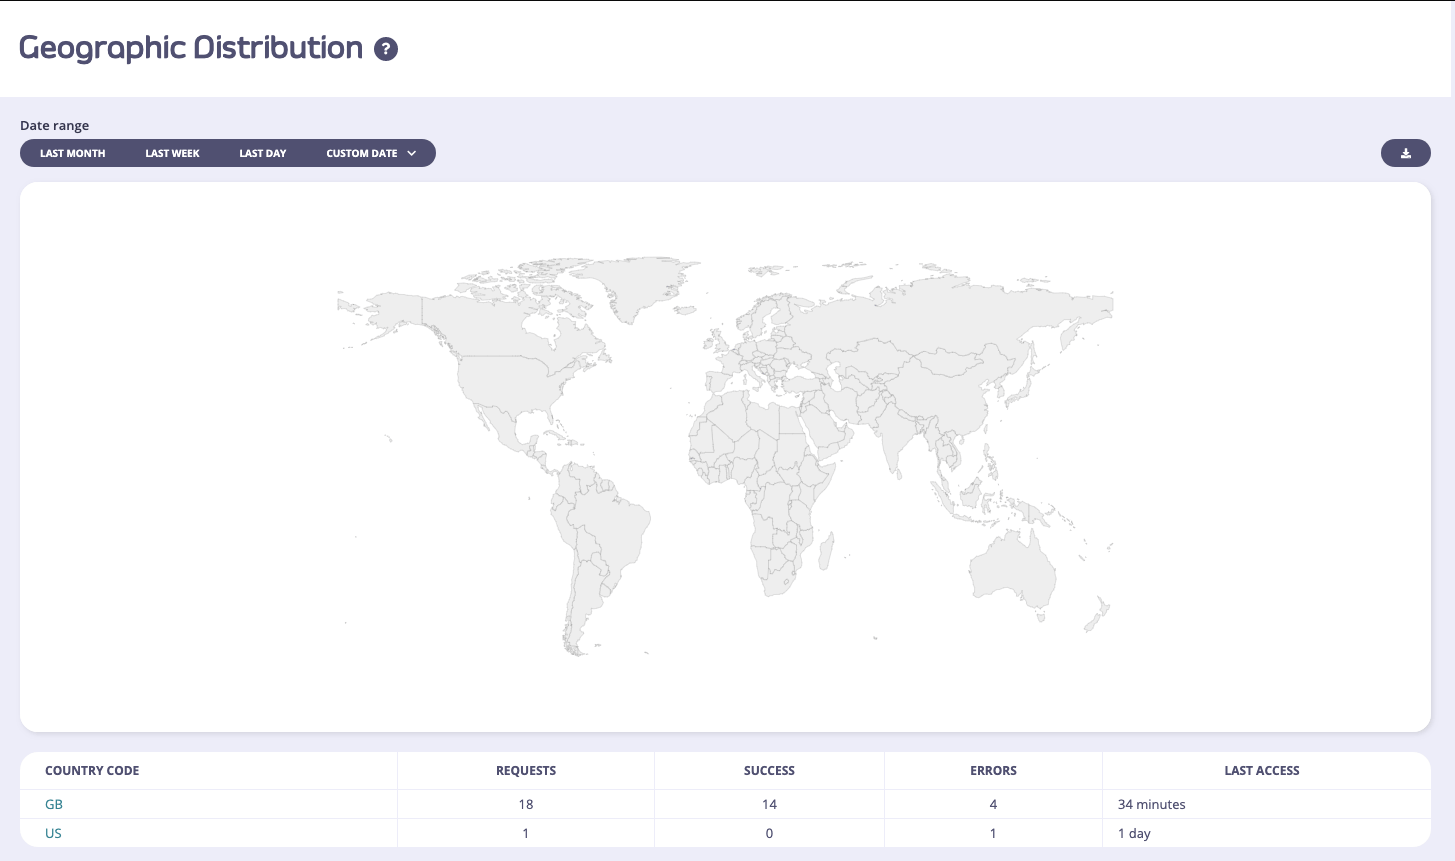
Tyk will attempt to record GeoIP based information based on your inbound traffic. This requires a MaxMind IP database to be available to Tyk and is limited to the accuracy of that database.You can view the overview of what the traffic breakdown looks like per country, and then drill down into the per-country traffic view by selecting a country code from the list:
From Tyk v5.1 (and LTS patches v4.0.14 and v5.0.3) the Geographic Distribution screen will not be visible to a user if they are assigned the Owned Analytics permission.
MaxMind SettingsTo use a MaxMind database, see MaxMind Database Settings in the Tyk Gateway Configuration Options.
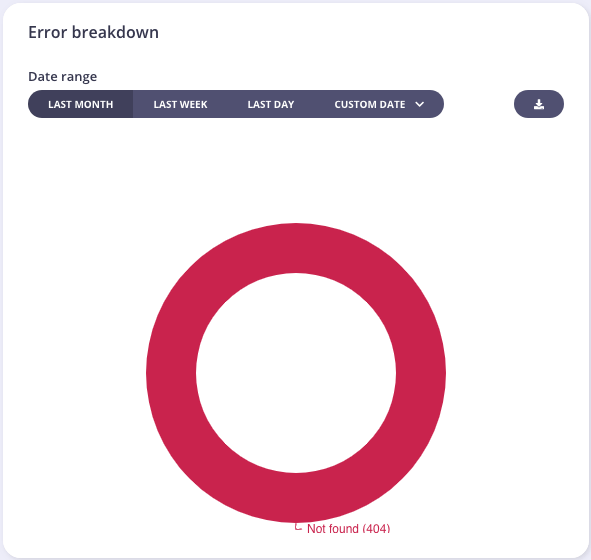
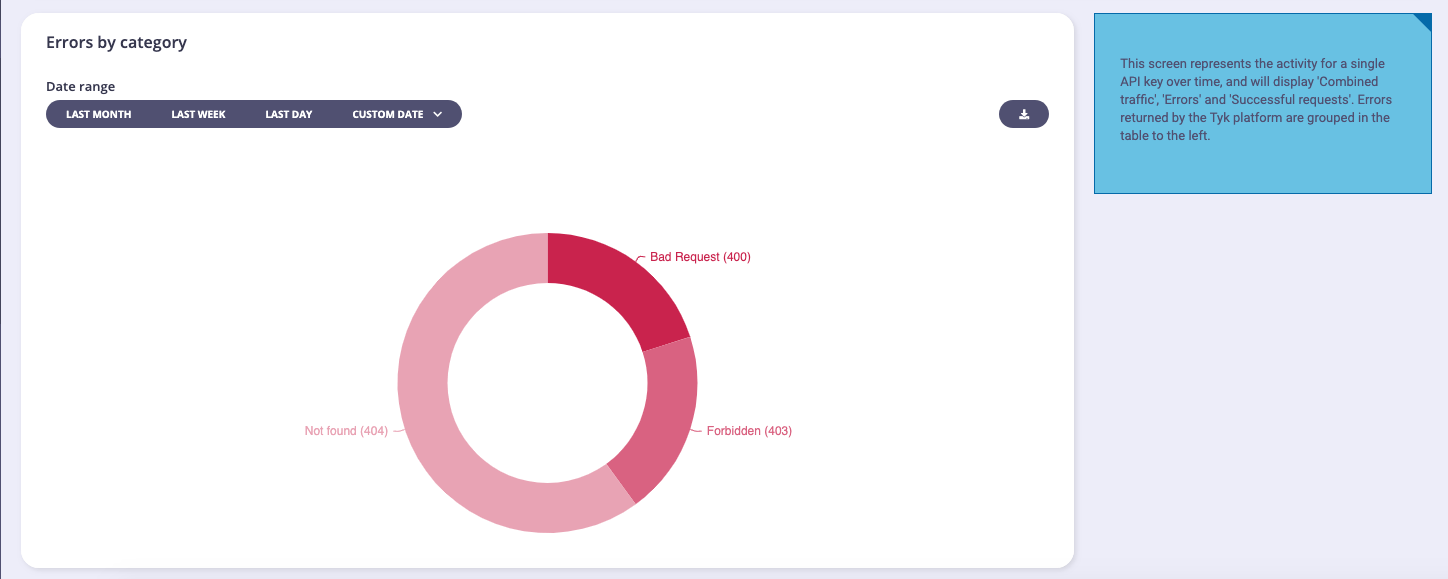
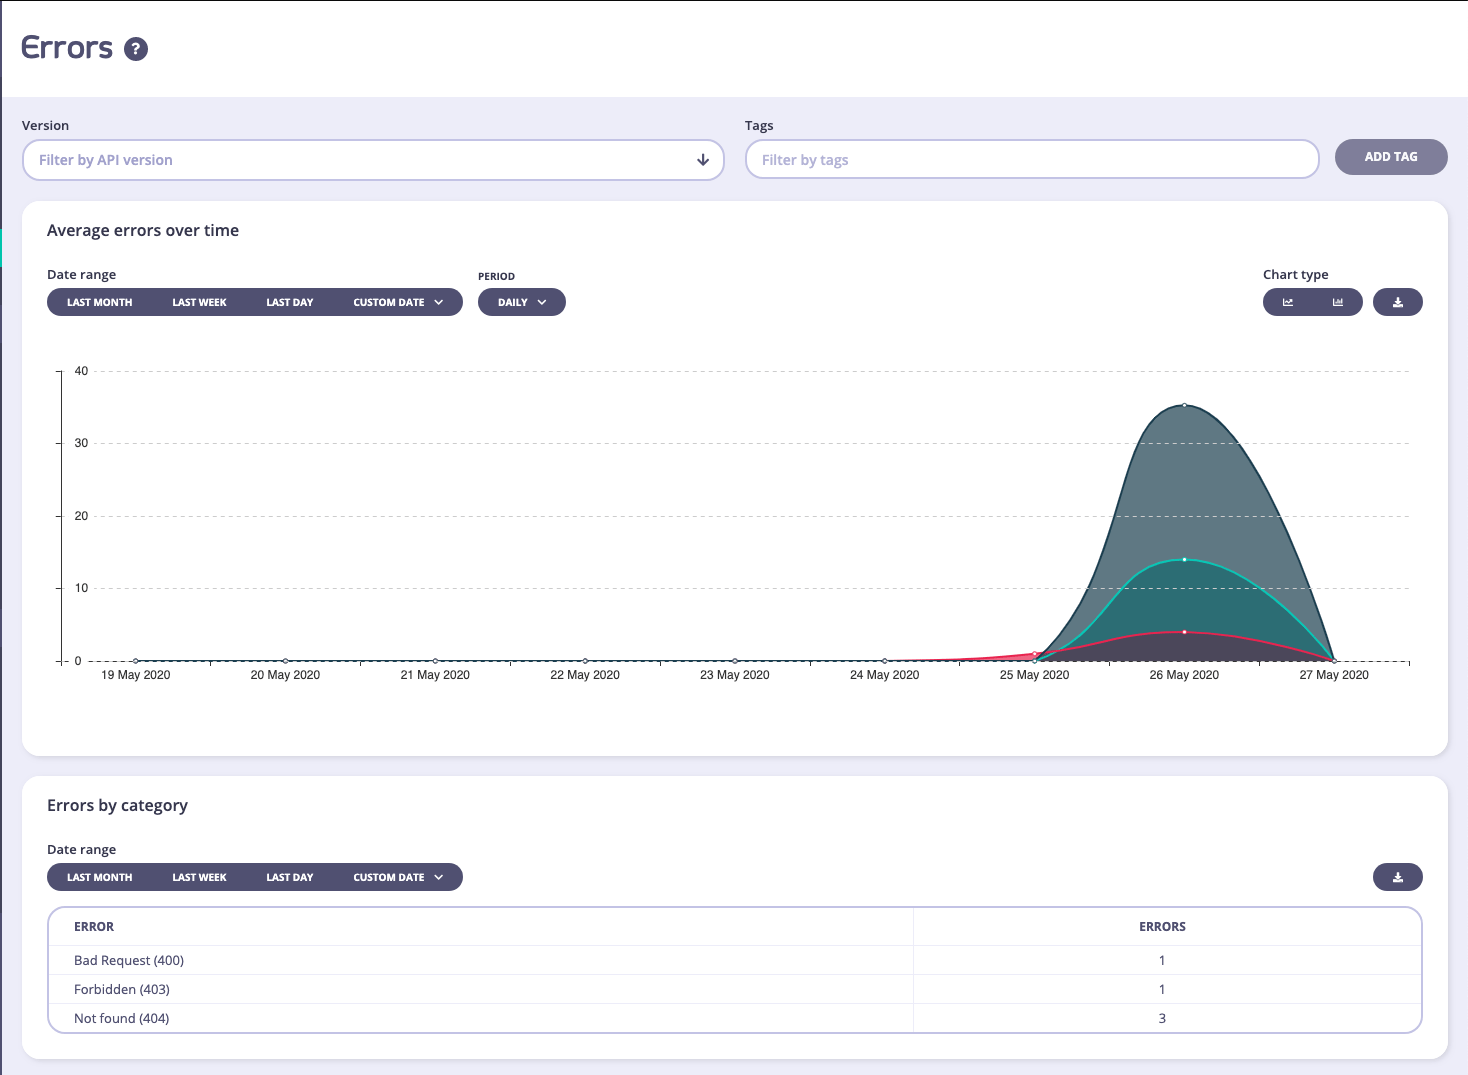
The error overview page limits the analytics down to errors only, and gives you a detailed look over the range of the number of errors that your APIs have generated. This view is very similar to the Dashboard, but will provide more detail on the error types:
From Tyk v5.1 (and LTS patches v4.0.14 and v5.0.3) the Errors by Category data will not be visible to a user if they are assigned the Owned Analytics permission.
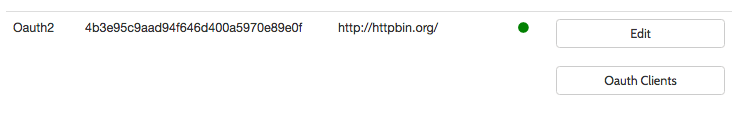
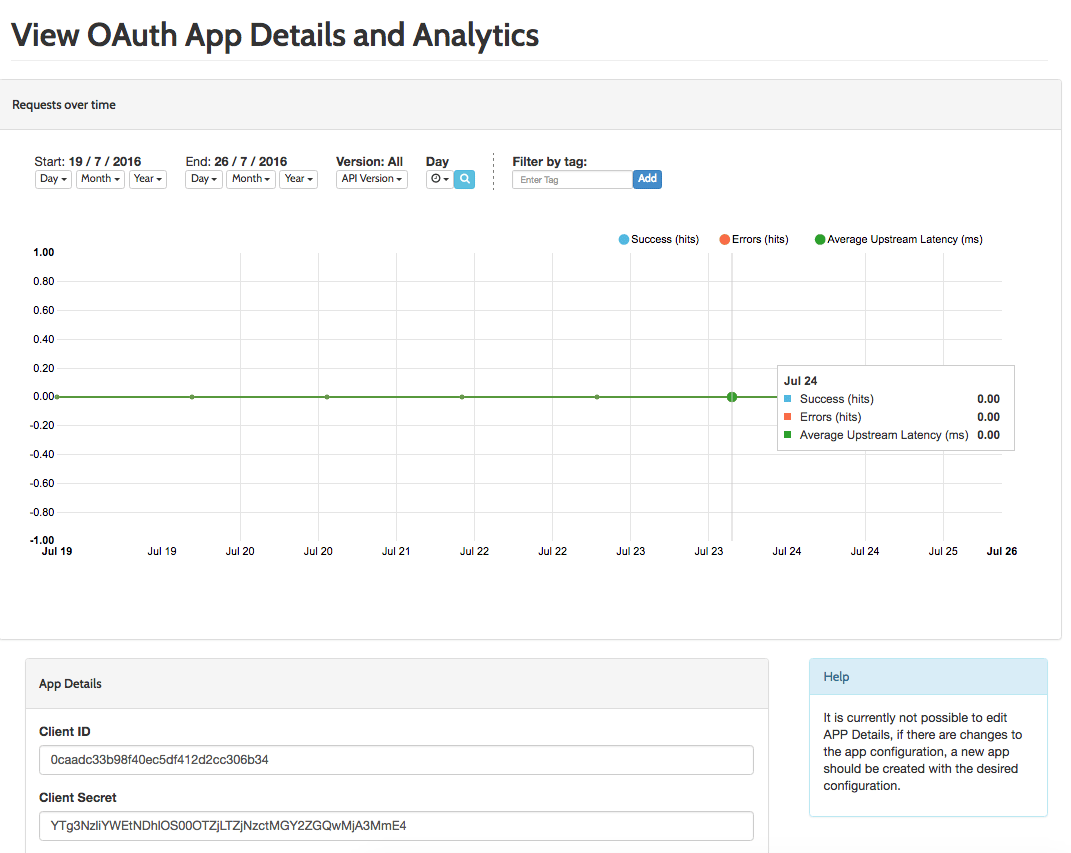
Traffic statistics are available on a per OAuth Client ID basis if you are using the OAuth mode for one of your APIs. To get a breakdown view of traffic aggregated to a Client ID, you will need to go to the System Management -> APIs section and then under the OAuth API, there will be a button called OAuth API. Selecting an OAuth client will then show its aggregate activityIn the API list view – an OAuth Clients button will appear for OAuth enabled APIs, use this to browse to the Client ID and the associated analytics for that client ID:You can view the analytics of individual tokens generated by this Client ID in the regular token view.
From Tyk v5.1 (and LTS patches v4.0.14 and v5.0.3) the Traffic per OAuth Client ID charts will not be visible to a user if they are assigned the Owned Analytics permission.
API categorization is a governance feature provided within the Tyk Dashboard that helps you to manage a portfolio of APIs. You can filter the list of APIs visible in the Dashboard UI or to be returned by the Dashboard API by category. You can assign an API to any number of categories and any number of APIs to a category. All category names are entirely user defined.
As a platform manager looking after a large portfolio of APIs, if I need to make changes to a sub-set of APIs, it’s cumbersome having to identify which APIs they are and then to find them one-by-one in the list. If I have assigned categories to my APIs then I can filter quickly and easily to work with that sub-set. What’s really powerful is that an API can appear in as many different categories as I like.
Multi-tenant deployments with role-based access control enabled allows an admin user to give different users or groups access to a sub-set of the entire API portfolio. Categories can be aligned with the API ownership rules that you have deployed to allow filtering the list of APIs for those visible to each separate user group/team.
API categories with Tyk are a very simple concept - you can define any string as a category and then tag the relevant APIs with that string.Categories might refer to the API’s general focus (e.g. ‘weather’ or ‘share prices’); they might relate to geographic location (e.g. ‘APAC’ or ‘EMEA’); they might refer to technical markers (e.g. ‘dev’, ‘test’); or anything else you might need. It’s completely up to you.Categories can be defined, added to and removed from APIs without limitation.
When a Tyk OAS API is assigned to a category, the category name (string) is appended to a list in the database object where the API definition is stored by Tyk Dashboard. No change is made to the API definition itself.
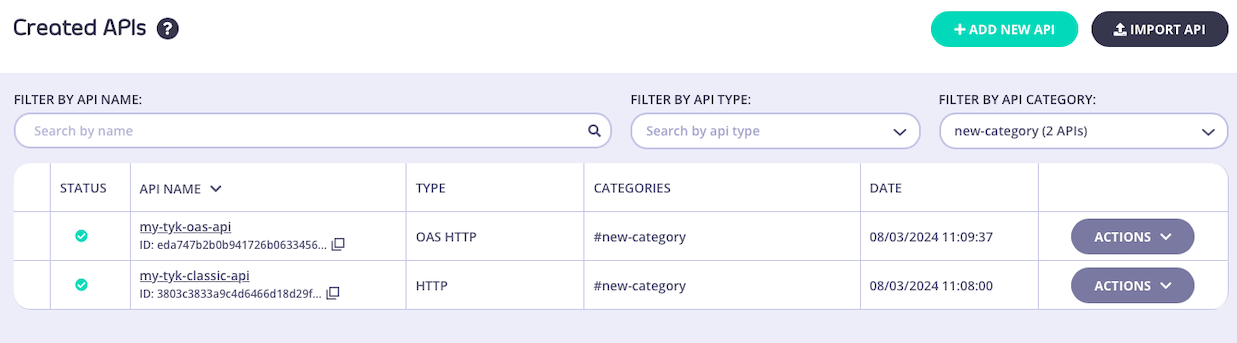
When a Tyk Classic API is assigned to a category, the category name (string) is appended to the name field in the API definition using a # qualifier. For example, let’s say you have an API with this (partial) API definition:
{ "name": "my-classic-api"}
You can add it to the global and staging categories by updating the API definition to:
{ "name": "my-classic-api #global #staging"}
When a Tyk Classic API is migrated from one environment to another using Tyk Sync, it will retain any category labels that it has been assigned.
The use of the # qualifier to identify a category prevents the use of # in your API names; this is not an issue when working with Tyk OAS APIs.
The API Designer in the Tyk Dashboard UI provides a simple method for assigning APIs to categories, removing categories and filtering the API list by category.
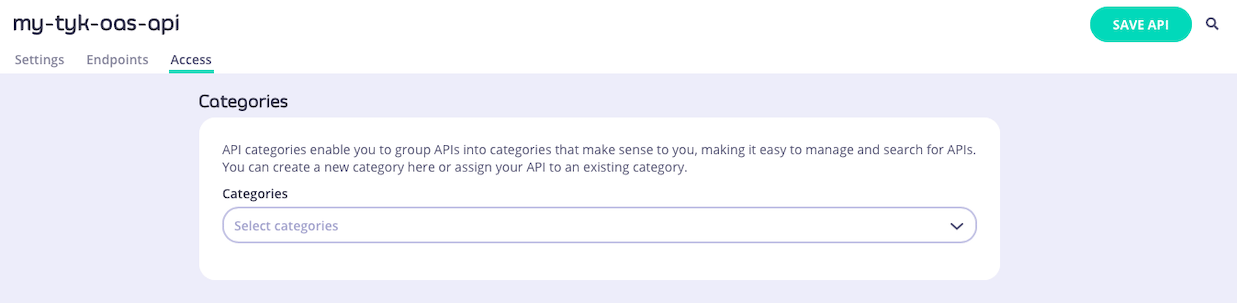
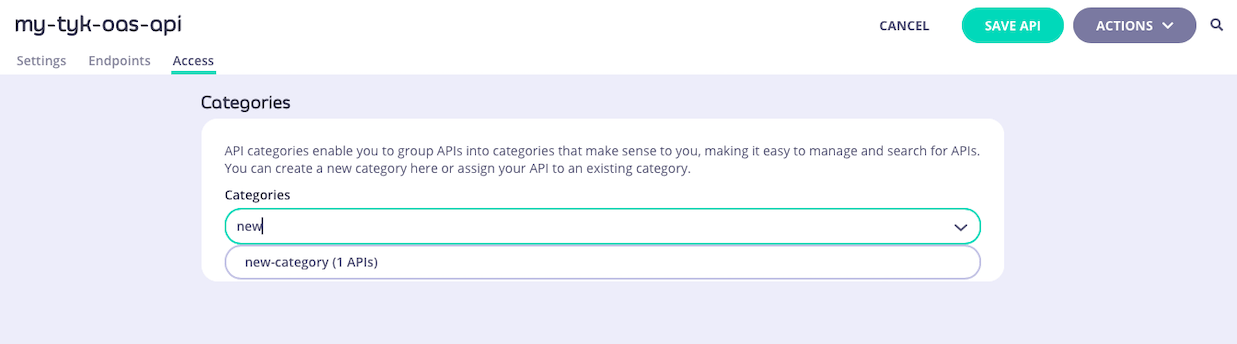
Managing categories with Tyk OAS APIs
When working with Tyk OAS APIs, the API Designer has a separate Access tab where you can configure the categories to which the API is assigned.You can choose existing categories from the drop-down or define new categories simply by typing in the box. You can also remove the API from a category by clicking on the x or deleting the category from the box.
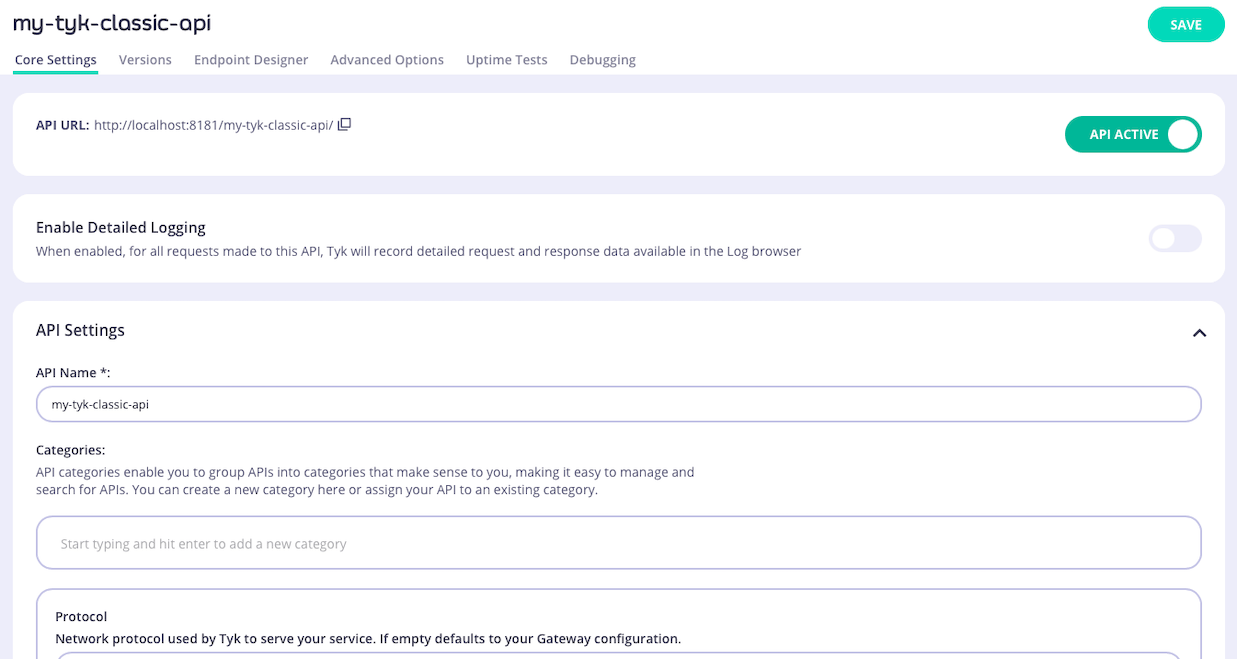
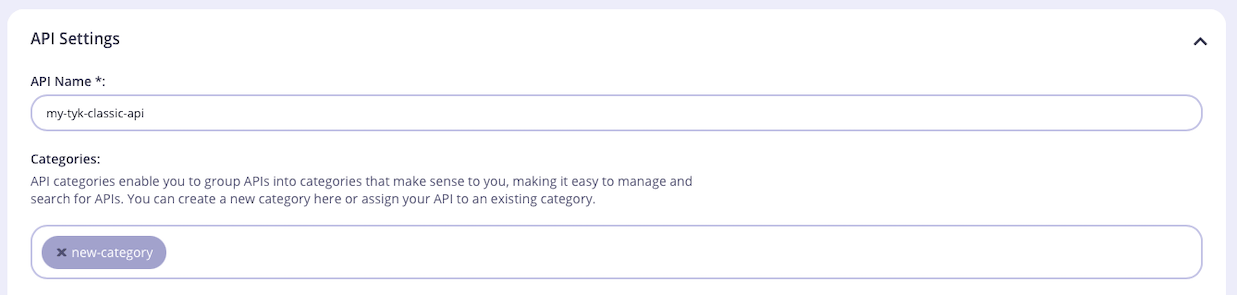
Managing categories with Tyk Classic APIs
When working with Tyk Classic APIs, the API Designer has a box in the API Settings section where you can configure the categories to which the API is assigned.You can choose existing categories from the list that appears when you click in the box or you can define new categories simply by typing in the box. You can also remove the API from a category by clicking on the x or deleting the category from the box.
Filtering the API list
When you have APIs assigned to categories, you can choose to view only the APIs in a specific category by using the FILTER BY API CATEGORY drop-down on the Created APIs screen.
The Tyk Dashboard API provides endpoints to manage categories directly, if you are not using the API Designer.When working with Tyk OAS APIs, you can manage categories for an API using these endpoints:
Method
Endpoint path
Action
PUT
/api/apis/oas/{apiID}/categories
Assign a list of categories to the specified API
GET
/api/apis/oas/{apiID}/categories
Retrieve the list of categories assigned to the specified API
When working with Tyk Classic APIs, you manage categories for an API by modifying the name field in the API definition and then updating the API in Tyk with that using these endpoints:
Method
Endpoint
Action
PUT
/api/apis/{apiID}
Update the API definition for the specified API - CRUD category tags in the name field
GET
/api/apis/{apiID}
Retrieve the API definition for the specified API - category tags in name field
These endpoints will return information for categories across all APIs in the system (both Tyk OAS and Tyk Classic):
Method
Endpoint path
Action
GET
/api/apis/categories
Retrieve a list of all categories defined in the system and the number of APIs in each
GET
/api/apis?category={category_name}
Retrieve a list of all APIs assigned to the specified category
You can manage categories using Tyk Operator custom resources. Please refer to Tyk Operator documentation to see how to manage API categories for Tyk OAS APIs and Tyk Classic APIs.
API Templates are an API governance feature provided to streamline the process of creating Tyk OAS APIs. An API template is an asset managed by Tyk Dashboard that is used as the starting point - a blueprint - from which you can create a new Tyk OAS API definition.The default template is a blank API definition; your custom templates will contain some configuration, for example cache configuration or default endpoints with pre-configured middleware. When you create a new API using a custom template, whether importing an OpenAPI document or building the API from scratch in the Tyk API Designer, those elements of the API configuration included in the template will be pre-configured for you.
API Templates are exclusive to Tyk OAS APIs and can be managed via the Tyk Dashboard API or within the Tyk Dashboard UI.
When working with OpenAPI described upstream service APIs, your service developers do not need to learn about Tyk. You can create and maintain a suitable suite of templates that contain the Tyk-specific configuration (x-tyk-api-gateway) that you require for your externally published API portfolio. Creating an API on Tyk is as simple as importing the OpenAPI document and selecting the correct template. Tyk will combine the OpenAPI description with the template to produce a valid Tyk OAS API.
If you have specific requirements for your external facing APIs - for example authentication, caching or even a healthcheck endpoint - you can define the appropriate API templates so that when APIs are created on Tyk these fields are automatically and correctly configured.
An API template is a blueprint from which you can build new APIs - it is an incomplete JSON representation of a Tyk OAS API definition that you can use as the starting point when creating a new API on Tyk. There is no limit to how much or how little of the API definition is pre-configured in the template (such that when you choose to create a new API without choosing a template, the blank API definition that you start from is itself a template).Templates are used only during the creation of an API, they cannot be applied later. Before you can use a template as the basis for an API, you must register the template with Tyk Dashboard.
When you use a template during the creation of an API, the fields configured in data will be pre-set in your new API. You are able to modify these during and after creation of the template. No link is created between the API and the template, so changes made to the API will not impact the template.
Merging with an OpenAPI description or Tyk OAS API definition
When you use a template during the creation of an API where you import the OpenAPI document or a full Tyk OAS API definition, the template is combined with the imported OAS description. If the x-tyk-api-gateway extension exists in the template, it will be applied to the newly created API.Where there are clashes between configuration in the OpenAPI description and the template:
for maps, such as paths and components, new keys will be added alongside any existing ones from the template
if a key in the OpenAPI description matches one in the template, the OpenAPI description takes precedence
for array properties, such as servers and tags, values in the OpenAPI description will replace those in the template
If you’re using the API Designer in the Tyk Dashboard UI, then you can find details and examples of how to work with API templates here.If you’re using the Tyk Dashboard API, then you can find details and examples of how to work with API templates here.
Working with API Templates using the Template Designer
API Templates are an API governance feature provided to streamline the process of creating Tyk OAS APIs. An API template is an asset managed by Tyk Dashboard that is used as the starting point - a blueprint - from which you can create a new Tyk OAS API definition.The Tyk Dashboard UI provides the following functionality to support working with API templates:
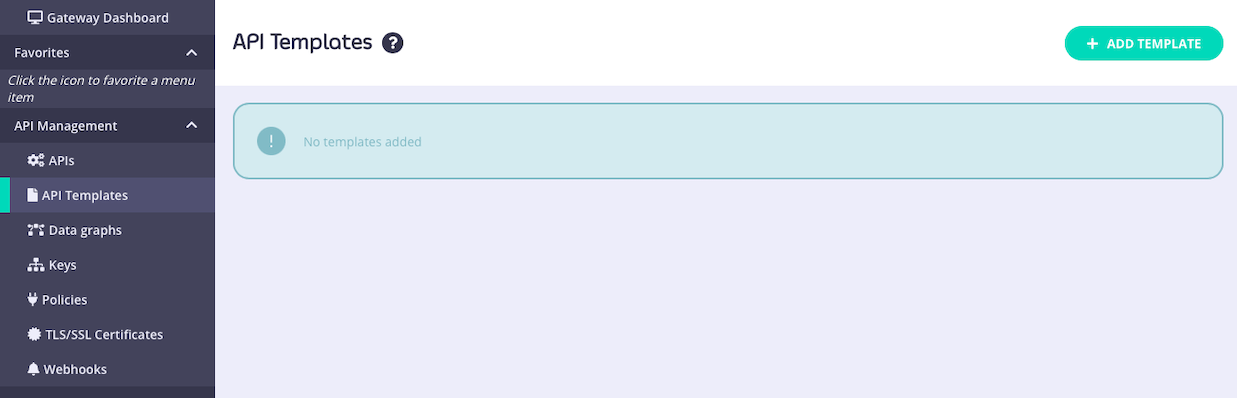
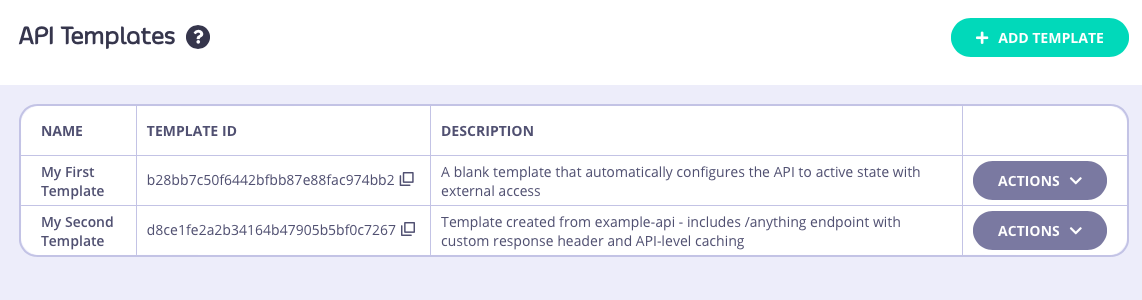
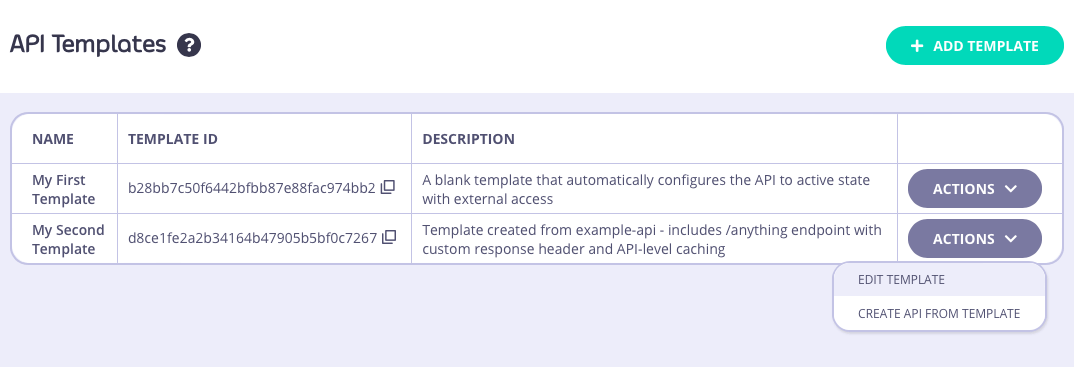
API Templates can be found in the API Templates section of the API Management menu in the Tyk Dashboard. This screen lists all the templates currently registered with Tyk and displays their names and short descriptions. It also gives access to options to create and manage templates.
API templates can be created starting from a blank template or from an existing API
Creating a new API template
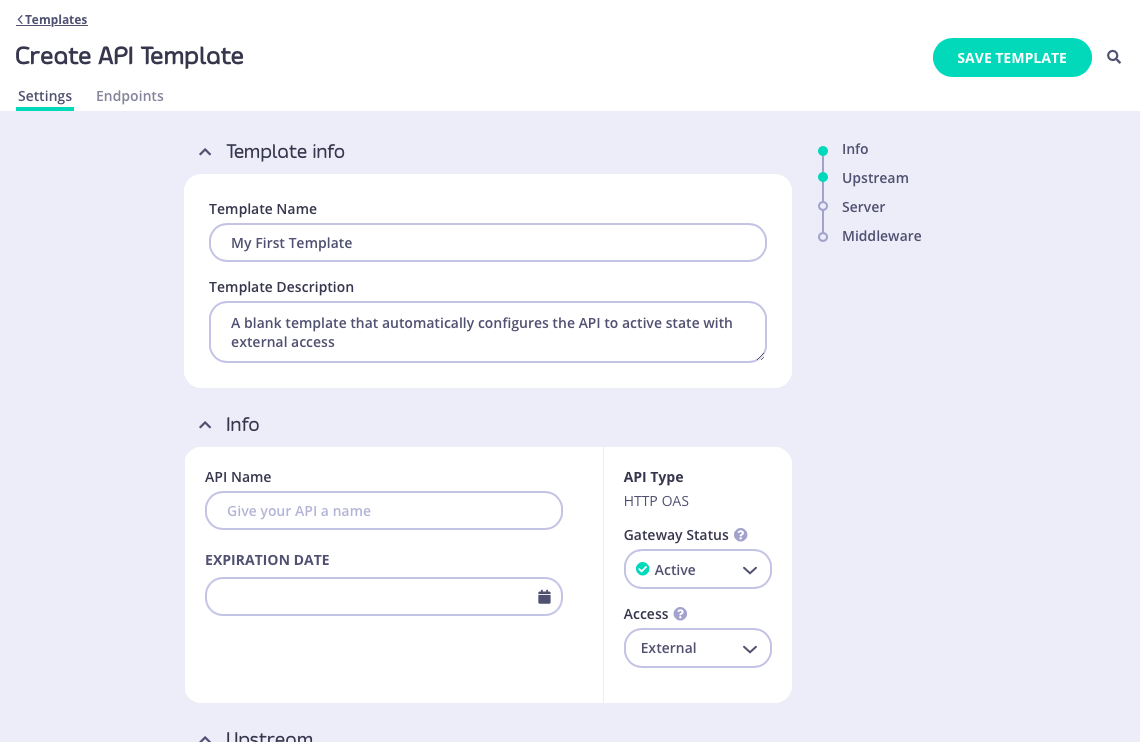
To create a template, simply visit the API Templates section of the Tyk Dashboard and select ADD TEMPLATE.This will take you to the Create API Template screen, where you can configure all aspects of the template.The template does not need to be a complete or valid API definition however as a minimum:
you must give the template a Name
you must give the template a Description
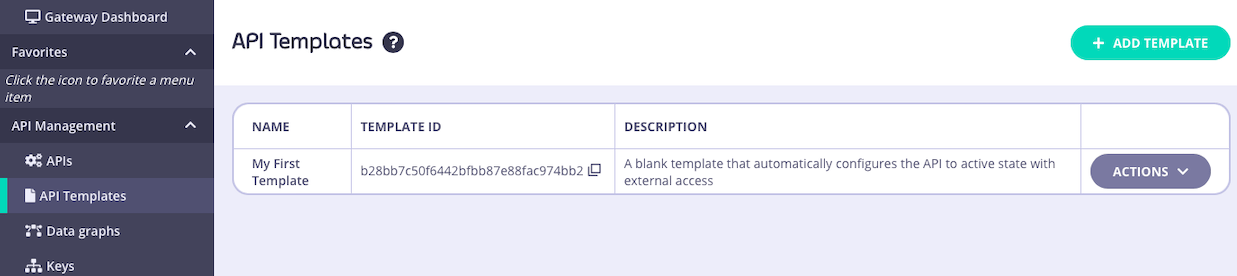
In this example, we have configured just the Name, Description, Gateway Status and Access settings:When you have configured all of the API-level and endpoint-level settings you require, select SAVE TEMPLATE to create and register the template with Tyk.Returning to the API Template screen you will see your new template has been added to the list and assigned a unique id that can be used to access the template from the Tyk Dashboard API:
Creating a template from an existing API
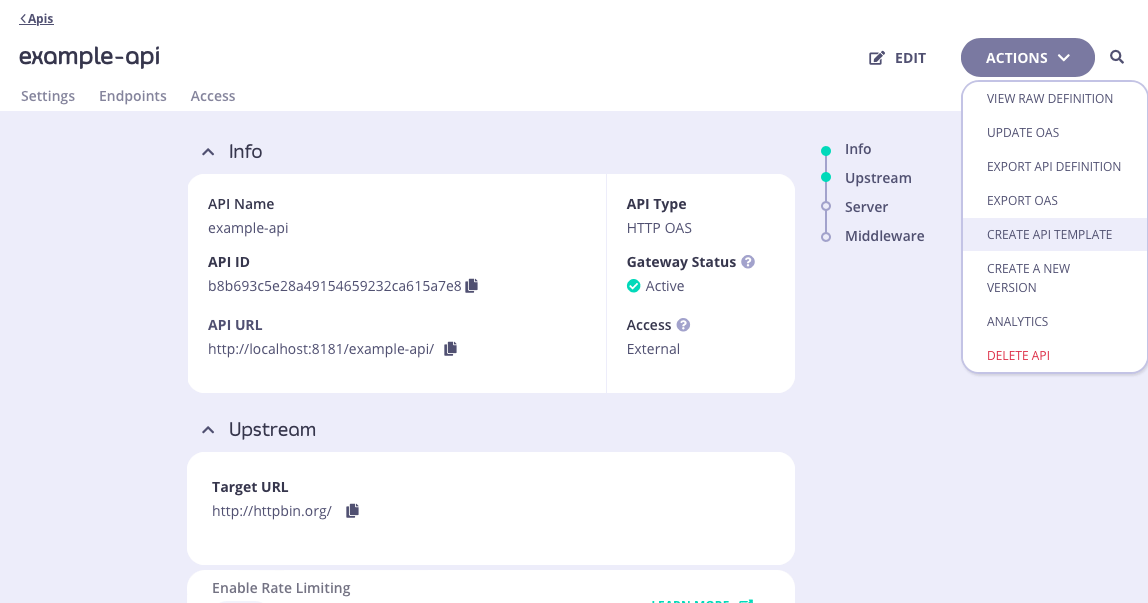
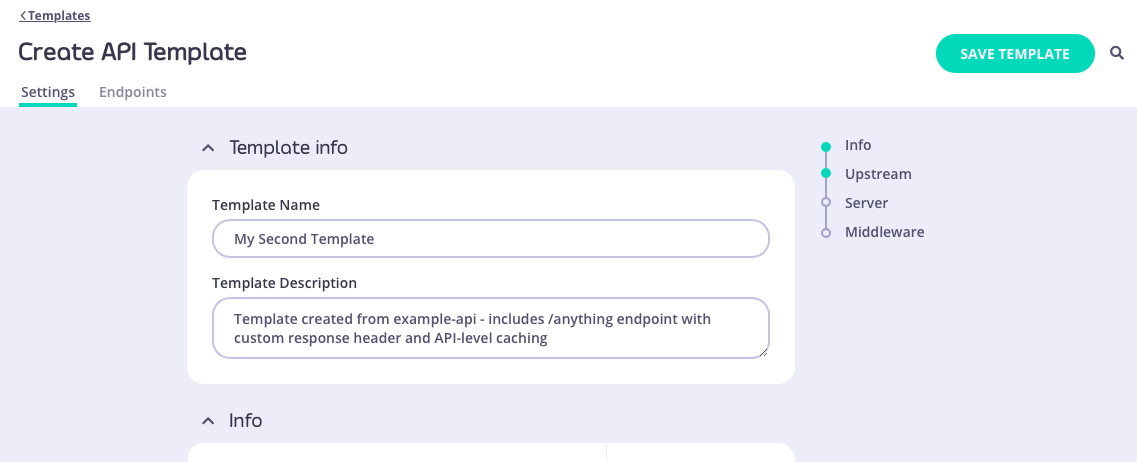
You can use an existing API deployed on Tyk as the basis for a new API template - this is a great way to build up a portfolio of standardized APIs once you’ve got your first one correctly configured.From the Created APIs screen within the APIs section of the Tyk Dashboard, select the API that you wish to use as your starting point. In the ACTIONS drop-down select the CREATE API TEMPLATE option.This will take you to the Create API Template screen, where you can configure all aspects of the template.The template does not need to be a complete or valid API definition however as a minimum:
you must give the template a Name
you must give the template a Description
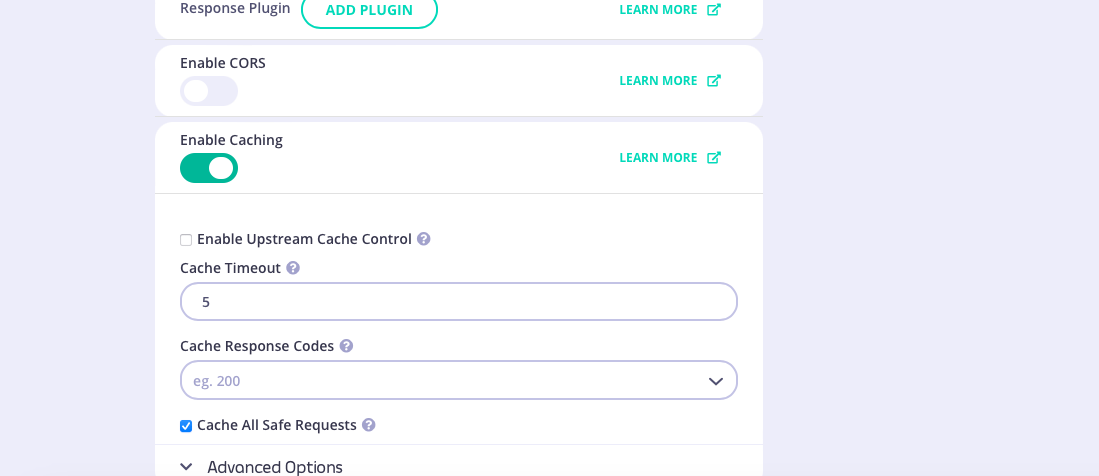
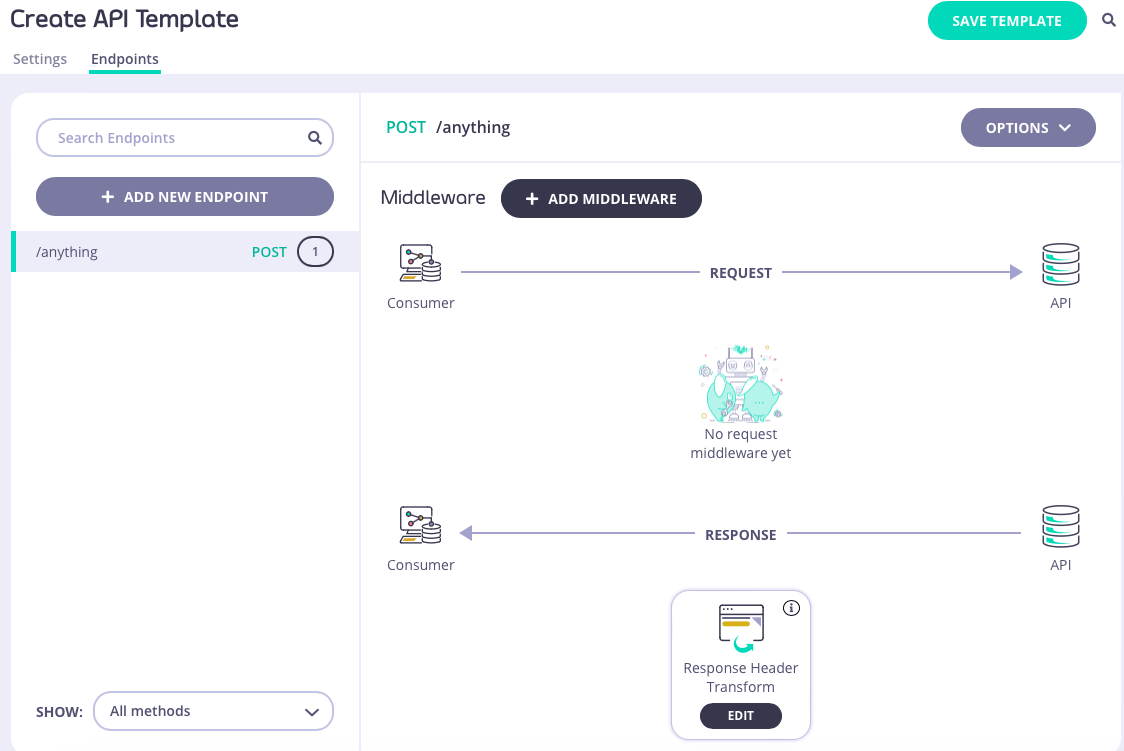
In this example, we have configured the Name and Description. The base API included response header transformation middleware on the /anything endpoint and API-level cache configuration, all of which will be configured within the template.When you have configured all of the API-level and endpoint-level settings you require, select SAVE TEMPLATE to create and register the template with Tyk.Returning to the API Template screen you will see your new template has been added to the list and assigned a unique id that can be used to access the template from the Tyk Dashboard API.
API templates are used as the starting point during the creation of a new API. They can be applied in all of the methods supported by Tyk for creating new APIs.
Using a template when creating a new API
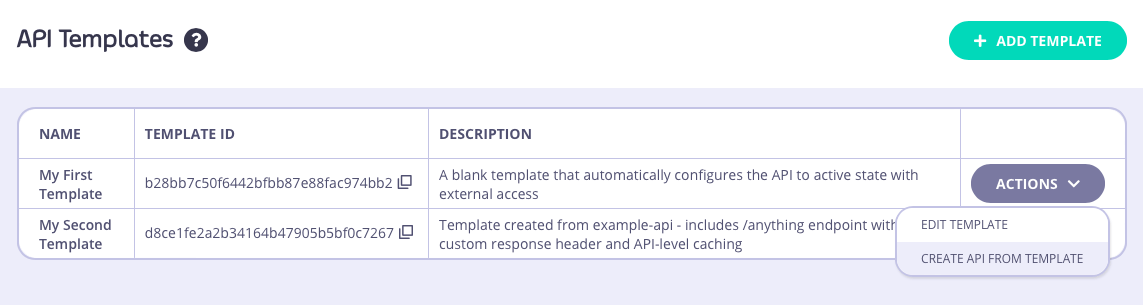
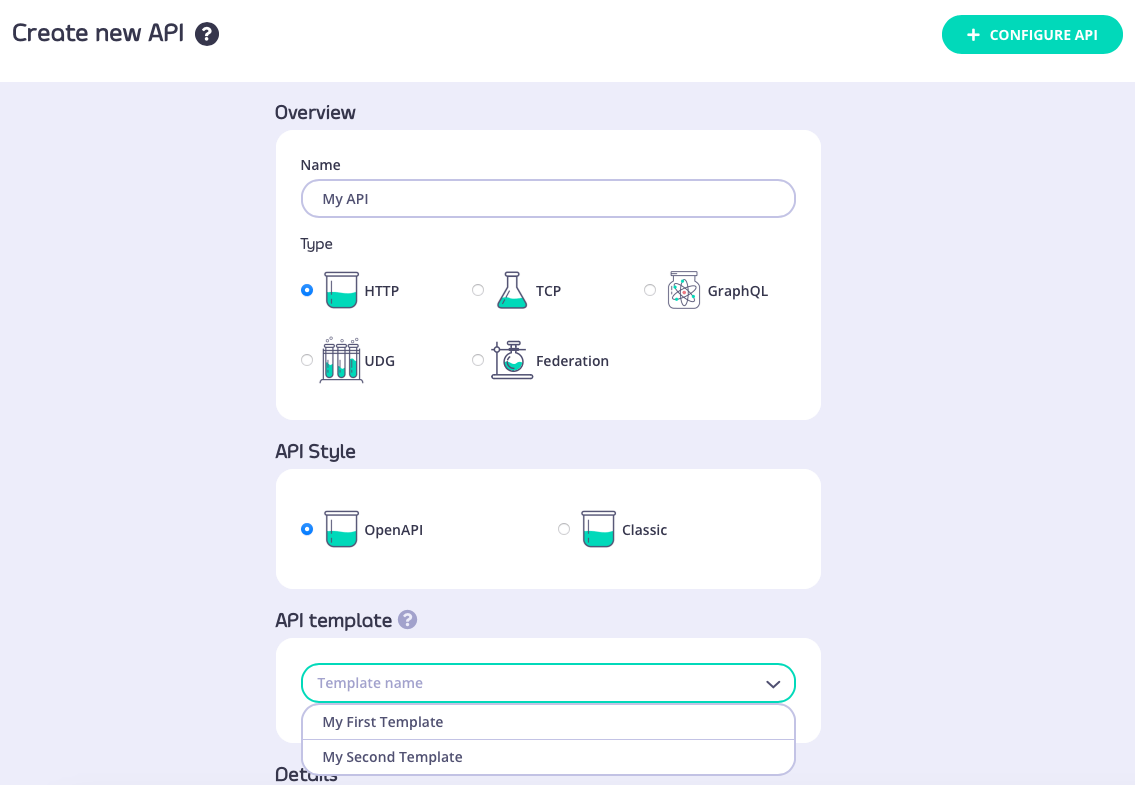
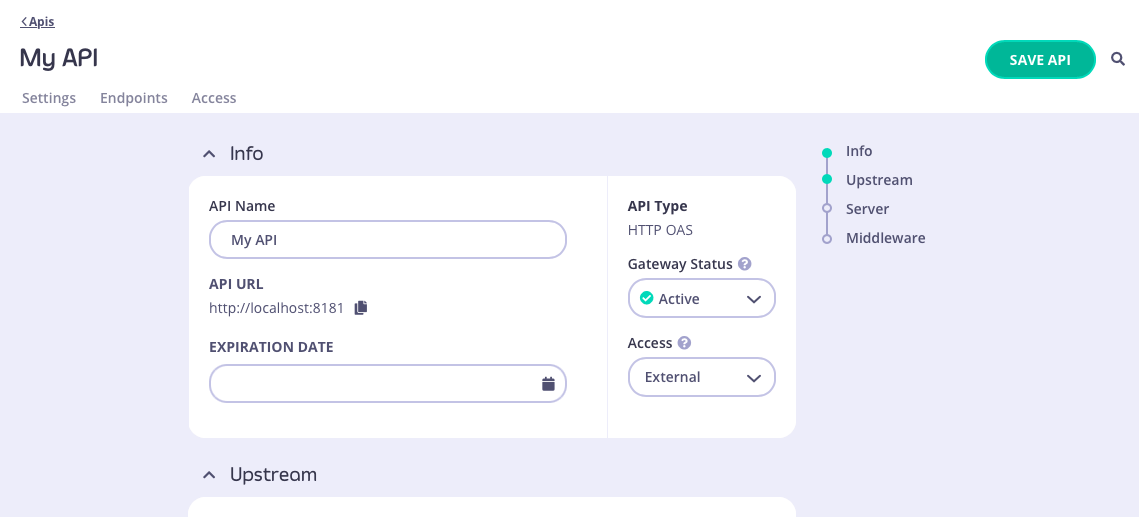
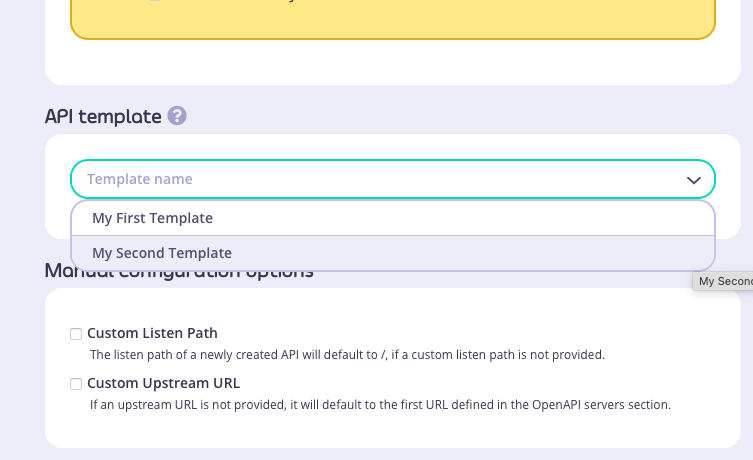
There are two ways to base a new API, created entirely within the Tyk Dashboard’s API Designer, on a template that you’ve created and registered with Tyk.You can go from the API Template screen - for the template you want to use, select CREATE API FROM TEMPLATE from the ACTIONS menu:Or, from the Created APIs screen, select ADD NEW API as normal and then select the template you want to use from the API Template section:Both of these routes will take you through to the API Designer, where the settings from your API template will be pre-configured.In this example, we applied “My first template” that we created here. You can see that the Gateway Status and Access fields have been configured:
Using a template when importing an OpenAPI description or API definition
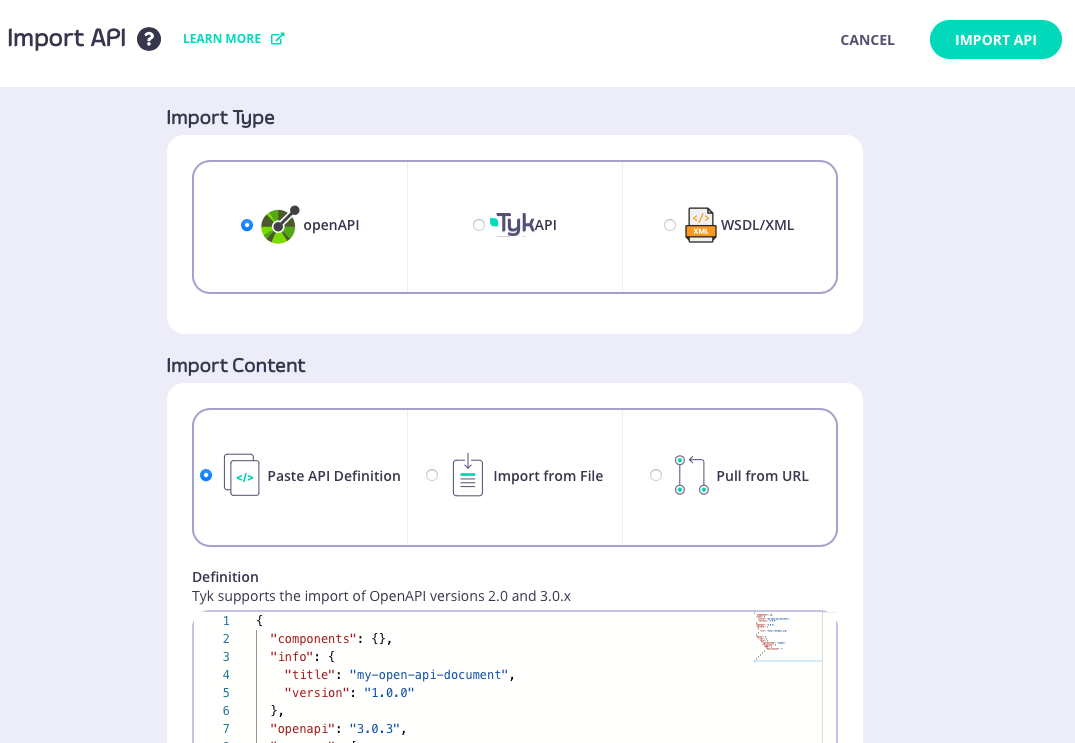
From the Import API screen, if you select the OpenAPI type then you can create an API from an OpenAPI description or Tyk OAS API definition; choose the appropriate method to provide this to the Dashboard:
paste the JSON into the text editor
provide a plain text file containing the JSON
provide a URL to the JSON
After pasting the JSON or locating the file, you can select the template you want to use from the API Template section:In this example we used this simple OpenAPI description and selected “My second template” that we created here:
The Dashboard UI allows you to edit and delete templates after they have been created and registered with the Tyk Dashboard
Editing a template
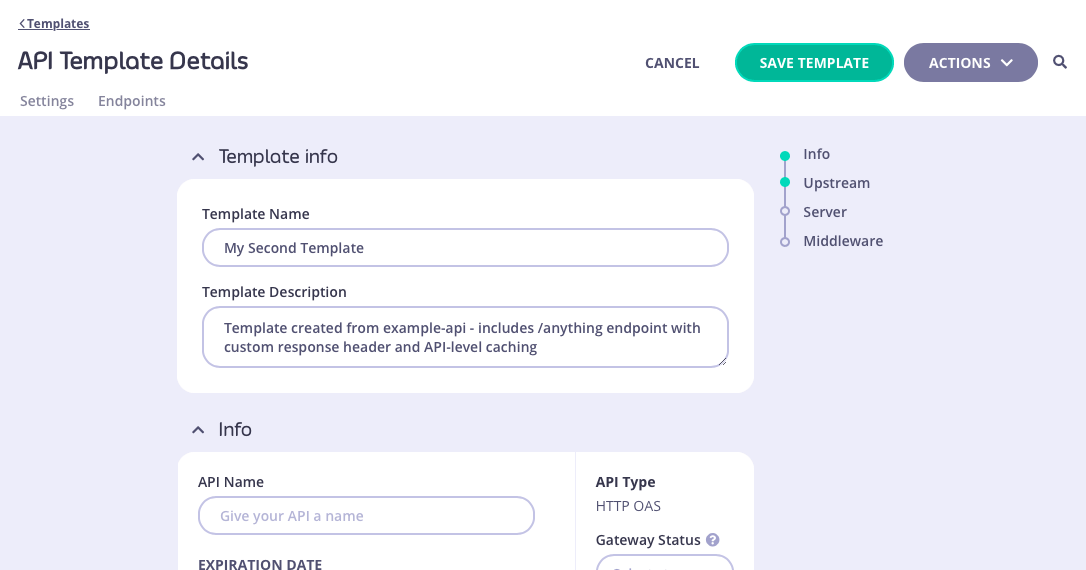
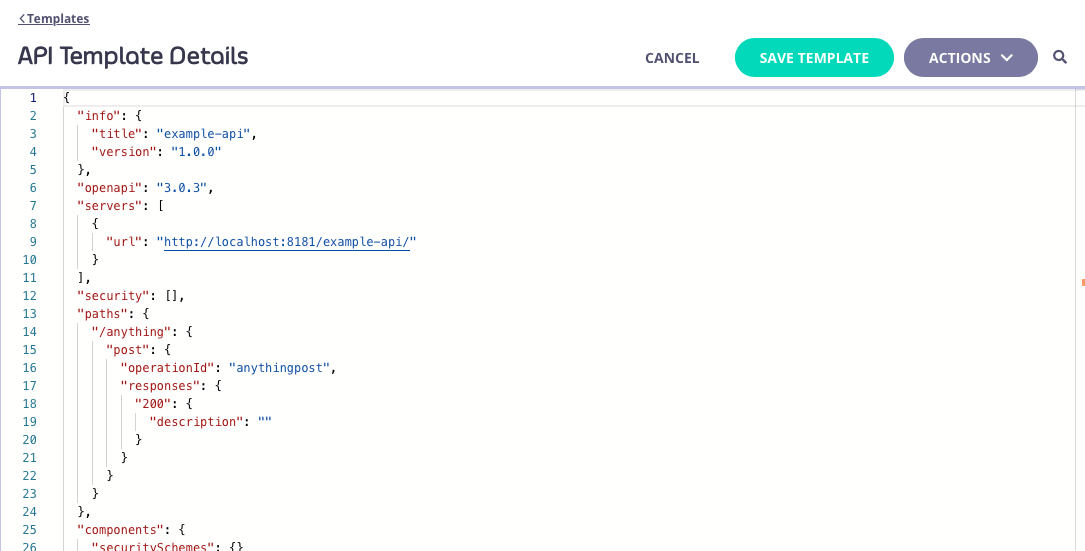
You can make changes to a template that has been registered with Tyk from the API Templates screen. For the template that you want to modify, simply select EDIT TEMPLATE from the ACTIONS menu:This will take you to the API Template Details screen where you can view the current template configuration. If you want to make changes, simply select EDIT to make the fields editable:Alternatively you can view and modify the raw JSON for the template by selecting VIEW RAW TEMPLATE from the ACTIONS menu:You’ll need to select SAVE TEMPLATE to apply your changes from either screen.
Deleting a template
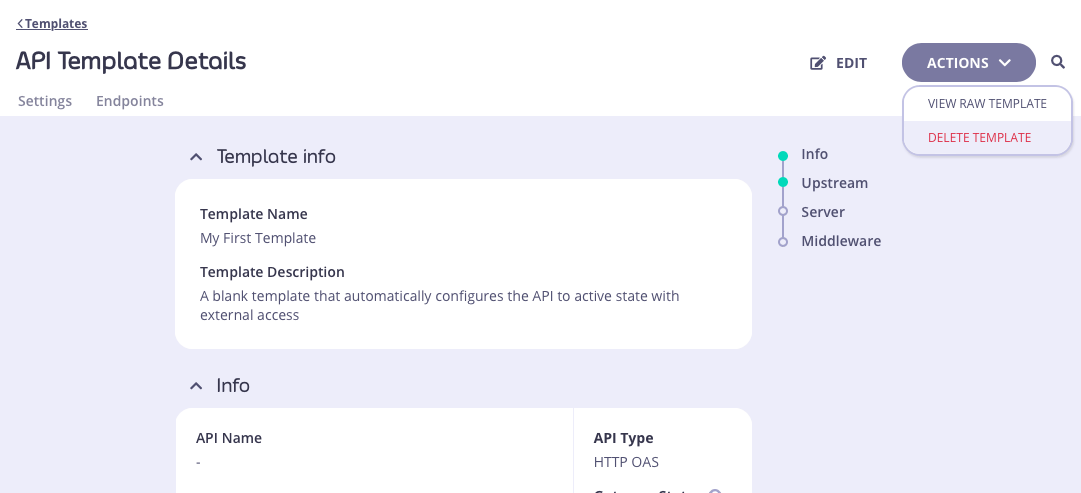
You can delete a template from your Tyk Dashboard from the API Template Details screen. This screen can be accessed by selecting the template from the API Templates screen (either by clicking on the template name, or selecting EDIT TEMPLATE from the ACTIONS menu):From the API Template Details screen you can select DELETE TEMPLATE from the ACTIONS menu:
You will be asked to confirm the deletion, because this is irrevocable. Once confirmed, the template will be removed from the database and cannot be recovered.
Working with API Templates using the Dashboard API
API Templates are an API governance feature provided to streamline the process of creating Tyk OAS APIs. An API template is an asset managed by Tyk Dashboard that is used as the starting point - a blueprint - from which you can create a new Tyk OAS API definition.The Tyk Dashboard API provides the following functionality to support working with API templates:
To register an API template with Tyk, you pass the asset in the body of a POST request to the dashboard’s /api/assets endpoint.For example, if you send this command to the endpoint:
Here Meta contains the database ID (where the asset has been registered in the persistent storage) and ID contains the unique identifier for the template. This unique identifier will be automatically generated by Tyk if none was provided in the id of the template asset provided in the curl request.
Applying a template when creating an API from an OpenAPI document
When creating an API on Tyk using an OpenAPI document describing your upstream service, you can use the /apis/oas/import endpoint to import the OpenAPI description and apply it to your API.If you have a template registered with your Dashboard, you can use this as the starting point for your new API. Tyk will combine the OpenAPI document with the template, automating the configuration of any element in the Tyk OAS API definition as defined in your chosen template.You’ll need to identify the template to be used during the import. You can use either its unique id or the database ID that was assigned when the template was registered with Tyk Dashboard. You provide either the id or _id in the templateID query parameter in the call to /oapis/oas/import.For example:
Here Meta contains the database ID (where the API has been registered in the persistent storage) and ID contains the unique identifier for the API. This unique identifier will be automatically generated by Tyk as none was provided in the id field of the x-tyk-api-gateway.info field provided in the curl request.The new Tyk OAS API will have this definition, combining the OpenAPI description provided in the body of the curl request with the template with Id my-unique-template-id:
Note that the GET /xml endpoint from the OpenAPI description and the POST /anything endpoint from the template (complete with requestSizeLimit middleware) have both been defined in the API definition. API-level caching has been enabled, as configured in the template. Tyk has included the server entry from the OpenAPI description (which points to the upstream server) and added the API URL on Tyk Gateway (as explained here).
Applying a template when creating an API from a Tyk OAS API definition
When creating an API using a complete Tyk OAS API definition (which includes x-tyk-api-gateway), you can use the /apis/oas endpoint to import the API defintiion.If you have a template registered with your Dashboard, you can use this as the starting point for your new API. Tyk will combine the API definition with the template, automating the configuration of any element defined in your chosen template.You’ll need to identify the template to be used during the import. You can use either its unique id or the database ID that was assigned when the template was registered with Tyk Dashboard. You provide either the id or _id in the templateID query parameter in the call to /apis/oas.For example:
Here Meta contains the database ID (where the API has been registered in the persistent storage) and ID contains the unique identifier for the API. This unique identifier will be automatically generated by Tyk as none was provided in the id field of the x-tyk-api-gateway.info field provided in the curl request.The new Tyk OAS API will have this definition, combining the Tyk OAS API definition provided in the body of the curl request with the template with Id my-unique-template-id:
Note that the GET /json endpoint from the OpenAPI description and the POST /anything endpoint from the template (complete with requestSizeLimit middleware) have both been defined in the API definition. API-level caching has been enabled, as configured in the template.
The Tyk Dashboard permission system can be extended by writing custom rules using an Open Policy Agent (OPA). The rules engine works on top of your Dashboard API, which means you can control not only access rules, but also behavior of all Dashboard APIs (except your public developer portal).To give you some inspiration here are some ideas of the rules you can implement now:
Enforce HTTP proxy option for all APIs for which the target URL does not point at the internal domain
Control access for individual fields. For example, do not allow changing the API “active” status (e.g. deploy), unless you have a specific permission set (and make new permissions to be available to the Dashboard/API). Custom permissions can be creating using the Additional Permissions API
Have a user(or group) which has read access to one APIs and write to another
OPA rule engine put on top of Dashboard API, which means you can control the behavior of all APIs (except public developer portal)
We have a video that demonstrates how our Open Policy Agent enables you to add custom permissions.
By default the Dashboard OPA engine is turned off, and you need to explicitly enable it via your Dashboard tyk_analytics.conf file.
You can then control OPA functionality on a global level via your tyk_analytics.conf file, or at an organization level using either the OPA API or the Dashboard.
Key
Type
Description
Example
security.open_policy.enabled
boolean
Toggle support for OPA
false
security.open_policy.debug
boolean
Enable debugging mode, prints a lot of information to the console
false
security.open_policy.enable_api
boolean
Enable access to the OPA API, even for users with Admin role
false
security.additional_permissions
string map
Add custom user/user_group permissions. You can use them in your rules, and they will be displayed in the Dashboard
With the OPA turned on, the majority of the security rules will be dynamically evaluated based on these rules.Additionally, users can modify OPA rules, and define their own, through the OPA API. For Self-Managed installations you can access and modify the OPA rules from your Tyk installation directory from schemas/dashboard.rego.
Moreover, using these rules you can also modify request content. Our recommendation is to use those modifications in a development environment and remember to create a backup of the rego rules.
The Open Policy Agent (OPA, pronounced “oh-pa”) is an open source, general-purpose policy engine that unifies policy enforcement across the stack. OPA provides a high-level declarative language (Rego) that lets you specify policy as code and simple APIs to offload policy decision-making from your software. (source: https://www.openpolicyagent.org/docs/latest/)
OPA policies are expressed in a high-level declarative language called Rego. Rego (pronounced “ray-go”) is purpose-built for expressing policies over complex hierarchical data structures. For detailed information on Rego see the Policy Language documentation.Rego was inspired by Datalog, which is a well understood, decades old query language. Rego extends Datalog to support structured document models such as JSON.Rego queries are assertions on data stored in OPA. These queries can be used to define policies that enumerate instances of data that violate the expected state of the system.
Use Rego for defining a policy that is easy to read and write.Rego focuses on providing powerful support for referencing nested documents and ensuring that queries are correct and unambiguous.Rego is declarative so policy authors can focus on what queries should return rather than how queries should be executed. These queries are simpler and more concise than the equivalent in an imperative language.Like other applications which support declarative query languages, OPA is able to optimize queries to improve performance.Rego supports a variety of statements and functions. You can even use things like HTTP calls to build policies that depends on third-party APIs.
See more about the language itself here.
The main building block which is required for controlling access is a “deny” rule, which should return a detailed error in case of a rejection. You can specify multiple deny rules, and they will all be evaluated. If none of the rules was matched, user will be allowed to access the resource.A simple deny rule with a static error message can look like:
deny["User is not active"] { not input.user.active}
You can also specify a dynamic error message:
# None of the permissions was matched based on pathdeny[x] { count(request_permission) == 0 x := sprintf("Unknown action '%v'", [input.request.path])}
In addition, to deny rules, you can also modify the requests using patch_request.
You should respond with a JSON merge patch format https://tools.ietf.org/html/rfc7396
For example:
# Example: Enforce http proxy configuration for an APIs with category #external.patch_request[x] { request_permission[_] == "apis" request_intent == "write" contains(input.request.body.api_definition.name, "#external") x := {"api_definition": {"proxy": {"transport": {"proxy_url": "http://company-proxy:8080"}}}}}
In some cases, you may want to write a rule which is based on existing Tyk Object.
For example, you can write a rule for a policy API, which depends on the metadata of the API inside it.
The policy engine has access to the TykAPIGet function, which essentially just does a GET call to the Tyk Dashboard API.Example:
api := TykAPIGet("/apis/api/12345")contains(api.target_url, "external.com")
Getting changeset of current request
For requests which modify the content, you can get a changeset (e.g. difference) using the TykDiff function, combined with a TykAPIGet call to get the original object.Example:
# Example of the complex rule which forbids user to change API status, if he has some custom permissiondeny["You are not allowed to change API status"] { input.user.user_permissions["test_disable_deploy"] # Intent is to to update API request_permission[_] == "apis" request_intent == "write" # Lets get original API object, before update # TykAPIGet accepts API url as argument, e.g. to receive API object call: TykAPIGet("/api/apis/<api-id>") api := TykAPIGet(input.request.path) # TykDiff performs Object diff and returns JSON Merge Patch document https://tools.ietf.org/html/rfc7396 # For example if only state has changed diff may look like: {"api_definition":{"state": "active"}} diff := TykDiff(api, input.request.body) # API state has changed not is_null(diff.api_definition.active)}
Since Opa rules are declarative, to test them in the majority of the cases, you can test your rules without using the Tyk Dashboard, and using this Rego playground.
When it comes to the TykAPIGet and TykDiff functions, you can mock them in your tests.In order to understand how the Dashboard evaluates the rules, you can enable debugging mode by setting the security.open_policy.debug option, and in the Dashboard logs, you will see the detailed output with input and output of the rule engine. It can be useful to copy-paste the Dashboard log output to the Rego playground, fix the issue, and validate it on the Dashboard.When you modify the dashboard.opa file, you will need to restart your tyk Dashboard.
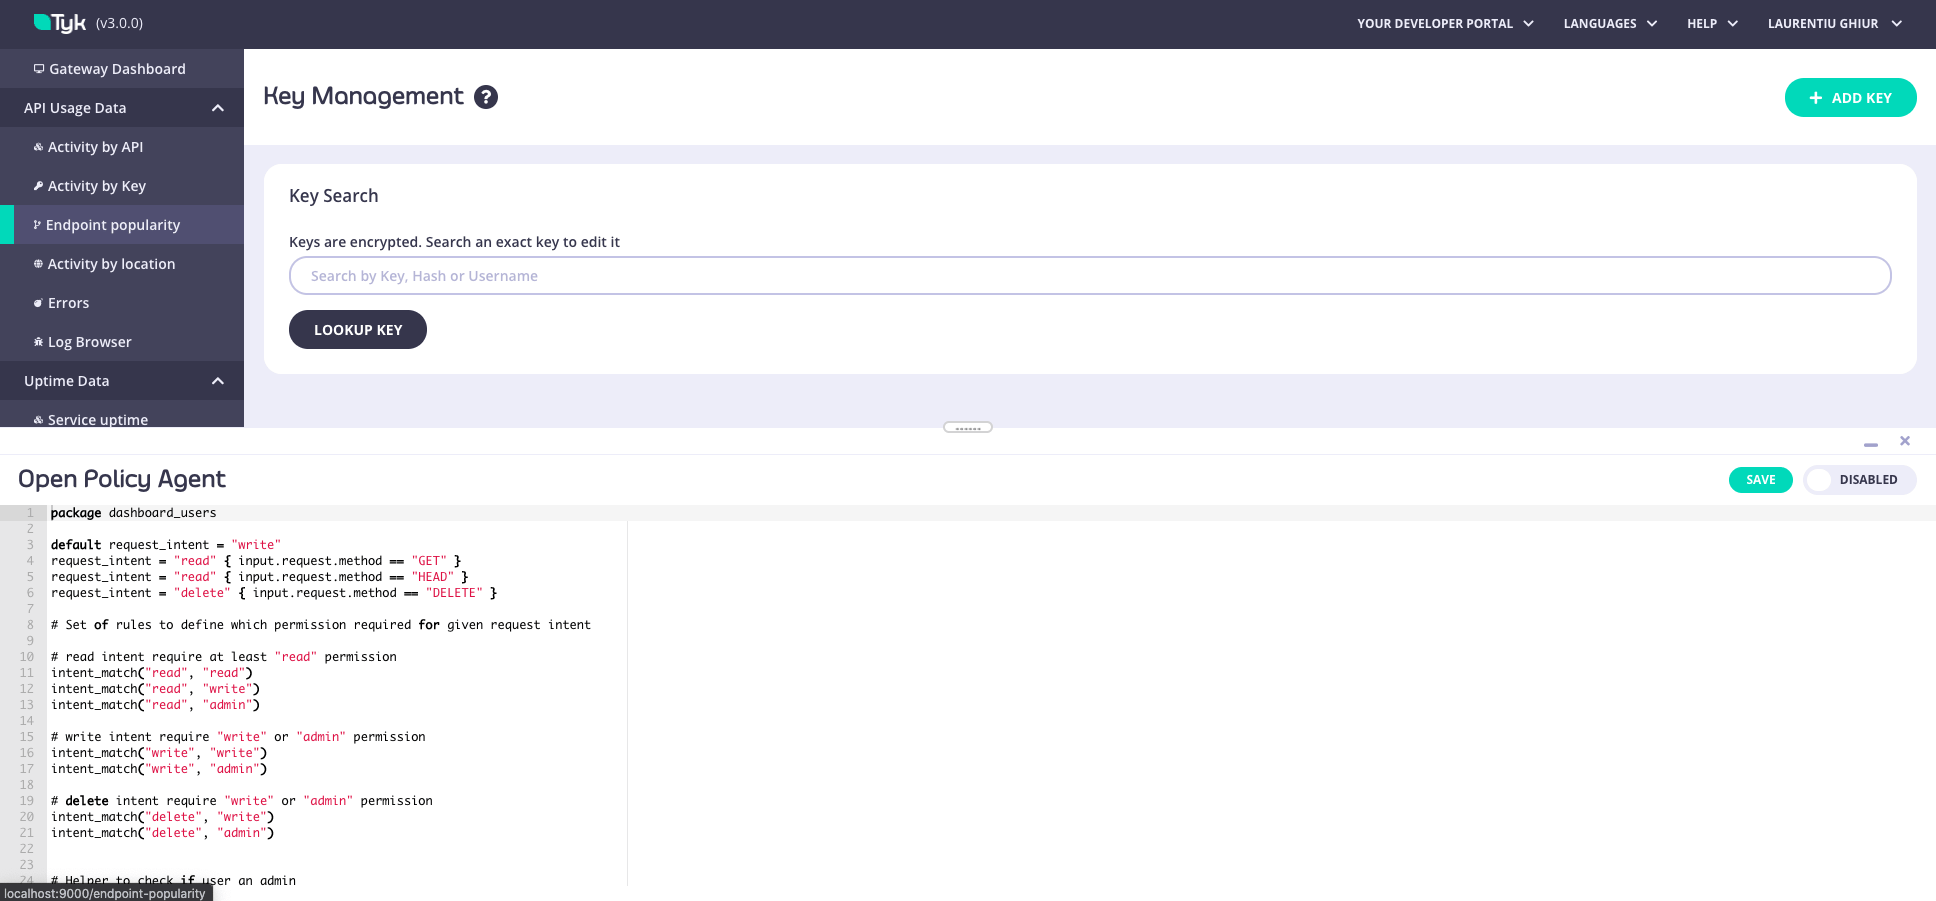
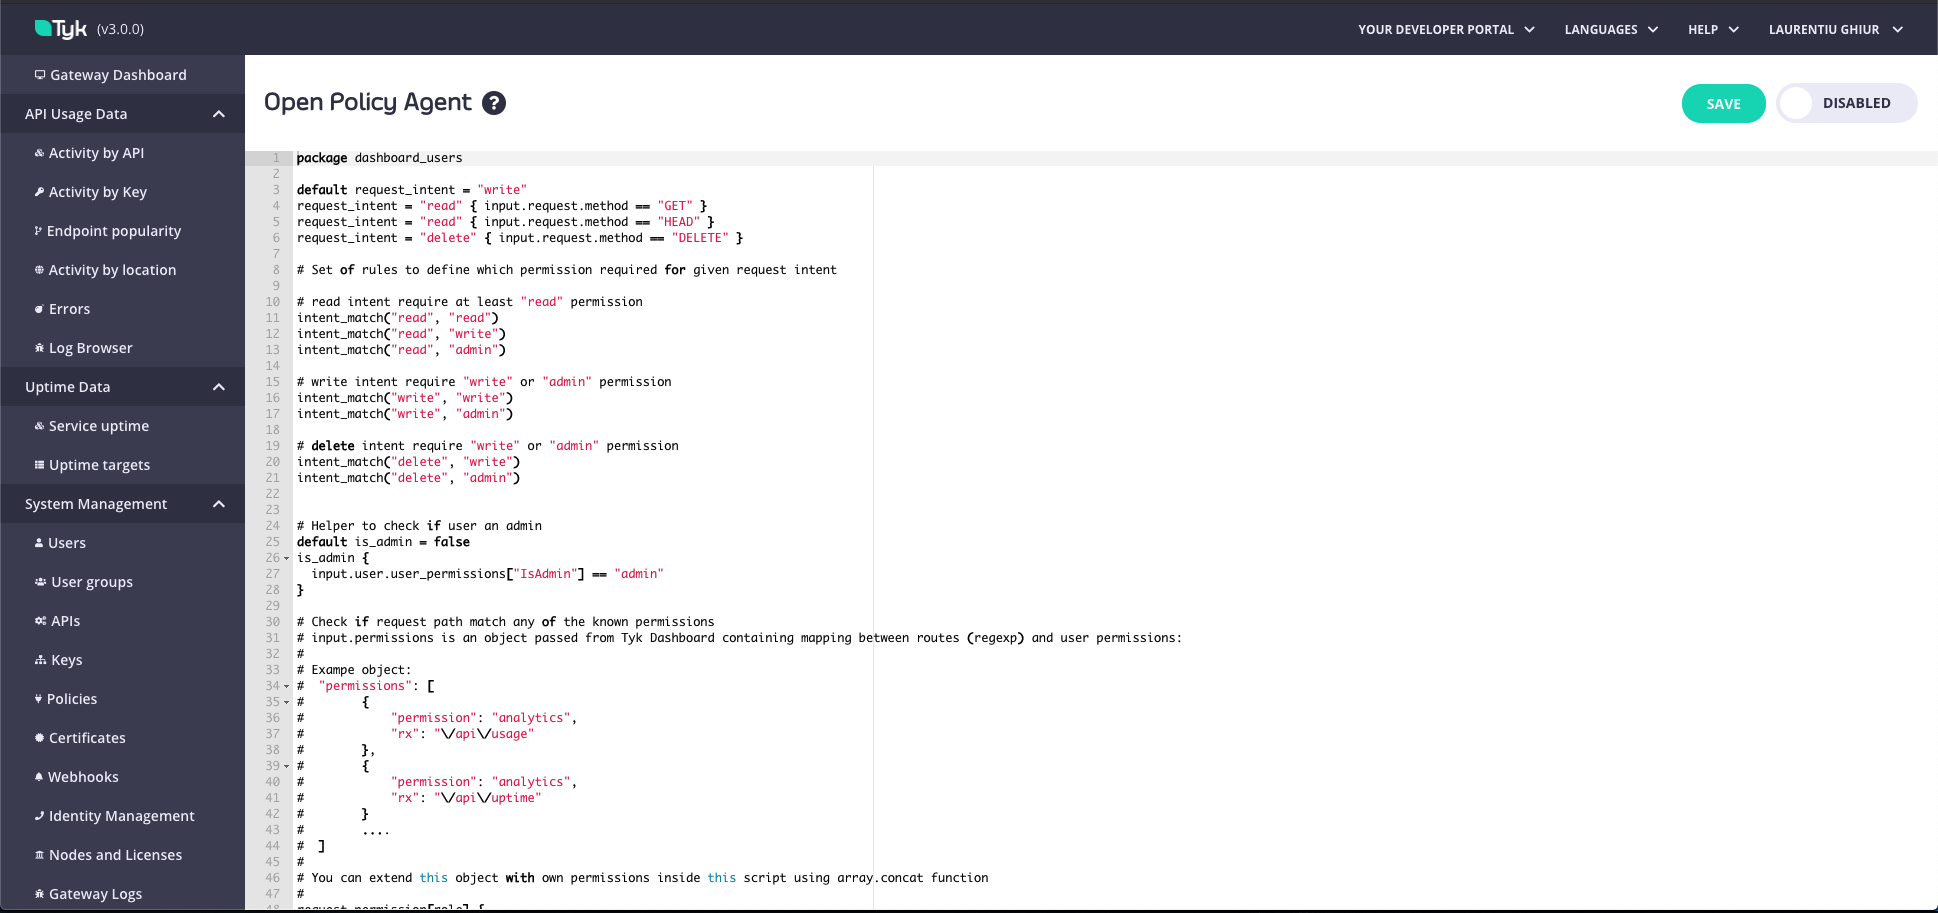
As well as configuring OPA rules through the API, admin users can view and edit OPA rules from within the Tyk Dashboard. The advantage of configuring your OPA rules in the Dashboard is that you can use a code editor for it, emulating a proper developer experience. There are two ways you can do this:
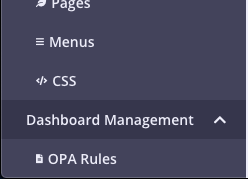
From the OPA Rules menu. From the Dashboard Management menu, select OPA Rules. You can view and make any changes and select whether your OPA rules should be enabled or disabled.
From Developer Tools. Using the keyboard shortcut CMD+SHIFT+D (or CTRL+SHIFT+D for PC), you can open the Developer Tools panel on any page in the Dashboard and configure the permissions. Updates are applied in real-time.
OPA rules can only be accessed by admin role users in the Dashboard.
# Default OPA rulespackage dashboard_usersdefault request_intent = "write"request_intent = "read" { input.request.method == "GET" }request_intent = "read" { input.request.method == "HEAD" }request_intent = "delete" { input.request.method == "DELETE" }# Set of rules to define which permission is required for a given request intent.# read intent requires, at a minimum, the "read" permissionintent_match("read", "read")intent_match("read", "write")intent_match("read", "admin")# write intent requires either the "write" or "admin" permissionintent_match("write", "write")intent_match("write", "admin")# delete intent requires either the "write" or "admin permissionintent_match("delete", "write")intent_match("delete", "admin")# Helper to check if the user has "admin" permissionsdefault is_admin = falseis_admin { input.user.user_permissions["IsAdmin"] == "admin"}is_self_key_reset { request_intent == "write" # The path must match /users/:userId/actions/key/reset path_parts := split(input.request.path, "/") path_parts[2] == "users" path_parts[4] == "actions" path_parts[5] == "key" path_parts[6] == "reset" # The path's userId must match the currently logged-in user's id path_parts[3] == input.user.id}is_me { # The path must match GET /users/:userId request_intent == "read" path_parts := split(input.request.path, "/") path_parts[2] == "users" # The path's userId must match the currently logged-in user's id path_parts[3] == input.user.id}# Check if the request path matches any of the known permissions.# input.permissions is an object passed from the Tyk Dashboard containing mapping between user permissions (“read”, “write” and “deny”) and the endpoint associated with the permission. # (eg. If “deny” is the permission for Analytics, it means the user would be denied the ability to make a request to ‘/api/usage’.)## Example object:# "permissions": [# {# "permission": "analytics",# "rx": "\\/api\\/usage"# },# {# "permission": "analytics",# "rx": "\\/api\\/uptime"# }# ....# ]## The input.permissions object can be extended with additional permissions (eg. you could create a permission called ‘Monitoring’ which gives “read” access to the analytics API ‘/analytics’). # This is can be achieved inside this script using the array.concat function.request_permission[role] { perm := input.permissions[_] regex.match(perm.rx, input.request.path) role := perm.permission}# --------- Start "deny" rules -----------# A deny object contains a detailed reason behind the denial.default allow = falseallow { count(deny) == 0 }deny["User is not active"] { not input.user.active}# If a request to an endpoint does not match any defined permissions, the request will be denied.deny[x] { # Only deny if there are NO matching permissions count(request_permission) == 0 # AND it's NOT a self-key-reset call not is_self_key_reset # AND it's NOT retrieving the user's own data not is_me # In that case, deny: x := sprintf("This action is unknown. You do not have permission to access '%v'.", [input.request.path])}# Reset password permissions are restricted.deny[x] { perm := request_permission[_] perm != "ResetPassword" # it's NOT admin not is_admin # AND it's NOT a self-key-reset call not is_self_key_reset # AND it's NOT retrieving the user's own data not is_me not input.user.user_permissions[perm] x := sprintf("You do not have permission to access '%v'.", [input.request.path])}# Deny requests for non-admins if the intent does not match or does not exist.deny[x] { # SKIP the check if it's self-key-reset not is_self_key_reset perm := request_permission[_] not is_admin not intent_match(request_intent, input.user.user_permissions[perm]) x := sprintf("You do not have permission to carry out '%v' operation.", [request_intent, input.request.path])}# If the "deny" rule is found, deny the operation for admins.deny[x] { not is_self_key_reset perm := request_permission[_] is_admin input.user.user_permissions[perm] == "deny" x := sprintf("You do not have permission to carry out '%v' operation.", [request_intent, input.request.path])}# Do not allow users (excluding admin users) to reset the password of another user.deny[x] { request_permission[_] = "ResetPassword" not is_admin user_id := split(input.request.path, "/")[3] user_id != input.user.id x := sprintf("You do not have permission to reset the password for other users.", [user_id])}# Do not allow admin users to reset passwords if it is not allowed in the global configdeny[x] { request_permission[_] == "ResetPassword" is_admin user_id := split(input.request.path, "/")[3] user_id != input.user.id not input.config.security.allow_admin_reset_password not input.user.user_permissions["ResetPassword"] x := "You do not have permission to reset the password for other users. As an admin user, this permission can be modified using OPA rules."}# --------- End "deny" rules ----------################################################################################################################### Demo Section: Examples of rule capabilities. ## The rules below are not executed until additional permissions have been assigned to the user or user group. #################################################################################################################### If you are testing using OPA playground, you can mock Tyk functions like this:## TykAPIGet(path) = {}# TykDiff(o1,o2) = {}## You can use this pre-built playground: https://play.openpolicyagent.org/p/T1Rcz5Ugnb# Example: Deny users the ability to change the API status with an additional permission.# Note: This rule will not be executed unless the additional permission is set.deny["You do not have permission to change the API status."] { # Checks the additional user permission enabled with tyk_analytics config: `"additional_permissions":["test_disable_deploy"]` input.user.user_permissions["test_disable_deploy"] # Checks the request intent is to update the API request_permission[_] == "apis" request_intent == "write" # Checks if the user is attempting to update the field for API status. # TykAPIGet accepts API URL as an argument, e.g. to receive API object call: TykAPIGet("/api/apis/<api-id>") api := TykAPIGet(input.request.path) # TykDiff performs Object diff and returns JSON Merge Patch document https://tools.ietf.org/html/rfc7396 # eg. If only the state has changed, the diff may look like: {"active": true} diff := TykDiff(api, input.request.body) # Checks if API state has changed. not is_null(diff.api_definition.active)}# Using the patch_request helper you can modify the content of the request# You should respond with JSON merge patch. # See https://tools.ietf.org/html/rfc7396 for more details## Example: Modify data under a certain condition by enforcing http proxy configuration for all APIs with the #external category. patch_request[x] { # Enforce only for users with ["test_patch_request"] permissions. # Remove the ["test_patch_request"] permission to enforce the proxy configuration for all users instead of those with the permission. input.user.user_permissions["test_patch_request"] request_permission[_] == "apis" request_intent == "write" contains(input.request.body.api_definition.name, "#external") isTykClassic() x := {"api_definition": {"proxy": {"transport": {"proxy_url": "http://company-proxy:8080"}}}}}# You can create additional permissions for not only individual users, but also user groups in your rules.deny["Only '%v' group has permission to access this API"] { # Checks for the additional user permission enabled with tyk_analytics config: '"additional_permissions":["test_admin_usergroup"] input.user.user_permissions["test_admin_usergroup"] # Checks that the request intent is to access the API. request_permission[_] == "apis" api := TykAPIGet(input.request.path) # Checks that the API being accessed has the category #admin-teamA contains(input.request.body.api_definition.name, "#admin-teamA") # Checks for the user group name. not input.user.group_name == "TeamA-Admin"}
Tyk’s RBAC includes out of the box permissions to Write, Read, and Deny access to API Definitions, but what if we want to distinguish between those users who can create APIs and those users who can edit or update APIs? Essentially, we want to extend Tyk’s out of the box RBAC to include more fine grained permissions that prevent an API Editor role from creating new APIs, but allow them to edit or update existing APIs.
To include the API Editor role with additional permissions, send a PUT Request to the Dashboard Additional Permissions API endpoint/api/org/permissionsSample RequestIn order to add the new role/permissions use the following payload.
PUT /api/org/permissions HTTP/1.1Host: localhost:3000authorization:7a7b140f-2480-4d5a-4e78-24049e3ba7f8{ "additional_permissions": { "api_editor": "API Editor" }}
Remember to set the authorization header to your Tyk Dashboard API Access Credentials secret, obtained from your user profile on the Dashboard UI.This assumes no other additional permissions already exist. If you’re adding to existing permissions you’ll want to send a GET to /api/org/permissions first, and then add the new permission to the existing list.
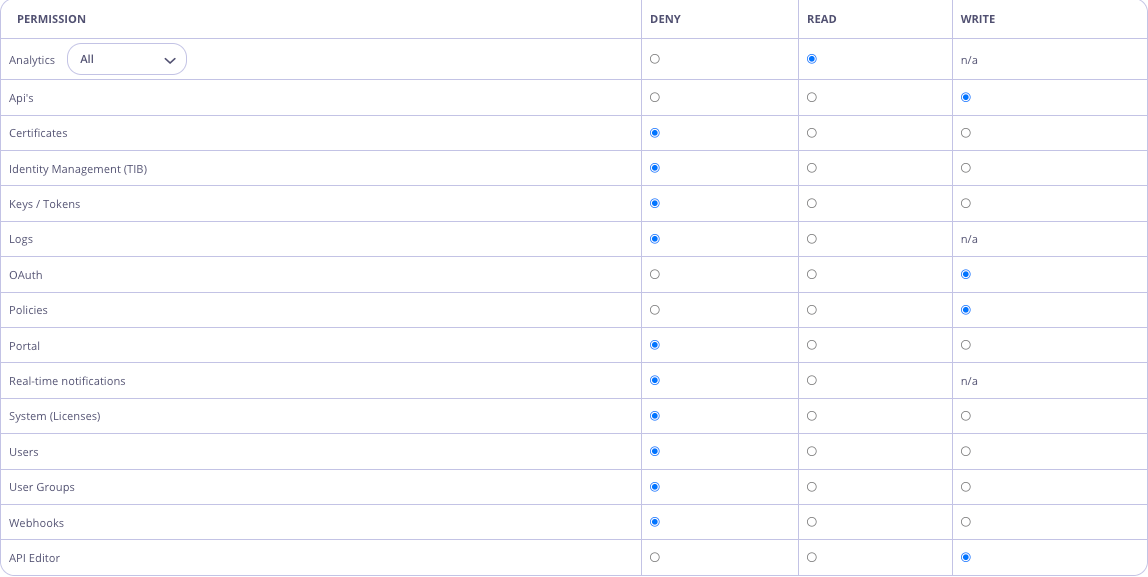
In the Dashboard UI, navigate to System Management -> Users, and hit the Add User button. Create a user that has API Write access and the newly created API Editor permission, e.g.
Add Open Policy Agent (OPA) Rule
In the Dashboard UI, navigate to Dashboard Management -> OPA RulesEdit the rules to add the following:
request_intent = "create" { input.request.method == "POST" }request_intent = "update" { input.request.method == "PUT" }# Editor and Creator intentintent_match("create", "write")intent_match("update", "write")# API Editors not allowed to create APIsdeny[x] { input.user.user_permissions["api_editor"] request_permission[_] == "apis" request_intent == "create" x := "API Editors not allowed to create APIs."}
Updated Default OPA Rules incorporating the above rules as follows:
# Default OPA rulespackage dashboard_usersdefault request_intent = "write"request_intent = "read" { input.request.method == "GET" }request_intent = "read" { input.request.method == "HEAD" }request_intent = "delete" { input.request.method == "DELETE" }request_intent = "create" { input.request.method == "POST" }request_intent = "update" { input.request.method == "PUT" }# Set of rules to define which permission is required for a given request intent.# read intent requires, at a minimum, the "read" permissionintent_match("read", "read")intent_match("read", "write")intent_match("read", "admin")# write intent requires either the "write" or "admin" permissionintent_match("write", "write")intent_match("write", "admin")# delete intent requires either the "write" or "admin permissionintent_match("delete", "write")intent_match("delete", "admin")# Editor and Creator intentintent_match("create", "write")intent_match("update", "write")# Helper to check if the user has "admin" permissionsdefault is_admin = falseis_admin { input.user.user_permissions["IsAdmin"] == "admin"}# Check if the request path matches any of the known permissions.# input.permissions is an object passed from the Tyk Dashboard containing mapping between user permissions (“read”, “write” and “deny”) and the endpoint associated with the permission. # (eg. If “deny” is the permission for Analytics, it means the user would be denied the ability to make a request to ‘/api/usage’.)## Example object:# "permissions": [# {# "permission": "analytics",# "rx": "\\/api\\/usage"# },# {# "permission": "analytics",# "rx": "\\/api\\/uptime"# }# ....# ]## The input.permissions object can be extended with additional permissions (eg. you could create a permission called ‘Monitoring’ which gives “read” access to the analytics API ‘/analytics’). # This is can be achieved inside this script using the array.concat function.request_permission[role] { perm := input.permissions[_] regex.match(perm.rx, input.request.path) role := perm.permission}# --------- Start "deny" rules -----------# A deny object contains a detailed reason behind the denial.default allow = falseallow { count(deny) == 0 }deny["User is not active"] { not input.user.active}# If a request to an endpoint does not match any defined permissions, the request will be denied.deny[x] { count(request_permission) == 0 x := sprintf("This action is unknown. You do not have permission to access '%v'.", [input.request.path])}deny[x] { perm := request_permission[_] perm != "ResetPassword" not is_admin not input.user.user_permissions[perm] x := sprintf("You do not have permission to access '%v'.", [input.request.path])}# Deny requests for non-admins if the intent does not match or does not exist.deny[x] { perm := request_permission[_] not is_admin not intent_match(request_intent, input.user.user_permissions[perm]) x := sprintf("You do not have permission to carry out '%v' operation.", [request_intent, input.request.path])}# If the "deny" rule is found, deny the operation for adminsdeny[x] { perm := request_permission[_] is_admin input.user.user_permissions[perm] == "deny" x := sprintf("You do not have permission to carry out '%v' operation.", [request_intent, input.request.path])}# Do not allow users (excluding admin users) to reset the password of another user.deny[x] { request_permission[_] = "ResetPassword" not is_admin user_id := split(input.request.path, "/")[3] user_id != input.user.id x := sprintf("You do not have permission to reset the password for other users.", [user_id])}# Do not allow admin users to reset passwords if it is not allowed in the global configdeny[x] { request_permission[_] == "ResetPassword" is_admin not input.config.security.allow_admin_reset_password not input.user.user_permissions["ResetPassword"] x := "You do not have permission to reset the password for other users. As an admin user, this permission can be modified using OPA rules."}# API Editors not allowed to create APIsdeny[x] { input.user.user_permissions["api_editor"] request_permission[_] == "apis" request_intent == "create" x := "API Editors not allowed to create APIs."}# --------- End "deny" rules ----------################################################################################################################### Demo Section: Examples of rule capabilities. ## The rules below are not executed until additional permissions have been assigned to the user or user group. #################################################################################################################### If you are testing using OPA playground, you can mock Tyk functions like this:## TykAPIGet(path) = {}# TykDiff(o1,o2) = {}## You can use this pre-built playground: https://play.openpolicyagent.org/p/T1Rcz5Ugnb# Example: Deny users the ability to change the API status with an additional permission.# Note: This rule will not be executed unless the additional permission is set.deny["You do not have permission to change the API status."] { # Checks the additional user permission enabled with tyk_analytics config: `"additional_permissions":["test_disable_deploy"]` input.user.user_permissions["test_disable_deploy"] # Checks the request intent is to update the API request_permission[_] == "apis" request_intent == "write" # Checks if the user is attempting to update the field for API status. # TykAPIGet accepts API URL as an argument, e.g. to receive API object call: TykAPIGet("/api/apis/<api-id>") api := TykAPIGet(input.request.path) # TykDiff performs Object diff and returns JSON Merge Patch document https://tools.ietf.org/html/rfc7396 # eg. If only the state has changed, the diff may look like: {"active": true} diff := TykDiff(api, input.request.body) # Checks if API state has changed. not is_null(diff.api_definition.active)}# Using the patch_request helper you can modify the content of the request# You should respond with JSON merge patch. # See https://tools.ietf.org/html/rfc7396 for more details## Example: Modify data under a certain condition by enforcing http proxy configuration for all APIs with the #external category. patch_request[x] { # Enforce only for users with ["test_patch_request"] permissions. # Remove the ["test_patch_request"] permission to enforce the proxy configuration for all users instead of those with the permission. input.user.user_permissions["test_patch_request"] request_permission[_] == "apis" request_intent == "write" contains(input.request.body.api_definition.name, "#external") x := {"api_definition": {"proxy": {"transport": {"proxy_url": "http://company-proxy:8080"}}}}}# You can create additional permissions for not only individual users, but also user groups in your rules.deny["Only '%v' group has permission to access this API"] { # Checks for the additional user permission enabled with tyk_analytics config: '"additional_permissions":["test_admin_usergroup"] input.user.user_permissions["test_admin_usergroup"] # Checks that the request intent is to access the API. request_permission[_] == "apis" api := TykAPIGet(input.request.path) # Checks that the API being accessed has the category #admin-teamA contains(input.request.body.api_definition.name, "#admin-teamA") # Checks for the user group name. not input.user.group_name == "TeamA-Admin"}
Login to the Dashboard UI as the new API Editor user and try to create a new API. You should see an Access Denied error message. Now try to update an existing API. This should be successful!!
Many businesses have a complex structure, for example a lot of distinct departments where each department has its own teams. You might also need to deploy and manage multiple environments such as Production, Staging and QA for different stages in your product workflow. The Tyk Dashboard is multi-tenant capable which allows you to use a single Tyk Dashboard to host separate organizations for each team or environment.An Organization is a completely isolated unit, and has its own:
API Definitions
API Keys
Users
Developers
Domain
Tyk Classic Portal
When bootstrapping your Dashboard, the first thing the bootstrap script does is to create a new default Organization.Additional organizations can be created and managed using the Dashboard Admin API.
The concept of an organization does not exist within the Tyk Gateway. Gateways only proxy and validate the rules imposed on them by the definitions and keys that are being processed, however at their core there are some security checks within the Gateway that ensure organizational ownership of objects.Tyk allows each organization to own its own set of Gateways, for example when you want to use different hosting providers you can segregate them in terms of resources, or just for security reasons.Self-Managed users should use API tagging and enforce a tagging standard across all organizations.All actions in a Self-Managed installation of Tyk must use a base Organization, and all actions should stem from a User owned by that organization.
A user that does not belong to an Organization is sometimes referred to as an unbounded user. These users have visibility across all Organizations, but should be granted read-only access.
The audit log system captures detailed records of all requests made to endpoints under the /api route. These audit logs can be stored either in files (in JSON or text format) or in the database, providing flexible options for log management and retrieval.Subsequently, if hosting Tyk Dashboard within a Kubernetes cluster, please ensure that the configured log file path is valid and writeable.The Tyk Dashboard config section contains an audit section for configuring audit logging behavior. An example is listed below.
Enable audit logging. Setting security.audit_log_path also enables audit logging
true
format
Specifies audit log file format. Valid values are json and text
text
path
Path to the audit log. Overwrites security.audit_log_path if it was set
detailed_recording
Enable detailed records in the audit log. If set to true then audit log records will contain the http-request (without body) and full http-response including the body
false
store_type
Specifies the storage in which audit logs will be written, valid values are file and db.
In addition to file storage, audit logs can be stored in the main database (MongoDB or Postgres), this feature has been available since Tyk 5.7.0. To enable database storage set audit.store_type to db:
Since Tyk 5.7.0 a new API endpoint has been added to allow authorized users to retrieve audit logs from the database storage. To know more about the API specifications, check out the swagger documentation.
To access the audit logs through the API ensure that your user account or group has been granted the “Audit Logs” RBAC group. If you do not have the necessary permissions, please contact your system administrator.
Note: mongo-go driver has been available since Tyk 5.0.2 and is the default from Tyk 5.3.0.
MongoDB 3.x to 4.4.xPrior to Tyk 5.0.2, Tyk used the mgo driver which supported MongoDB 3.x to 4.4.x, but we no longer test MongoDB versions prior to 5.0 since they are EOL. We can not guarantee full compatibility with these versions of MongoDB for Tyk and recommend upgrading to a supported MongoDB version. In particular, when using Tyk OAS APIs with Tyk 5.3.0 onwards, the minimum supported version of MongoDB is 5.0.
You can also use the following as a drop-in replacement for MongoDB:
In a production environment, we only support the PostgreSQL versions listed above.
For POC, you can also use the following as replacement:
SQLite 3.x
SQLite support will be deprecated from Tyk 5.7.0. To avoid disrupution, please transition to PostgreSQL, MongoDB or one of the listed compatible alternatives.
Tyk no longer supports SQLite as of Tyk 5.7.0. To avoid disruption, please transition to PostgreSQL, MongoDB, or one of the listed compatible alternatives.
We recommend the following:
For PoC installations, you can use PostgreSQL or MongoDB.
For production installations, we only support MongoDB or PostgreSQL
Tyk stores a variety of data in 4 separate data storage layers. You can configure each layer separately to use one of our supported database platforms. Alternatively a single platform can be used for all layers. The 4 data storage layers are as follows:
Main: Stores configurations of: APIs, Policies, Users and User Groups.
Aggregate Analytics: Data used to display Dashboard charts and analytics.
Logs: When detailed logging is enabled, request and response data is logged to storage. These logs can previewed in the Dashboard log browser.
Uptime: Uptime test analytics.
Being extensible, Tyk supports storing this data across different databases (MongoDB, MySQL and PostgreSQL etc.). For example, Tyk can be configured to store analytics in PostgreSQL, logs in MongoDB and uptime data in MySQL.As illustrated below it can be seen that Tyk Pump writes to one or more external data sources via a Redis store. Conversely, Tyk Dashboard reads this data from the external data sources.The following details are required to manage this configuration:
Data storage layer type
Database engine
Database connection string
The remainder of this document explains how to configure Tyk Dashboard and Tyk Pump to read and write from one or more data storage layers, respectively.
where LAYER can be MAIN, ANALYTICS, LOGS or UPTIME.For example, to configure Tyk Dashboard to read logs from a mongo database, the following environment variables are required:
It should be noted that Tyk will attempt to use the configuration for the main data storage layer when no corresponding configuration is available for logs, uptime or analytics.Please refer to the storage configuration section to explore the parameters for configuring Tyk Dashboard to read from different storage layers.
Please consult the Pump configuration guide for an explanation of how to configure Tyk Pump to write to different storage layers.The remainder of this section explains the environment variables that can be used to configure Tyk Pump to write to the following data storage layers:
Aggregated analytics corresponds to data that is used for the display of charts and graphs in dashboard. Tyk Pump can be configured to write aggregated analytics data to SQL based databases or MongoDB.
SQL Database
Tyk no longer supports SQLite as of Tyk 5.7.0. To avoid disruption, please transition to PostgreSQL, MongoDB, or one of the listed compatible alternatives.
Storage of aggregated analytics data has been tested with PostgreSQL and SqlLite databases. The following environment variables can be used to manage this configuration:
TYK_PMP_PUMPS_SQLAGGREGATE_TYPE: Set to sql_aggregate to configure Pump to store aggregated analytics data for charts and graphs in dashboard to a SQL based database.
TYK_PMP_PUMPS_SQLAGGREGATE_META_TYPE: The database engine used to store aggregate analytics. Tested values are postgres or sqlite.
TYK_PMP_PUMPS_SQLAGGREGATE_META_CONNECTIONSTRING: The connection string for the database that will store the aggregated analytics.
The example below demonstrates how to configure Tyk Pump to write aggregated to a PostgreSQL database:
Tyk Pump can be configured to write aggregated analytics data to MongoDB. Aggregated analytics are written to a collection named z_tyk_analyticz_aggregate_{ORG ID}, where ORG_ID corresponds to the ID of your organization assigned by Tyk.The following environment variables can be used as a minimum to manage this configuration:
TYK_PMP_PUMPS_MONGOAGGREGATE_TYPE: Set to mongo-pump-aggregate to configure Pump to store aggregated analytics data in a MongoDB database.