> ## Documentation Index
> Fetch the complete documentation index at: https://tyk.io/docs/llms.txt
> Use this file to discover all available pages before exploring further.
# Configure Telemetry in Tyk Cloud
> Learn how to set up and manage telemetry in Tyk Cloud for distributed tracing, application logs, and gateway metrics export.
Tyk Cloud supports three types of observability data:
* **Distributed Traces**: Track request flow, identify bottlenecks, and troubleshoot issues.
* **Gateway Metrics**: Export RED (Rate, Error, Duration) metrics to monitor API performance.
* **Application Logs**: Stream application logs in real time to your configured provider.
Traces and metrics are available for Cloud Data Plane deployments. Logs can be enabled for both Control Plane and Cloud Data Plane deployments.
This feature is built on Tyk Gateway's OpenTelemetry integration. See the [OpenTelemetry documentation](/api-management/traces) for configuration options and sampling strategies.
Telemetry is an add-on feature in Tyk Cloud. Contact our [support team](https://support.tyk.io/) to enable it for your account.
## Available Telemetry Providers
Tyk Cloud integrates with:
* [Datadog](#configure-providers)
* [Dynatrace](#configure-providers)
* [New Relic](#configure-providers)
* [Elastic](#configure-providers)
* [Custom](#configure-providers)
## Instructions
Configuring telemetry is a two-step process:
1. Configure a provider at the organization level.
2. Enable telemetry export on a Cloud Data Plane.
### Step 1: Configure a telemetry provider
1. In the Tyk Cloud Console, select **Telemetry**. A grid shows all supported providers.
Only one provider can be configured at a time.
 2. Click your preferred provider to open its configuration form.
3. Configure the following settings shared by all providers:
* **Connection Toggle**: Activates or deactivates telemetry export. When enabled, Tyk sends monitoring data to your chosen platform.
* **Sampling Rate**: Percentage of API traffic to send (default: 10%, meaning one in every ten API calls).
4. Optionally configure:
* **Tags to Add to the Traces**: Custom labels that make telemetry data easier to filter and analyze. For example:
```yaml theme={null}
environment: production
region: europe
team: api-gateway
```
* **Fields to Filter**: Fields to exclude from telemetry, useful for preventing sensitive data from reaching your monitoring platform.
5. Configure the provider-specific connection settings:
* **Provider Site**: Your Datadog URL (for example, `us5.datadoghq.com`). See [Datadog site documentation](https://docs.datadoghq.com/getting_started/site/#access-the-datadog-site).
* **API Key**: Your Datadog API key. See [Datadog API key documentation](https://docs.datadoghq.com/account_management/api-app-keys/#add-an-api-key-or-client-token).
```text theme={null}
Provider Site: us5.datadoghq.com
API Key: your-datadog-api-key
```
2. Click your preferred provider to open its configuration form.
3. Configure the following settings shared by all providers:
* **Connection Toggle**: Activates or deactivates telemetry export. When enabled, Tyk sends monitoring data to your chosen platform.
* **Sampling Rate**: Percentage of API traffic to send (default: 10%, meaning one in every ten API calls).
4. Optionally configure:
* **Tags to Add to the Traces**: Custom labels that make telemetry data easier to filter and analyze. For example:
```yaml theme={null}
environment: production
region: europe
team: api-gateway
```
* **Fields to Filter**: Fields to exclude from telemetry, useful for preventing sensitive data from reaching your monitoring platform.
5. Configure the provider-specific connection settings:
* **Provider Site**: Your Datadog URL (for example, `us5.datadoghq.com`). See [Datadog site documentation](https://docs.datadoghq.com/getting_started/site/#access-the-datadog-site).
* **API Key**: Your Datadog API key. See [Datadog API key documentation](https://docs.datadoghq.com/account_management/api-app-keys/#add-an-api-key-or-client-token).
```text theme={null}
Provider Site: us5.datadoghq.com
API Key: your-datadog-api-key
```
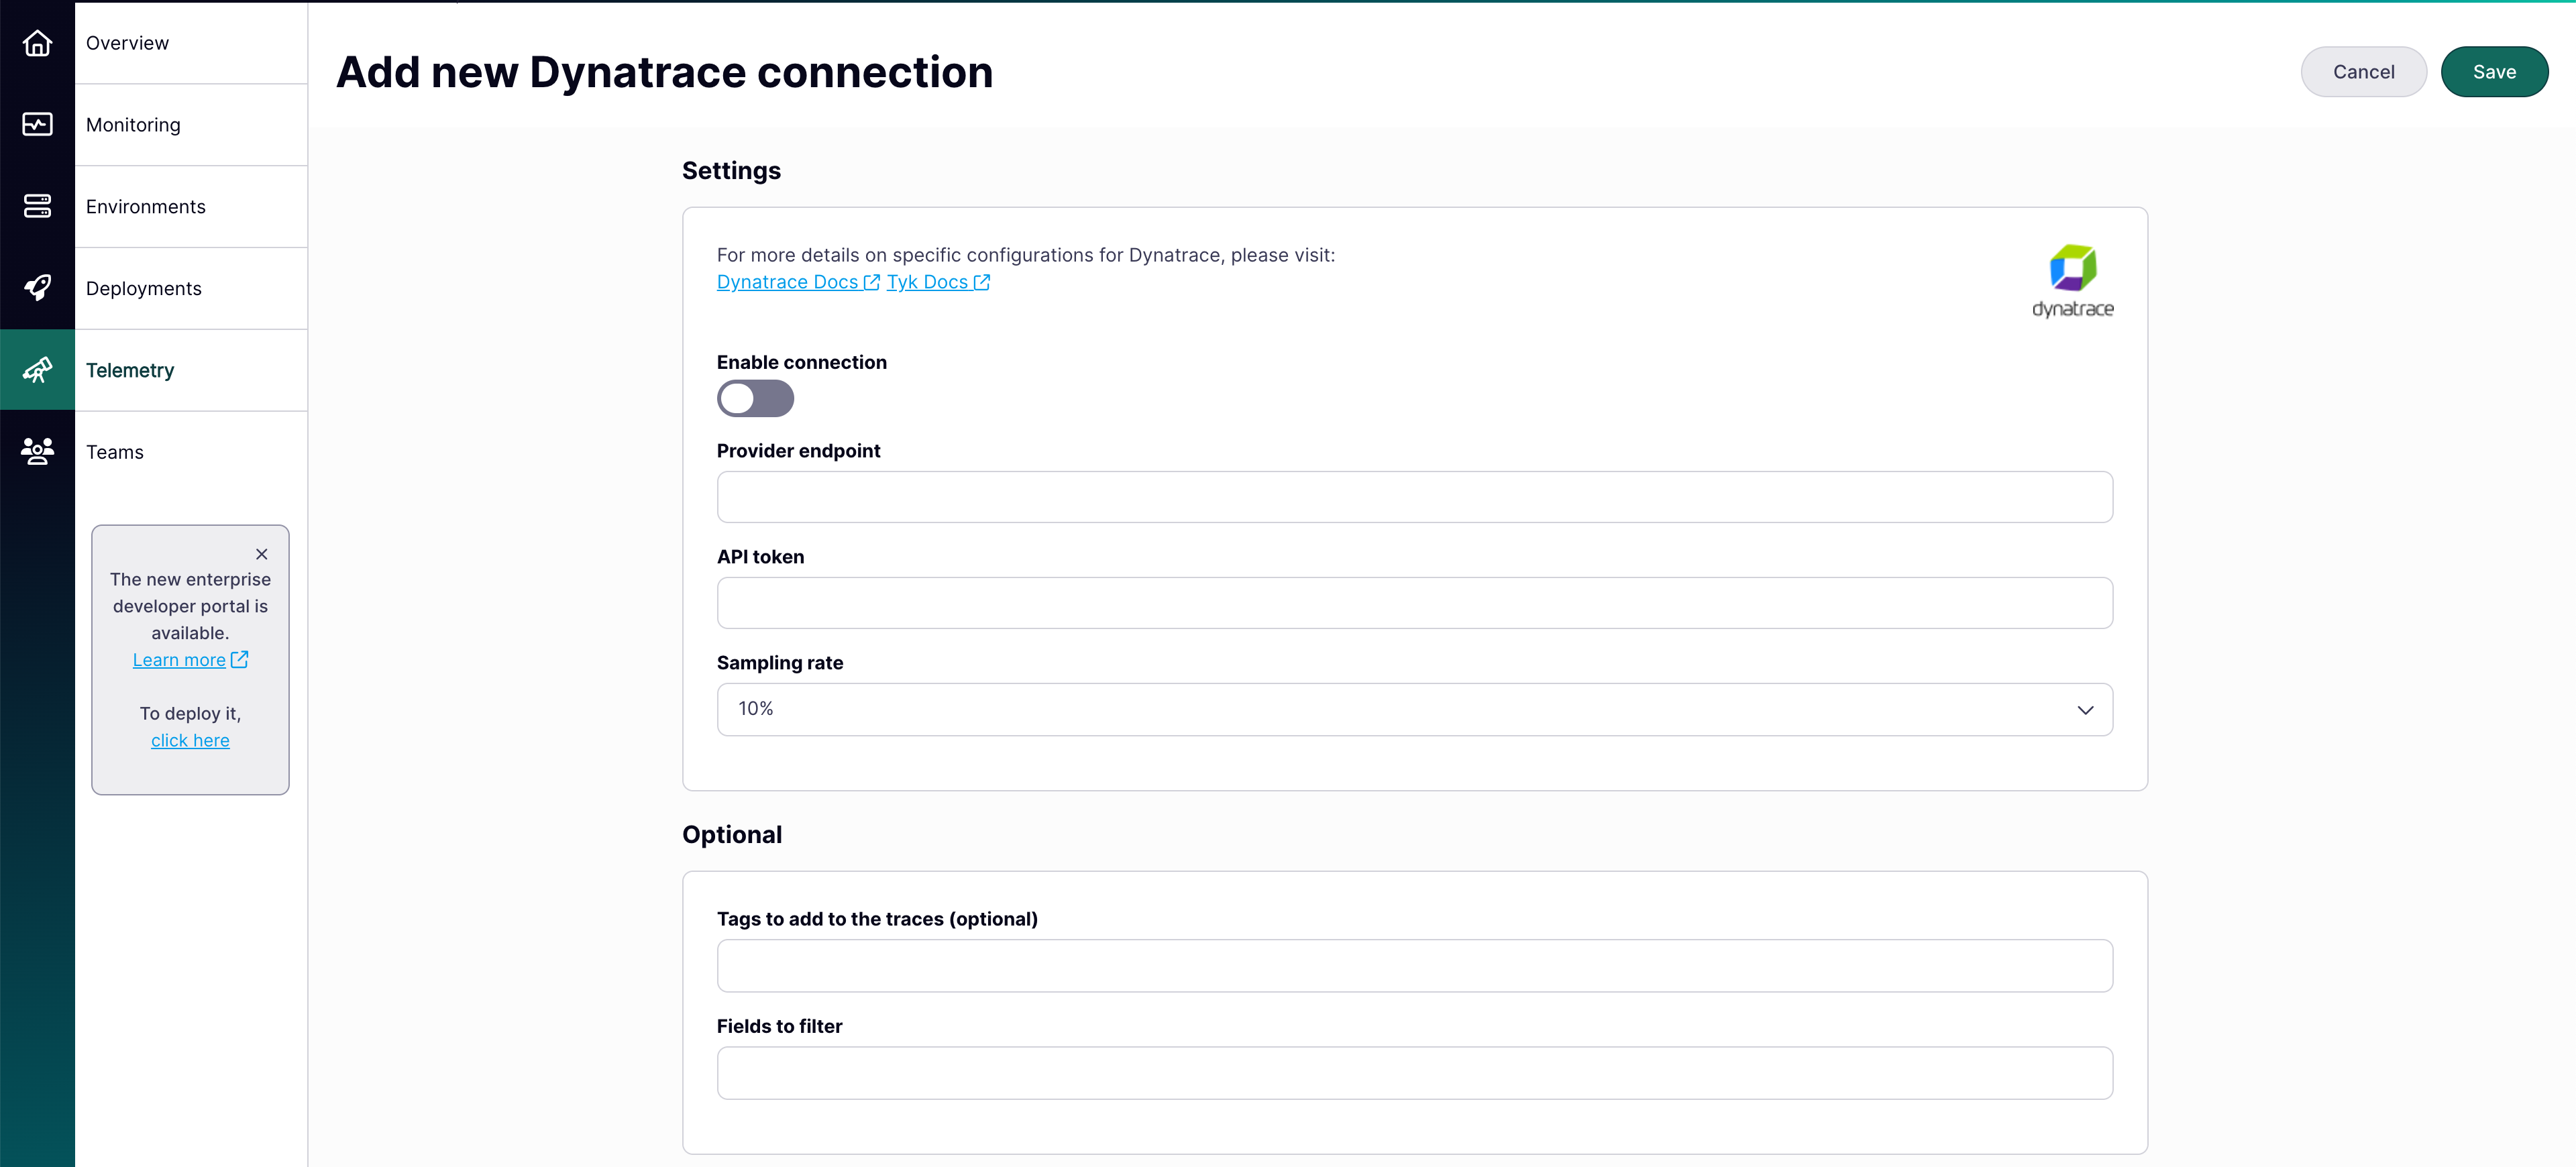
 * **Provider Endpoint**: Your Dynatrace environment URL. See [Dynatrace environment documentation](https://docs.dynatrace.com/docs/discover-dynatrace/get-started/monitoring-environment#environment-id).
* **API Token**: Your Dynatrace access token. See [Dynatrace access token documentation](https://docs.dynatrace.com/docs/manage/identity-access-management/access-tokens-and-oauth-clients/access-tokens#create-api-token).
```text theme={null}
Provider Endpoint: https://.live.dynatrace.com/api/v2/otlp
API Token: your-dynatrace-token
```
* **Provider Endpoint**: Your Dynatrace environment URL. See [Dynatrace environment documentation](https://docs.dynatrace.com/docs/discover-dynatrace/get-started/monitoring-environment#environment-id).
* **API Token**: Your Dynatrace access token. See [Dynatrace access token documentation](https://docs.dynatrace.com/docs/manage/identity-access-management/access-tokens-and-oauth-clients/access-tokens#create-api-token).
```text theme={null}
Provider Endpoint: https://.live.dynatrace.com/api/v2/otlp
API Token: your-dynatrace-token
```
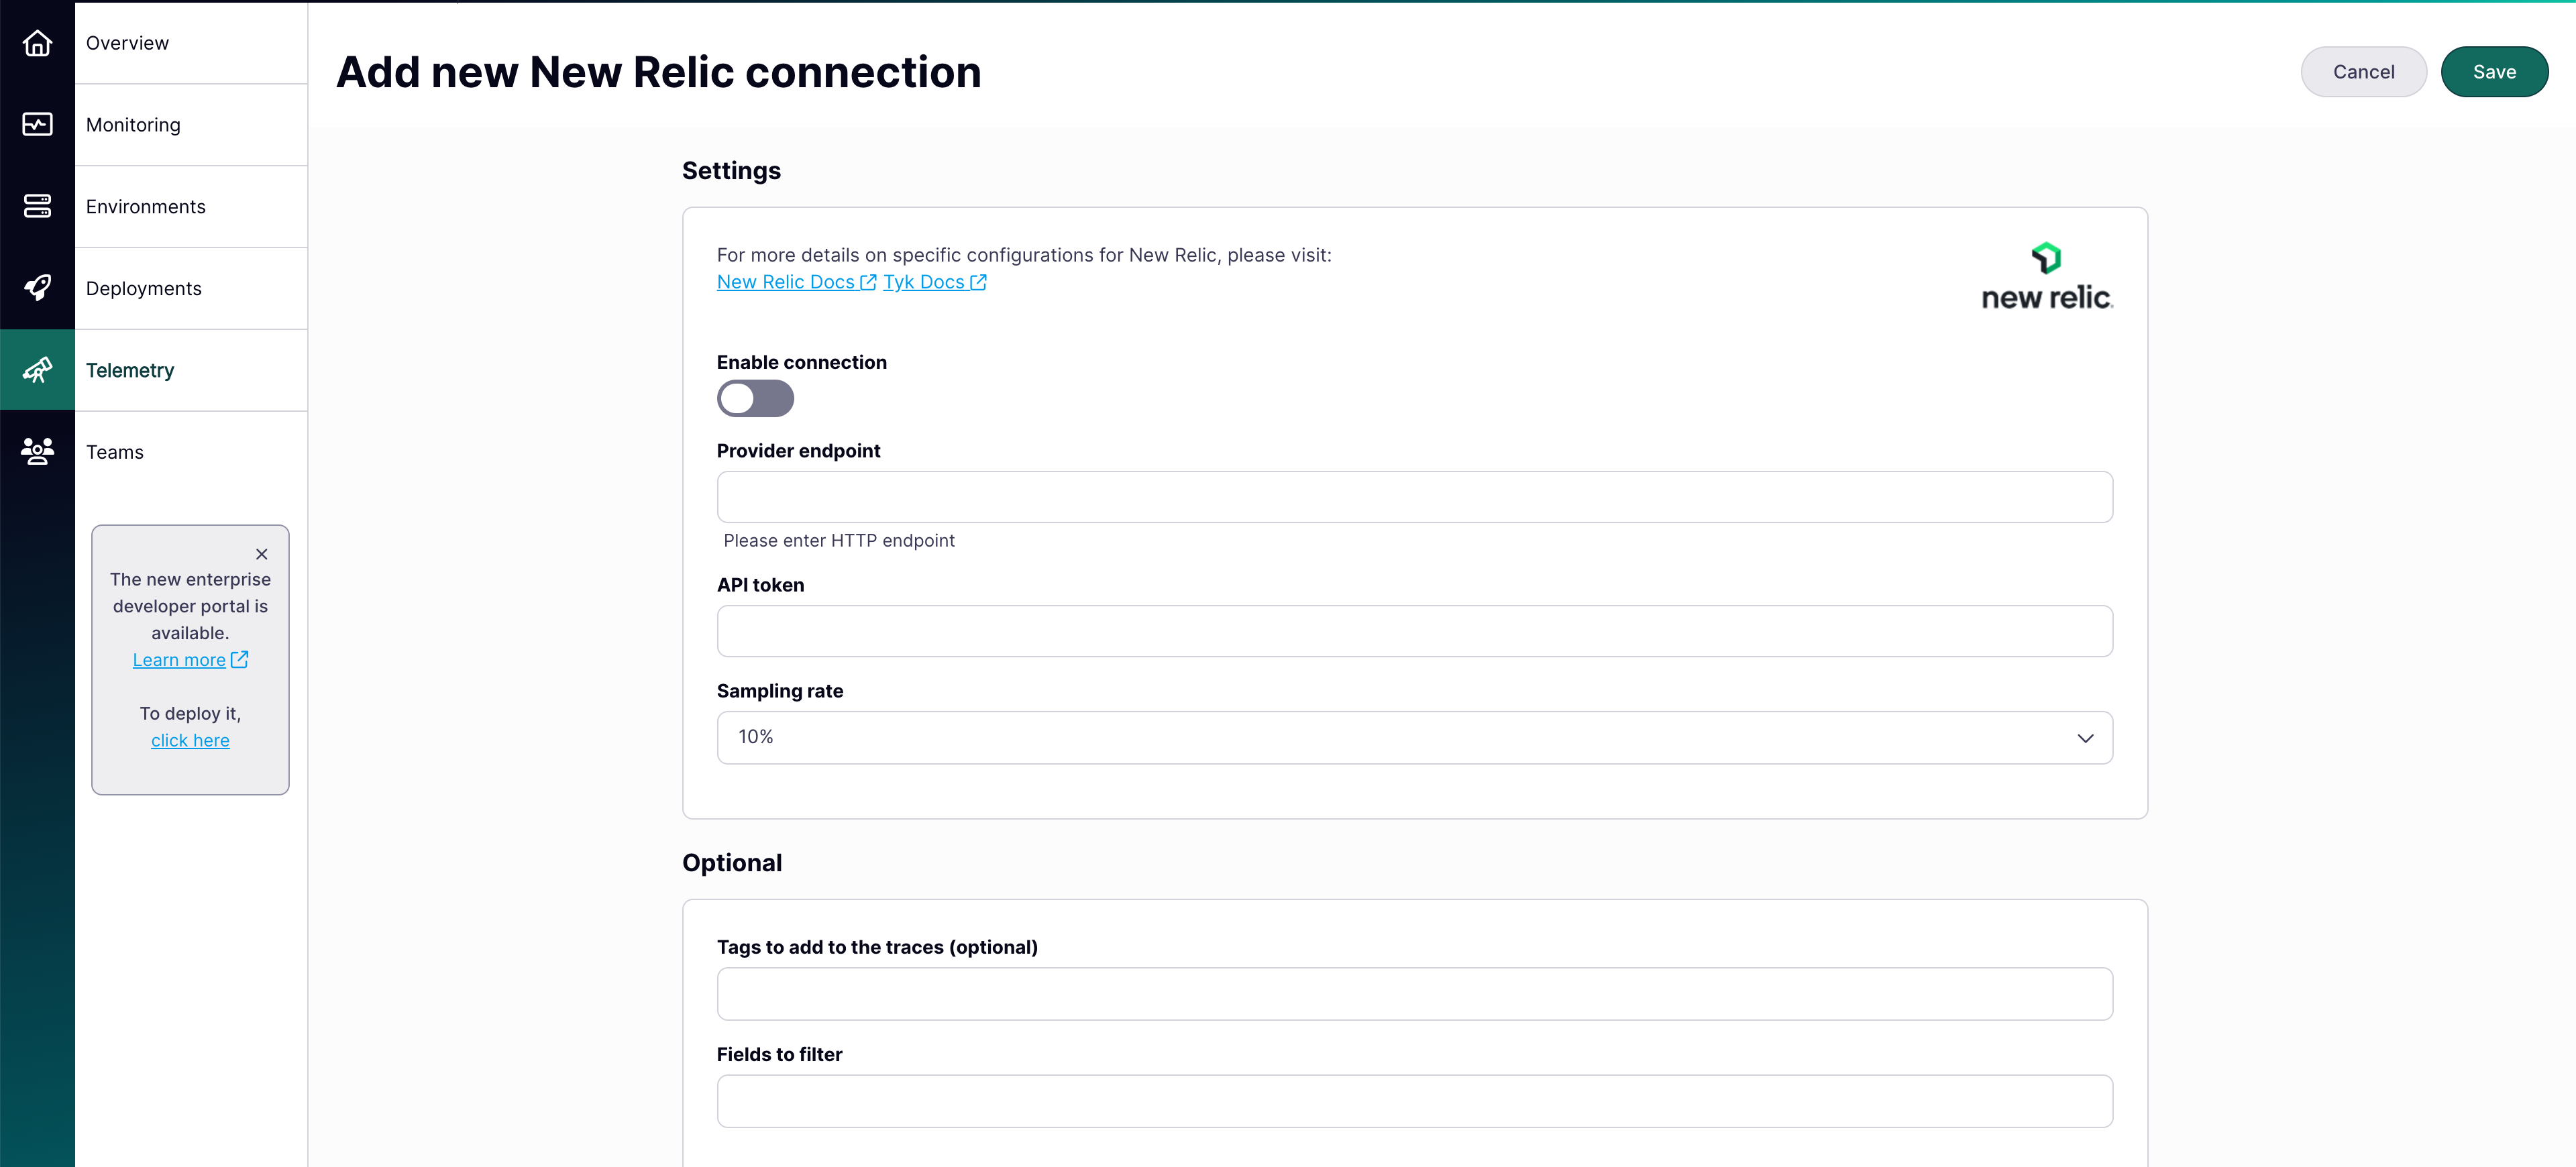
 * **Provider Endpoint**: Your New Relic HTTP endpoint. See [New Relic endpoint documentation](https://docs.newrelic.com/docs/opentelemetry/best-practices/opentelemetry-otlp/#configure-endpoint-port-protocol).
* **API Token**: Your New Relic license key. See [New Relic API key documentation](https://docs.newrelic.com/docs/apis/intro-apis/new-relic-api-keys/).
```text theme={null}
Provider Endpoint: https://security-api.newrelic.com/security/v1
API Token: your-newrelic-api-key
```
* **Provider Endpoint**: Your New Relic HTTP endpoint. See [New Relic endpoint documentation](https://docs.newrelic.com/docs/opentelemetry/best-practices/opentelemetry-otlp/#configure-endpoint-port-protocol).
* **API Token**: Your New Relic license key. See [New Relic API key documentation](https://docs.newrelic.com/docs/apis/intro-apis/new-relic-api-keys/).
```text theme={null}
Provider Endpoint: https://security-api.newrelic.com/security/v1
API Token: your-newrelic-api-key
```
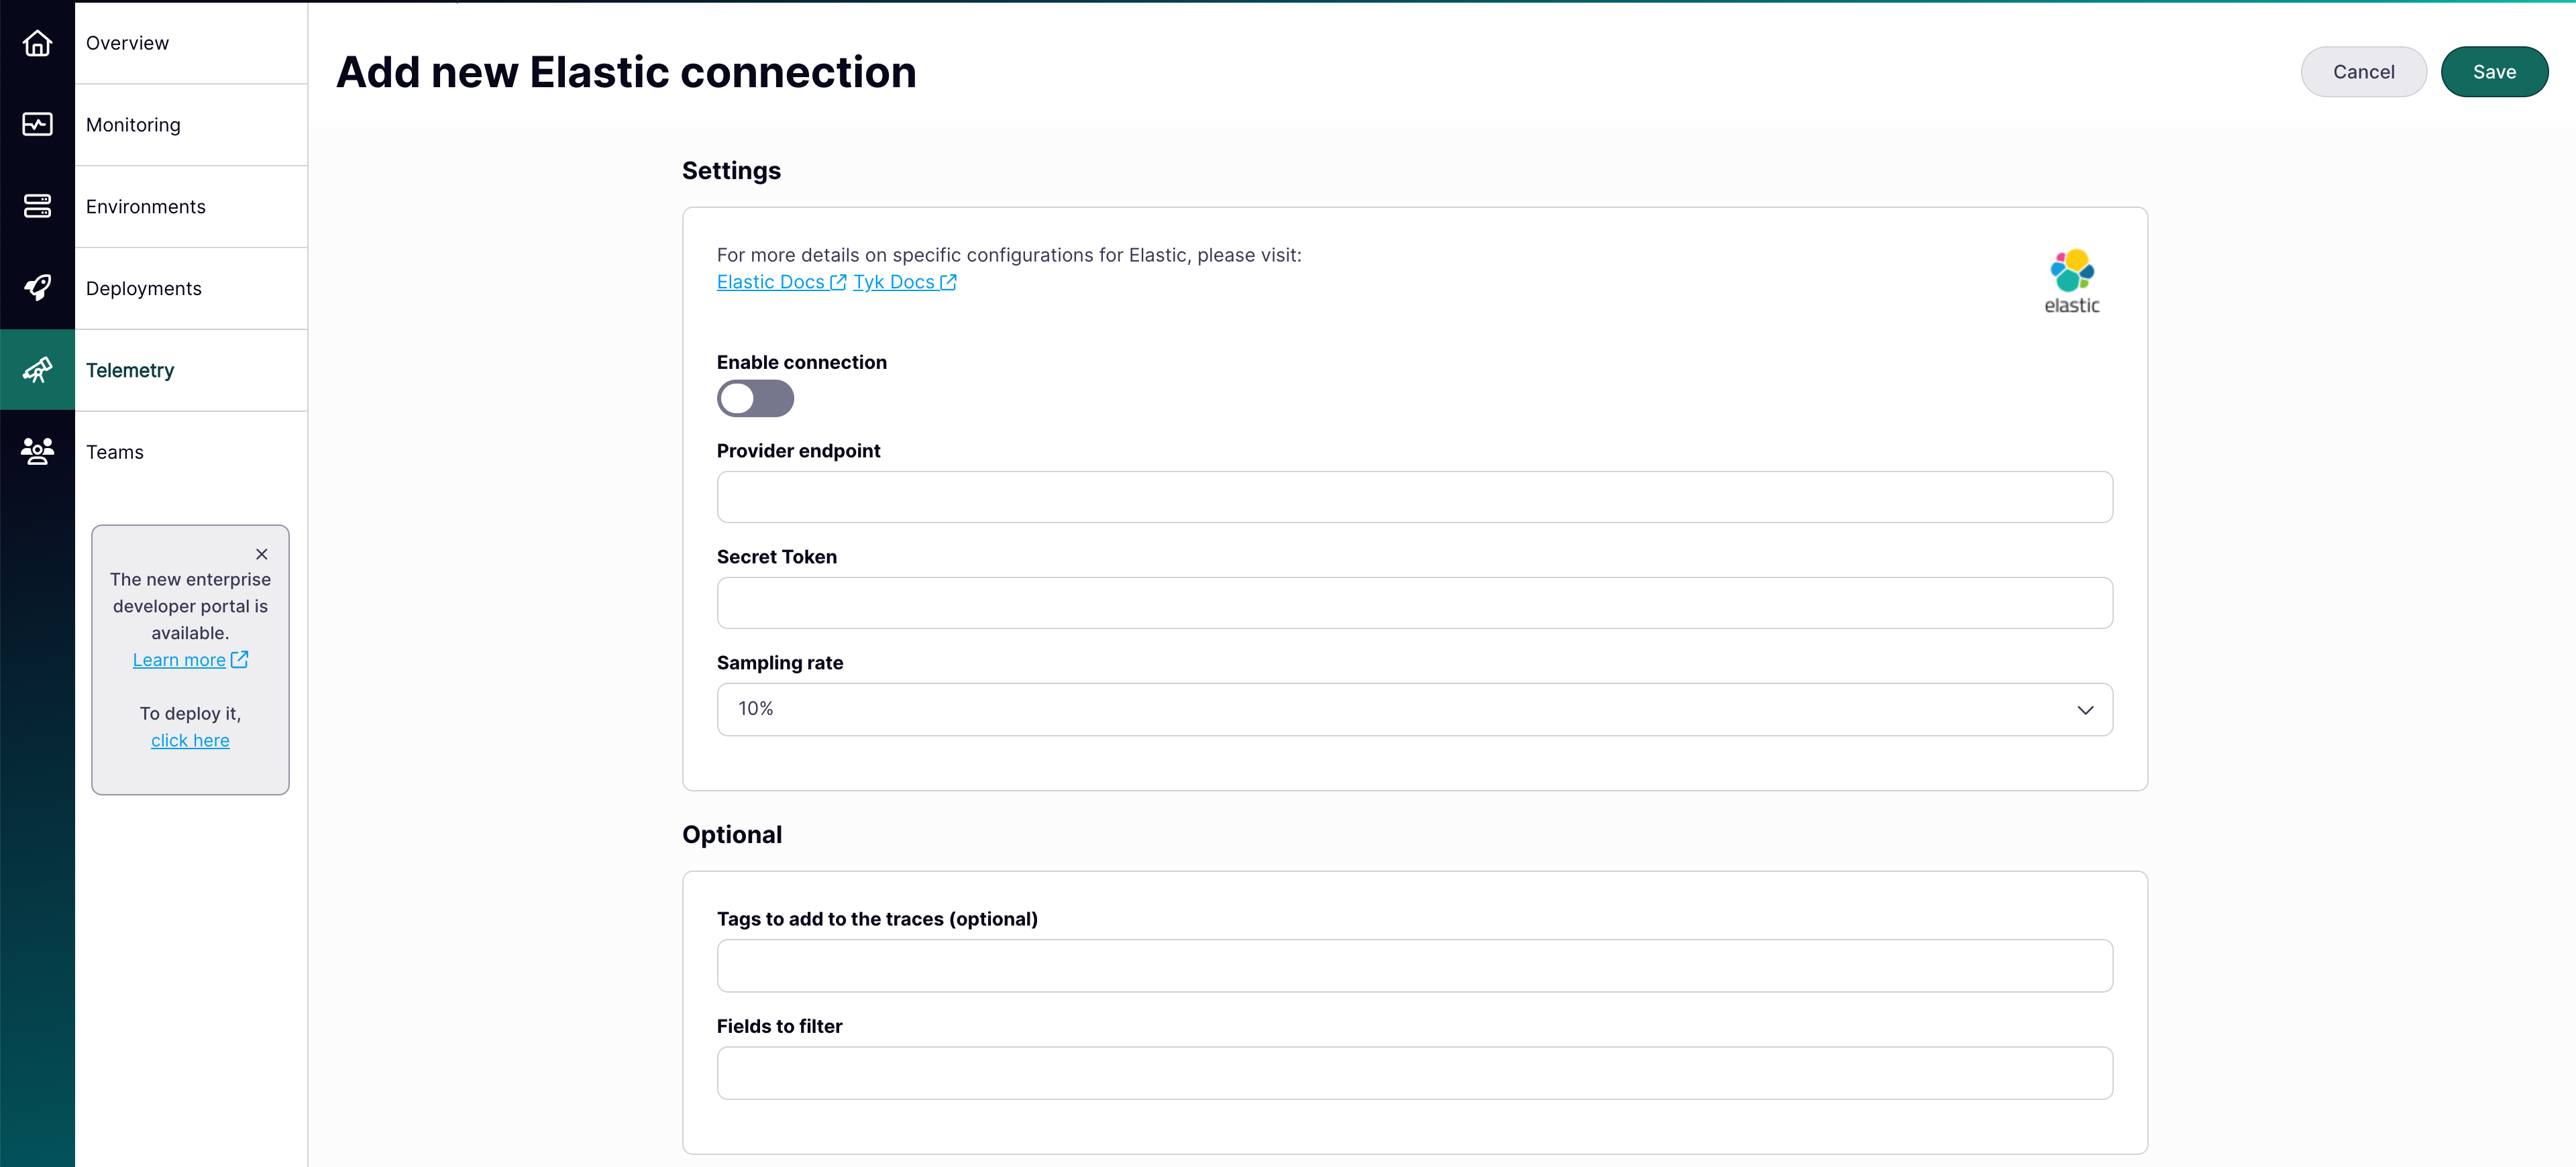
 * **Provider Endpoint**: Your Elastic APM server address.
* **Secret Token**: Your Elastic APM authentication token. See [Elastic secret token documentation](https://www.elastic.co/guide/en/observability/current/apm-secret-token.html#apm-create-secret-token).
```text theme={null}
Provider Endpoint: https://your-elastic-cluster:8200
Secret Token: your-elastic-secret-token
```
* **Provider Endpoint**: Your Elastic APM server address.
* **Secret Token**: Your Elastic APM authentication token. See [Elastic secret token documentation](https://www.elastic.co/guide/en/observability/current/apm-secret-token.html#apm-create-secret-token).
```text theme={null}
Provider Endpoint: https://your-elastic-cluster:8200
Secret Token: your-elastic-secret-token
```
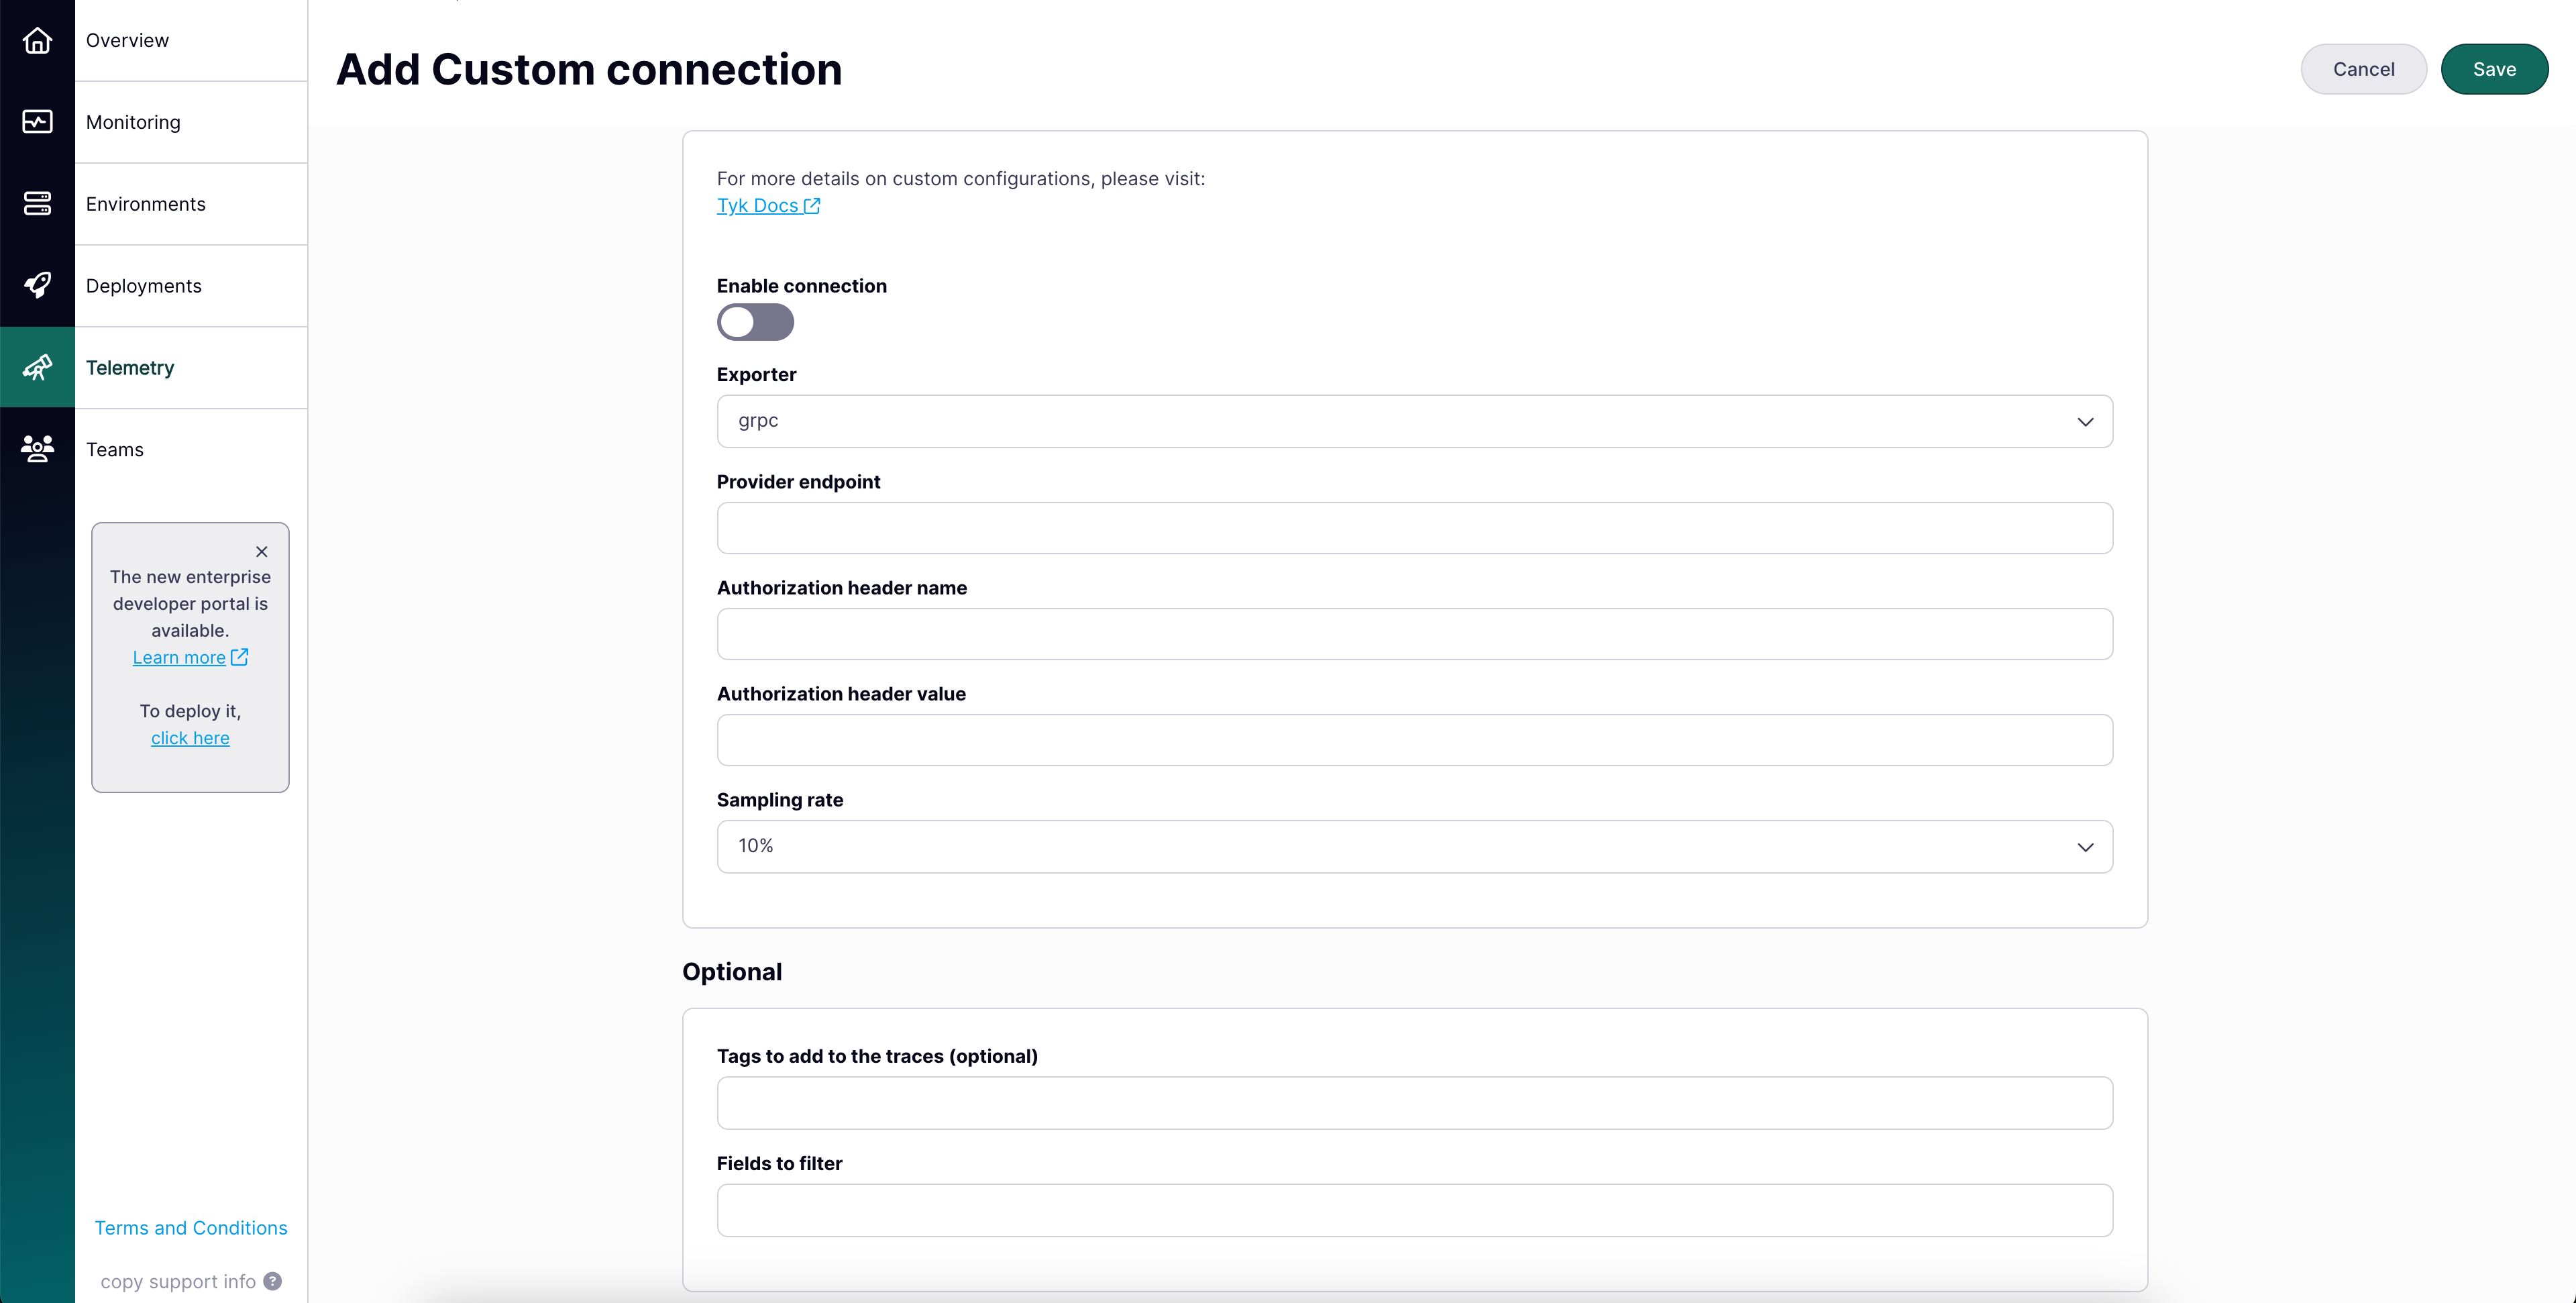
 * **Exporter**: Choose gRPC or HTTP.
* **Provider Endpoint**: Your monitoring system URL.
* **Authorization**: Configure authentication for your monitoring system.
```text theme={null}
Exporter: gRPC
Provider Endpoint: grpc://your-collector:4317
Authorization Header Name: Authorization
Authorization Header Value: Bearer your-token
```
* **Exporter**: Choose gRPC or HTTP.
* **Provider Endpoint**: Your monitoring system URL.
* **Authorization**: Configure authentication for your monitoring system.
```text theme={null}
Exporter: gRPC
Provider Endpoint: grpc://your-collector:4317
Authorization Header Name: Authorization
Authorization Header Value: Bearer your-token
```
 ### Step 2: Enable telemetry export on a Cloud Data Plane
Changes to telemetry settings require a Cloud Data Plane redeployment to take effect.
1. Navigate to your Cloud Data Plane deployment (create new or edit existing).
2. In the telemetry export section, enable the types you want:
### Step 2: Enable telemetry export on a Cloud Data Plane
Changes to telemetry settings require a Cloud Data Plane redeployment to take effect.
1. Navigate to your Cloud Data Plane deployment (create new or edit existing).
2. In the telemetry export section, enable the types you want:
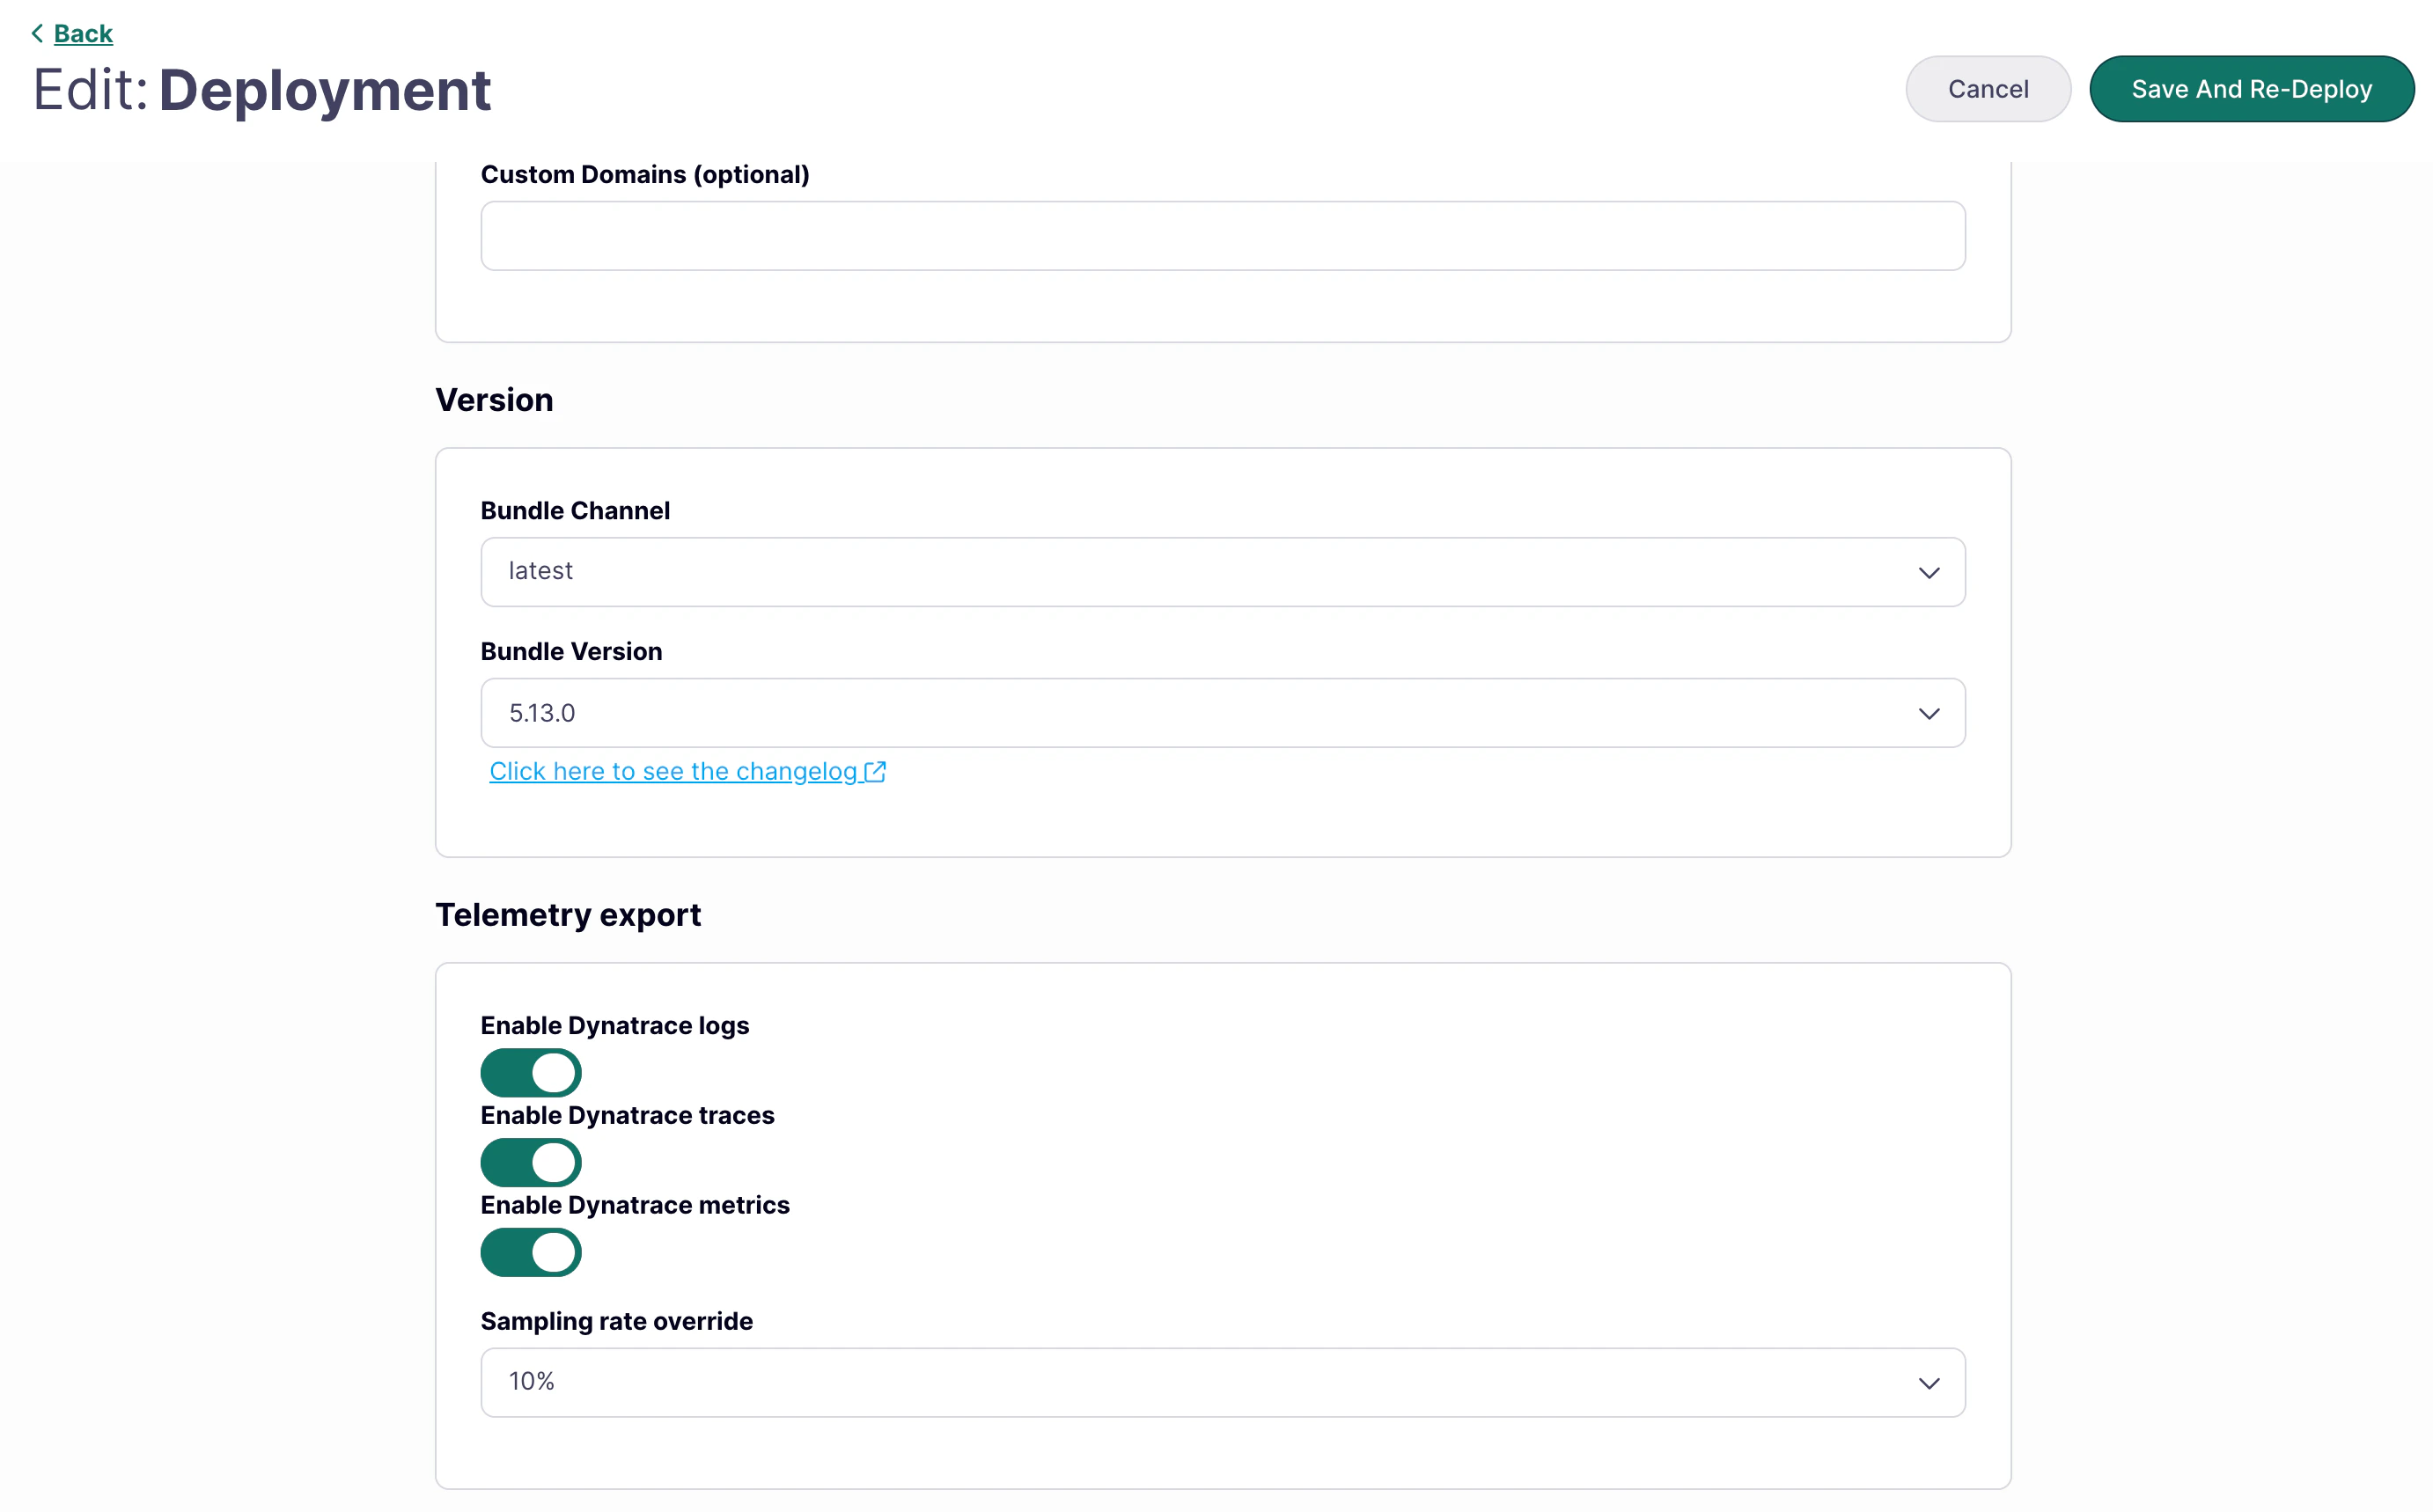 * **Enable Traces**: Enable distributed tracing.
* **Enable Metrics**: Enable gateway metrics export (requires Gateway v5.13.0 or later). See [Default Metrics Exported](#default-metrics-exported) for what is included.
* **Enable Logs**: Enable real-time application log streaming.
3. If traces are enabled, optionally set a **Sampling Rate Override** to control what percentage of trace data to export (default: 10%). This setting applies to traces only — not metrics or logs.
The sampling rate can be set at the organization level and overridden per Cloud Data Plane. The Cloud Data Plane setting takes precedence.
4. Save and redeploy the Cloud Data Plane.
5. In the deployment overview, confirm that **Telemetry Export** shows as enabled:
* **Enable Traces**: Enable distributed tracing.
* **Enable Metrics**: Enable gateway metrics export (requires Gateway v5.13.0 or later). See [Default Metrics Exported](#default-metrics-exported) for what is included.
* **Enable Logs**: Enable real-time application log streaming.
3. If traces are enabled, optionally set a **Sampling Rate Override** to control what percentage of trace data to export (default: 10%). This setting applies to traces only — not metrics or logs.
The sampling rate can be set at the organization level and overridden per Cloud Data Plane. The Cloud Data Plane setting takes precedence.
4. Save and redeploy the Cloud Data Plane.
5. In the deployment overview, confirm that **Telemetry Export** shows as enabled:
 ## Default Metrics Exported
When metrics are enabled, Tyk exports the following RED (Rate, Error, Duration) metrics by default:
| Metric | Description | Example Values |
| ---------------------- | ------------------------------- | ------------------------------ |
| **HTTP Method** | HTTP method used in the request | `GET`, `POST`, `PUT`, `DELETE` |
| **API ID** | Unique identifier of the API | `api-12345` |
| **HTTP Response Code** | HTTP status code returned | `200`, `404`, `500` |
Metrics are exported using OpenTelemetry's cumulative temporality model, which tracks the total count of events over time.
Metric customization (additional dimensions, filtering) is not self-service. Submit a support request at [support.tyk.io](https://support.tyk.io/) to configure custom dimensions.
Custom metric dimensions can significantly increase cardinality, which affects gateway memory usage and your observability platform's storage costs.
## Default Metrics Exported
When metrics are enabled, Tyk exports the following RED (Rate, Error, Duration) metrics by default:
| Metric | Description | Example Values |
| ---------------------- | ------------------------------- | ------------------------------ |
| **HTTP Method** | HTTP method used in the request | `GET`, `POST`, `PUT`, `DELETE` |
| **API ID** | Unique identifier of the API | `api-12345` |
| **HTTP Response Code** | HTTP status code returned | `200`, `404`, `500` |
Metrics are exported using OpenTelemetry's cumulative temporality model, which tracks the total count of events over time.
Metric customization (additional dimensions, filtering) is not self-service. Submit a support request at [support.tyk.io](https://support.tyk.io/) to configure custom dimensions.
Custom metric dimensions can significantly increase cardinality, which affects gateway memory usage and your observability platform's storage costs.