Gateway
-
Users receive 499 error in the Gateway
Cause The Gateway receives closed client responses from the upstream client. There are number of different configuration settings that could bring about this issue. Solution For a standard web app, used by standard HTTP clients 499 errors are not a problem. However, in some specific cases, depending on the service you provide, your clients can have their own fixed constraints. For example, if you are building an API used by IoT devices, and those devices internally have a strict 2 second timeout for HTTP calls and your service responding with > 2 seconds. In this case a lot of 499 errors may mean that a lot of clients are malfunctioning, and you should investigate this behavior. On the other hand, sometimes a client closing the connection before reading the server response is expected functionality. Taking the same example as above, you may have some IoT sensor, which just pushes data to your servers in “fire and forgot” mode, and does not care about the server response. In this case a 499 error is completely expected behavior. -
Users receive 502 error in the Gateway
Cause The Gateway received an invalid response from the upstream server. There are number of different configuration settings that could bring about this issue. Solution Try using the following settings in your tyk.conf file:And the following key-value pairs should be set in the relevant API definition:See Tyk Gateway configuration and Tyk Gateway API for further information regarding API definition settings. -
Gateway proxy error “context canceled”
In some cases you can see “proxy error: context canceled” error message in the Gateway logs. The error itself means that the connection was closed unexpectedly. It can happen for various reasons, and in some cases it is totally fine: for example client can have unstable mobile internet. When it happens on the high load, it can be a lot of different reasons. For example your OS is running out of system limits, like number of opened sockets, and to validate it, you need to try your system limits. See this guide. Additionally, it can be CPU bottleneck: you can’t process more than your machine can do. And note that it is not only about the actual utilization %, it is also about context switches it has to do. E.g. having one job which consume 100% of your CPU/cores vs having a few thousands jobs, causing CPU constantly switch between them. Such problems cause internal request processing queues, which cause latency growth (highly recommend measure it). And in some cases latency can grow so big, that some clients can just disconnect/timeout because of it. Additionally, highly recommend read the following blog post https://tyk.io/blog/performance-tuning-your-tyk-api-gateway/. For example, you can trade memory for performance, and context switch reduction by tuning garbage collector to run less frequently: seeTuning Tyk’s Garbage Collectorsection. Also note that it is not Tyk or Golang specific. The problem described above will happen with any webserver on high scale. So in general if you see a lot of “context” errors on high load, use it as a sign that the process is really struggling with the given load, and you need scale it up, either vertically or horizontally. -
Invalid memory address or nil pointer dereference error
Cause There are a number of reasons, most commonly, an API may have been configured incorrectly in some way (for instance, it may have been set up without an organization). The error itself is a specific to Go language which Tyk was written in and could also suggest that alterations made to the code by the user could also be the culprit. Solution Make sure that API definitions are set up correctly. Information on how to do this with the Tyk Gateway API can be found in the following links: -
Users receive this error message when attempting to make API calls to an existing key.
Cause When the token was created, most probably it was configured without themeta_datakey. Solution The user will need to add the key-value pairmeta_data: {}to their key as per the Tyk Gateway REST API Documentation. -
There was a problem proxying the request
Cause The upstream server may have returned an empty response or cut the response off early so it was unable to complete the proxying process. A proxy error means actual connectivity issues between Tyk and the target host (i.e., a connection-level issue with the downstream server misbehaving for some reason). Expired TLS certificates may also cause issues. Solution Users are advised to upgrade to the latest versions of any Tyk packages at their earliest convenience as a patch was released to resolve this issue. Packages are available to download from Packagecloud.io. See Upgrading Tyk for details on upgrading to the latest version. It may also be worth checking if any TLS certificates associated with the domain have expired. -
Tyk Gateway Profiling
In some cases, to identify tricky issues like concurrency or memory related issues, it may be required to get information about the Gateway process runtime. For example, memory or CPU usage details. The Tyk Gateway is built using Go, and inherits its powerful profiling tools, specifically Google’spprof. The Tyk Gateway can generate various profiles in thepprofsupported format, which you can analyze by yourself, using thego tool pprofcommand, or you can send the profiles to our support team for analysis. There are two way to get profiles:-
Running the process with flags mentioned below which will gather information about the running process for the first 30 seconds, and will generate files containing profiling info:
--memprofile- memory profile, generatestyk.mproffile--cpuprofile- CPU usage profile, generatestyk.proffile--blockprofile- Blocking profile, generatestyk.blockproffile--mutexprofile- Mutex profile, generatestyk.mutexproffile
-
Running with the
--httpprofileflag, or setenable_http_profilertotruein tyk.conf, which will run a special/debug/pprof/public web page, containing dynamic information about the running process, and where you can download various profiles:- goroutine - stack traces of all current goroutines
- heap - a sampling of all heap allocations
- threadcreate - stack traces that led to the creation of new OS threads
- block - stack traces that led to blocking on synchronisation primitives
- mutex - stack traces of holders of contended mutexes
-
Running the process with flags mentioned below which will gather information about the running process for the first 30 seconds, and will generate files containing profiling info:
Support Information
When contacting support, you may be asked to supply extra information and supply log files, etc, so we can quickly handle your request. Questions may include:- “Can you send us your log files”
- “Can you change the logging detail level”
- “What version of Tyk are you on”
- “What profiling information can I get”
stderr and stdout. In a typical installation, these will be handled or redirected by the service manager running the process, and depending on the Linux distribution, will either be output to /var/log/ or /var/log/upstart.
Tyk will try to output structured logs, and so will include context data around request errors where possible.
How do I increase Logging Verbosity?
You can set the logging verbosity in two ways:
- Via an Environment Variable to affect all Tyk components
- Just for the Gateway via your
tyk.confconfig file
TYK_LOGLEVEL.
By default, the setting is info. You also have the following options:
debugwarnerror
tyk.conf by adding the following:
info. You also have the following options:
debugwarnerror
-
Since Gateway version
5.0.8or5.2.3you can inspect detailed build information by runningtyk version. The information also includes the Go version it was built with, the operating system and architecture. -
If you’re running an an older version than the above,
tyk --versionprints out the release version for your Gateway binary.
/opt/tyk-gateway/tyk by default. If your binary is not available in your PATH environment, invoke it from there.
Profile Information
You can provide various profile information for us in pprof format. See Gateway Profiling for more details.
-
API definition URL case sensitive
For security reasons Tyk lowercases the URL before performing any pattern matching. -
Gateway detected 0 APIs
Tyk Gateway is not able to get API configs from the Tyk Portal. If you configured your Gateway to be segmented, you would also need to assign tags and you must also tag the APIs in the API Designer to make sure that they load.- In the Pro edition that is a connectivity or misconfiguration issue
- In the Community edition, since you are not using the Dashboard we assume that you use file-based APIs , so in this case it’s because API definition files are missing.
-
How to import existing keys into Tyk CE
You can use an API to import existing keys that were not created in Tyk into Tyk’s Gateway. This doc explains how to do that with the Gateway’s APIs directly. This example uses standardauthorizationheader authentication, and assumes that the Gateway is located at127.0.0.1:8080and the Tyk secret is352d20ee67be67f6340b4c0605b044b7- update these as necessary to match your environment. To import a key calledmycustomkey, save the JSON contents astoken.json(see example below), then run the following Curl command: The Exampletoken.jsonfileThe import of the key to Tyk:Test the key after the import:See also the Keys section of the Tyk Gateway API documentation. -
Redis persistence using containers
Use case: Keep my data persistent at Docker container restart The Multi-Cloud Redis container is ephemeral, it isn’t configured for persistence because it would very quickly get very large (Docker containers in general should really be considered as ephemeral). If using Redis with Multi-Cloud we strongly recommend using an external Redis database. There are no settings for Redis available via environment variable, you would need to mount a newredis.confinto the container to customize the configuration, but again, we don’t recommend it. -
DRL not ready, skipping this notification
Description You see the followingLog Warning:DRL not ready, skipping this notificationCause There can be a couple of reasons for seeing this error about the Distributed Rate Limiter:- When you have more than one installation of the Gateway with one configured to use DRL, and others not.
- When the Gateway is started and the DRL receives an event before it has finished initialising.
-
”Index out of range“ error in logs
Description Redis cluster users receive the aforementioned error message in their logs. The log stack may resemble the following:Cause This is due to a bug that prevents the driver from picking up a random redis handle in single-instance connections such as pub/sub. The issue affects later patch releases of Tyk 2.2 and the first release of Tyk 2.3. Solution Users are advised to upgrade to the latest versions of any Tyk packages as a patch was released to resolve this issue. Packages are available to download from Packagecloud.io and further details on how to upgrade can be found here. -
Hot restart a Tyk Gateway Process
It is possible to hot-restart a Tyk Gateway process without dropping any connections. This can be useful if you need to load up a new configuration or change a configuration on a production server without losing any traffic. To hot-restart a Tyk Gateway process, you simply need to send aSIGUSR2signal to the process, for example:This will fork and load a new process, passing all open handles to the new server and wait to drain the old ones. -
How to add Custom Certificates to Trusted Storage of Docker Images
To add your custom Certificate Authority(CA) to your docker containers. You can mount your CA certificate directly into/etc/ssl/certsfolder. Docker:Kubernetes - using Helm Chart and secrets: -
How to change the logging output location
It’s not possible to segregate out the error locations in thetyk.conf, but you can modify the actual initialisation files to specify the log location, we supply initialisation scripts forSysV,systemdandupstart. -
How to clear / invalidate API cache
Use the REST API to clear the cache OSSTyk Dashboard -
How to find the Gateway logging output
You are able to see a more detailed output in your Gateway log/var/logor/var/log/upstart. -
Gateway
proxy_default_timeoutvshttp_server_options.write_timeoutTyk to Upstream timeoutproxy_default_timeoutspecifies the amount of time that Tyk will wait for the upstream service to complete its reply to Tyk With gateways prior to release 5.0.7proxy_default_timeoutdefaulted to zero which would result in the gateway waiting forever. This consumed resources and could lead to depletion of ephemeral sockets. Since gateway 5.0.7proxy_default_timeoutdefaults to 30 seconds. When increasingproxy_default_timeoutbeyond 120 seconds it is necessary to consider the client to Tyk timeouts. Client to Tyk timeoutshttp_server_options.write_timeoutspecifies the number of seconds that Tyk will keep the client connection open for Tyk to write to it. If this is less thanproxy_default_timeoutthen the connection to the client will be closed and the upstream reply will not be proxied back to the client if the upstream takes longer thanhttp_server_options.write_timeoutseconds. To avoid this please make sure thathttp_server_options.write_timeoutis at least 1 second longer thanproxy_default_timeouthttp_server_options.read_timeoutspecifies that number of seconds that Tyk will allow the client to complete sending the request to it. This usually doesn’t need to be changed since a lot of data can be sent in the default of 120 seconds, but it can be changed if needed.
Gateway Error Response Status Codes
Tyk Gateway responses include HTTP status codes that follow the HTTP status code standard. They have three digits that describe the result of the request and the semantics of the response. The first digit defines the class of response as shown in the list below:- 1xx (Informational): The request was received, continuing process
- 2xx (Successful): The request was successfully received, understood, and accepted
- 3xx (Redirection): Further action needs to be taken in order to complete the request
- 4xx (Client Error): The request contains bad syntax or cannot be fulfilled
- 5xx (Server Error): The server failed to fulfill an apparently valid request
Dashboard
-
Can’t update policy. Please ensure at least one access rights setting is set
Description Users receive this error when attempting to create a new Policy on the Dashboard. Cause The Access Rights field is a required setting for a policy. Solution Users should first create a new API and then create a new policy with an existing API in the Access Rights. -
Dashboard not showing any analytics data
Description The user is unable to see analytics data from a particular time period in the Dashboard Cause Missing analytics data could be caused by a number of different reasons:- Gateway incorrectly configured
- Pump incorrectly configured
- Pump service not running
- Dashboard incorrectly configured
- MDCB incorrectly configured
- Browser caching stale data
tyk.confhas:enable_analyticsset totrue. This sets the Gateway to record analytics data.analytics_config.storage_expiration_timeset to a value larger than the Pump’spurge_delay. This allows the analytics data to exist long enough in Redis to be processed by the Pump.analytics_config.ignored_ipsset to[]. This ensures the Gateway will create analytics for requests from any IP address.enforce_org_data_ageset tofalse. This prevents the data from being removed based on it reaching a certain age.
pump.confhas:analytics_storage_typeset toredis.analytics_storage_configsettings are set to the same Redis instance that the Gateway is connected to.
tyk_analytics.confhas:mongo_urlset to the same MongoDB instance that the Pump is connected to.
sink.confhas:analytics.mongo_urlset to the same MongoDB instance that the Dashboard is connected to.forward_analytics_to_pumpset to the correct value for your solution.falseif MDCB is directly recording the analytics itself,trueif it is forwarding analytics data for the Pump to process. For the forwarding scenario, set thestoragesettings to the same Redis instance that the Pump is connected to.
The query gets all aggregated analytics data from the date provided, so if you set it to yesterday you will get all data since yesterday. The data must be in the ISO format. -
Fatal - Dashboard and portal domains cannot be the same
Description The Tyk Dashboard service will not start and displays a fatal error as follows:Cause Tyk’s developer portal UI needs to run on either a different subdomain or different domain name to the dashboard UI. Tyk’s Dashboard service may be run in a multi-tenant configuration, and each tenant may have their own developer portals. The Dashboard service determines which portal to load based on theHostheader in the request by the browser. If this conflicts with the hostname of the dashboard UI the dashboard service will not know whether to serve the dashboard or developer portal. Solution Firstly, we will need to disable hostnames from within the Dashboard configuration file in order to get the dashboard service started again. Changehost_config.enable_host_namesfromtruetofalseYou should now be able to start the Dashboard service. Navigate to the Dashboard via it’s public IP address and log-in. Change your portal domain to something different - e.g.portal.tyk-dashboard.comEdit the Dashboard configuration file to re-enable host names. Restart the Dashboard service. -
Internal TIB SSO User unable to log in
Description After creating an SSO Identity profile in the Tyk Dashboard, a user is unable to log in to the Dashboard or the Developer Portal Cause One potential cause is that theDashboardCredentialsetting has not been populated with the user’s Tyk Dashboard API Access Credentials. You can check this from:- From the Dashboard menu, select the Identity Management option
- Edit the profile you created
- Select the Raw Editor
- Check to see if the
DashboardCredentialsetting is set
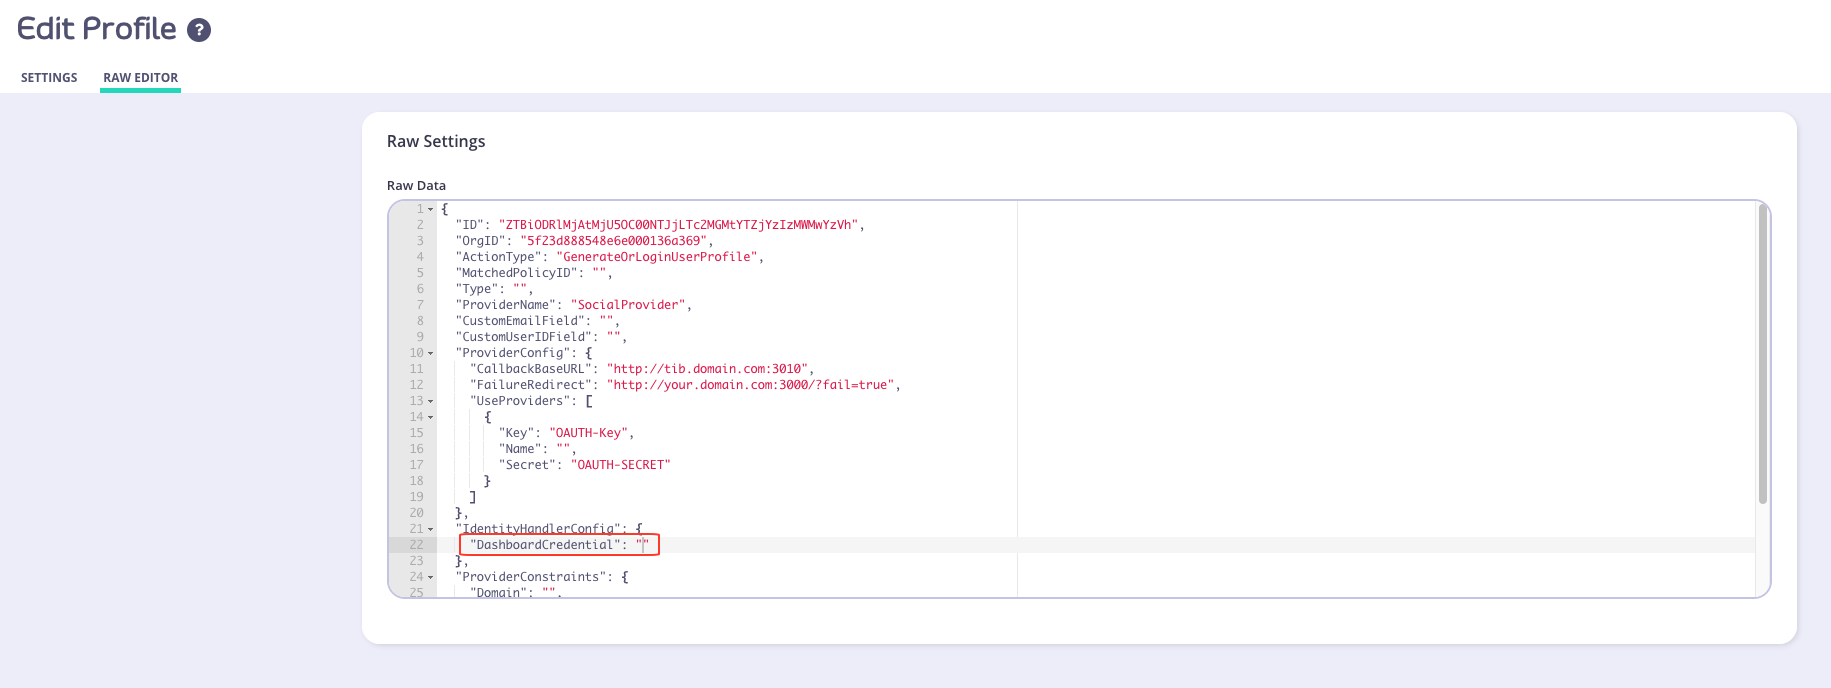
DashboardCredentialsetting is empty ("DashboardCredential": ""), you can manually add the user’s Tyk Dashboard API Access Credentials by performing the following:- From the System Management > Users menu, select Actions > Edit from the user whose credentials you want to use
- Copy the Tyk Dashboard API Access Credentials value
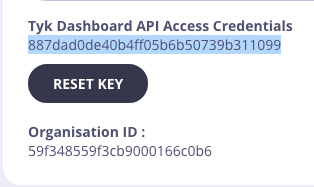
- Paste this into the Raw editor for the
DashboardCredentialsetting. For example -"DashboardCredential": "887dad0de40b4ff05b6b50739b311099" - Click Update
- The user should now be able to log in to the Dashboard/Portal
This issue is due to be fixed in an up coming release -
Key object validation failed, most likely malformed input error
Description The user is getting error asKey object validation failed, most likely malformed inputwhen calling the Dashboard API. Cause Issue caused by invalid character passed in the JSON body of the request. Solution Validate the JSON using JSON validator. Further, please see this community forum post for additional guidance. -
Port 5000 Errors in the Browser Console
NOTE: Port 5000 is no longer required from v2.9.3.
Description You see a lot ofnet::ERR_CONNECTION_REFUSEDerrors in the browser console. Cause The Dashboard is trying to connect tohttps://<Your Dashboard URL>:5000/socket.io/?chan=ui_notificationsand you don’t have port 5000 open. Solution Port 5000 is used for WebSocket connections for real-time Dashboard notifications. You can change the port by changing the defaultnotifications_listen_portin yourtyk_analytics.conf. Otherwise you can ignore the errors in the browser console.
Port 5000 is only required if you need to enable the Tyk Gateway log viewer.
-
There was a problem updating your CNAME“ error in the Dashboard
Description A user may find that they are unable to update a CNAME from within the Dashboard. The following error will appear in a pop-up:Cause The UI for setting the domain name has a very strict validation, so it may just be rejecting this domain. Solution The best way to set the domain is to use the Tyk Dashboard Admin API, to obtain the organization object via a GET request and then update the object using a PUT request with the relevant CNAME added to the body of the request.[1] Restarting the process will then set the domain. -
runtime error invalid memory address or nil pointer dereference
Description When attempting to POST an OAuth Client to a newly generated API, user may receive the following stack trace:Cause The API that the OAuth Client has been POSTed to either doesn’t exist or hasn’t had a chance to propagate throughout the system. Solution When creating a new OAuth Client, make sure that API it is created under exists. If the API was created recently, please wait a few minutes before attempting to create an OAuth Client under it. -
ValueError No JSON object could be decoded” when running Dashboard Bootstrap script
Description Users receive the following error message when attempting to run the bootstrap script in their Tyk instance:Cause The bootstrap script requires a valid hostname and port number to generate a new login user. Solution Make sure that the correct hostname and port number used to run the bootstrap.sh script. An example command would be:./bootstrap.sh new-tyk-instance.com:3000 -
Dashboard bootstrap error
Make sure you: Target the correct domain with yourbootstrap.shas it is very specific once you set up a Dashboard service with hostname setHave checked the firewall rules in your instance and VPC to allow port 3000 access. -
How to find the policy ID for a created policy
Open the Active Policies page in the Dashboard (System Management > Policies) and click Edit next to the name of the policy you’ve created. The policy ID should appear in the URL of the edit page that opens up. -
How to Connect to DocumentDB with X.509 client cert
As AWS DocumentDB runs with TLS enabled, we require a way to run it without disabling the TLS verification. DocumentDB uses self-signed certs for verification, and provides a bundle with root certificates for this purpose, so we need a way to load this bundle. Additionally DocumentDB can’t be exposed to the local machine outside of the Amazon Virtual Private Cloud (VPC), which means that even if verification is turned on, it will always fail since if we use a SSH tunnel or a similar method, the domain will differ from the original. Also, it can have Mutual TLS enabled. So, in order to support it, we provide the following variables for both our Tyk Analytics Dashboard and Tyk Pump:mongo_ssl_ca_file- path to the PEM file with trusted root certificatesmongo_ssl_pem_keyfile- path to the PEM file which contains both client certificate and private key. This is required for Mutual TLS.mongo_ssl_allow_invalid_hostnames- ignore hostname check when it differs from the original (for example with SSH tunneling). The rest of the TLS verification will still be performed.
Capped Collections If you are using DocumentDB, capped collections are not supported. See here for more details. -
How to disable an API
You will need to GET the API from the Dashboard, then setactiveproperty tofalse, then PUT it back. See Dashboard API - API Definitions for more details on how to GET and PUT an API definition. -
How to Setup CORS
Upstream service supports CORS If your upstream service supports CORS already then Tyk should ignore OPTIONS methods as these are pre-flights sent by the browser. In order to do that you should select Options passthrough, and NOT CHECK CORS in Tyk.-
If you not do allow OPTIONS to pass through, it will cause Tyk to dump the options request upstream and reply with the service’s response so you’ll get an error similar to
no 'access-control-allow-origin' header is present on the requested resource. - If you check CORS as well you’ll get an error similar to this:
This is because you have enabled CORS on the Api Definition and the upstream also supports CORS and so both add the header. Upstream does not handle CORS If your upstream does not handle CORS, you should let Tyk manage all CORS related headers and responses. In order to do that you should enable CORS in Tyk and NOT ENABLE Options pass through. To learn more, look forCORS.options_passthroughhere. CORS middleware is allowing headers which I did not allow This may be the case when you enable CORS but don’t provide any headers explicitly (basically providing an empty array). In this case the CORS middleware will use some sensible defaults. To allow all headers, you will need to provide*(although this is not recommended). The same can happen with Allowed Origins and Allowed Methods. Read more about it here. CORS middleware is blocking my authenticated request Please make sure that you did allow the authorization header name (e.g.Authorization) or else the request will be blocked by the CORS middleware. If you’re having trouble on the developer portal with authenticated requests make sure to also allow theContent-Typeheader. -
If you not do allow OPTIONS to pass through, it will cause Tyk to dump the options request upstream and reply with the service’s response so you’ll get an error similar to
-
No Key information on the Dashboard
Information relating to a given key doesn’t automatically appear in the Dashboard for users who have switched from a Self-Managed installation to a Multi-Cloud setup. The stats for a key will never update in the Cloud for a Multi-Cloud installation. The Dashboard in this mode only sets the initial “master” values for a key and those keys are then propagated across the Multi-Cloud instances that are using them (for example, you may have multiple zones with independent Redis DBs) at which point they diverge from each other. To see the up to date stats for a token, the key must be queried via the Gateway API. -
How to rename or move existing headers in a request
To rename a header, or to move a value from one header to another (for example, moving an authentication token to a secondary place, or copying a value that gets replaced upstream) is easy with context variables. Here is an example where we move the value ofX-Custom-Headerto a new header calledX-New-Custom-Headerin all requests. We do this by setting the following in our API Definition Version section:You can test the header with the following command. This assumes your API Authentication mode is set to open(keyless):You can also do this via the Dashboard from the Endpoint Designer tab within the API Designer: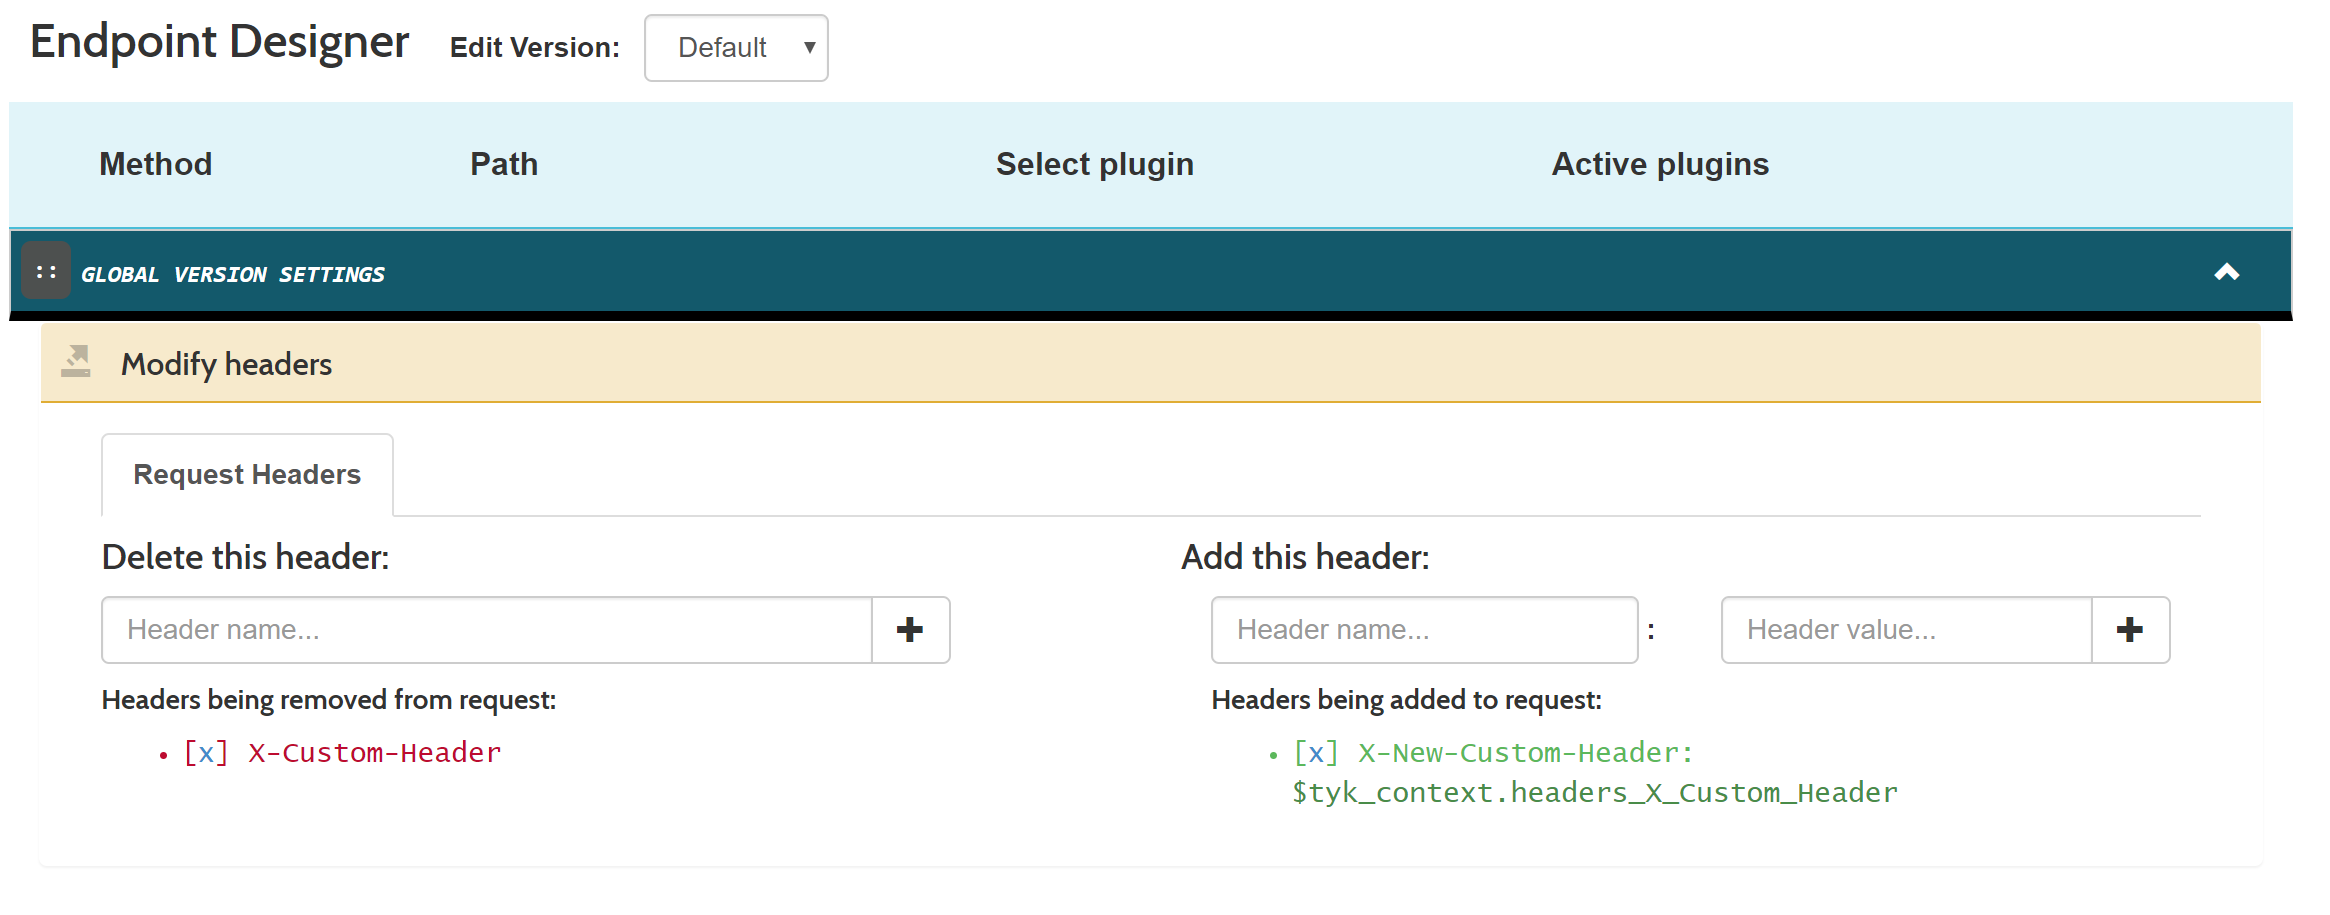
-
How to run the Dashboard and portal on different ports
Unfortunately its not possible to run the Dashboard and Portal on different ports, they must use the same port. -
How to run two Gateways with docker-compose
Managing a second Tyk Gateway with our Tyk Install is a case of mounting thetyk.conffile into a new volume and declaring a new Gateway service but exposed on a different port. You will need to make some minor modifications todocker-compose.ymland start your services as usual withdocker-compose up.Add the following toThis will only work with an appropriate license. The free license is for development purposes and would allow running Tyk’s licensed platform with only one Gateway. If you want to test Tyk with more please contact us by email info@tyk.io and we will be happy to discuss your case and PoC requirements as well as providing a short period license.docker-compose.yml(after thetyk-gatewaydefinition) -
“Payload signature is invalid!“ error
Description Users receive the error “Payload signature is invalid!” in their logs. Cause Users may not have enabled payload signatures in their settings after an upgrade. Solution See System Payloads for more details.
Pump
-
Capturing detailed logs
If you’ve seen the documentation for Tyk Dashboard’s log browser, then you’ll also be wondering how to set up your Tyk configuration to enable detailed request logging. What is detailed request logging? When detailed request logging is enabled, Tyk will record the request and response in wire-format in the analytics database. This can be very useful when trying to debug API requests to see what went wrong for a user or client. This mode is configured in the gateway and can be enabled at the system, API or access key level. You will also need your Tyk Pump configured to move data into your preferred data store. Disabling detailed recording for a particular pump In some cases, you don’t want to send the detailed request and response to a particular data store. In order to do that, you can setomit_detailed_recordingin your Tyk Pump configuration file totrue. This will disable the detailed logging for a specific pump. For example, if we have an ElasticSearch, Kafka and CSV stores, and you want to save the detailed recording in all of them except Kafka you can use the following configuration: Enable detailed analytics on the Gatewaytyk.confusing:- Configure each pump on
pump.conf. - Add the
omit_detailed_recordingvariable to the Kafka pump:
- Configure each pump on
-
Connection dropped, connecting…
Description Users may notice the following message in their logs for the Tyk Pump:Cause This is normal behavior for the Tyk Pump. Solution N/A -
Data Seen in Log Browser but No Reports
Description You can see data in the log browser but the rest of the reports display nothing. Solution If your Pump is configured to usemongo_selective_pump(e.g. store data in a collection per organization), ensure that the Dashboard configuration settinguse_sharded_analyticsis set totrue. The same applies in the reverse direction. If you are usingmongo-pump-aggregatein your pump configuration, setuse_sharded_analyticsto false. This is because you’ve enableduse_sharded_analyticsas per above and you’re using themongo-pump-aggregate, but you now also have to add amongo-pump-selectivein order to save individual requests to Mongo, which the Dashboard can read into the Log Browser. -
No Elasticsearch node available
Description Tyk Pump is configured to use Elasticsearch, but it does not work and showsno Elasticsearch node availablemessage in log.Cause Theelasticsearch_urlconfiguration property in thepump.confis missing the HTTP prefix e.g.Solution Ensure the HTTP prefix is present in theelasticsearch_urlconfiguration property e.g. -
Tyk Pump Panic “stack exceeds 1000000000-byte limit“
Description Users receive a the aforementioned error message in a stack trace in the Pump. Cause Users receive a the aforementioned error message in a stack trace in the Pump. Solution Users are advised to upgrade to the latest version of Tyk. They must also ensure that their Pump is configured with apurge_delayand anoptimisation_max_activevalue that’s greater than 0. Packages are available to download from Packagecloud.io and further details on how to upgrade can be found here -
Pump overloaded
Description The Tyk Pump cannot deal with amount of analytics data generated by the Gateway. This means the Pump is unable to process all the analytics data within the purge period. Cause If there is excessive analytics data, the pump may become overwhelmed and not able to move the data from Redis to the target data store. Solution There are many ways to approach solving this problem. Scale the Pump Scale the Pump by either increasing the CPU capacity of the Pump host or by adding more Pump instances. By adding more instances you are spreading the load of processing analytics records across multiple hosts, which will increase processing capacity. Disable detailed analytics recording Setanalytics_config.enable_detailed_recordingtofalsein the Gateway configuration filetyk.conf. Detailed analytics records contain much more data and are more expensive to process, by disabling detailed analytics recording the Pump will be able to process higher volumes of data. Reduce the Pump purge delay Setpurge_delayto a low value e.g.1in the Pump configuration filepump.conf. This value is the number of seconds the Pump waits between checking for analytics data. Setting it to a low value will prevent the analytics data set from growing too large as the pump will purge the records more frequently. Reduce analytics record expiry time Setanalytics_config.storage_expiration_timeto a low value e.g.5in the Gateway configuration filetyk.conf. This value is the number of seconds beyond which analytics records will be deleted from the database. The value must be higher than thepurge_delayset for the Pump. This will allow for analytics records to be discarded in the scenario that the system is becoming overwhelmed. Note that this results in analytics record loss, but will help prevent degraded system performance.
Streams
-
Failure to connect to the event broker
If Tyk Gateway is unable to establish a connection to the configured event broker (e.g., Kafka, MQTT), check the following:- Verify that the broker connection details in the Tyk Dashboard are correct, including the hostname, port, and any required credentials.
- Ensure that the event broker is running and accessible from the Tyk Gateway instance.
- Check the network connectivity between the Tyk Gateway and the event broker. Use tools like telnet or nc to validate the connection.
-
Messages are not being published or consumed
If messages are not being successfully published to or consumed from the event broker, consider the following:- Verify that the topic or queue names are correctly configured in the Tyk Dashboard and match the expected values in the event broker.
- Check the Tyk Gateway logs for any error messages related to message publishing or consumption. Adjust the log level to “debug” for more detailed information.
- Validate that the message format and schema match the expectations of the consumer or producer. Inspect the message payloads and ensure compatibility.
-
Async API performance is poor or connections are being throttled
If you observe performance issues or connection throttling with async APIs, consider the following:- Review the configured rate limits and quotas for the async API. Adjust the limits if necessary to accommodate the expected traffic.
- Monitor the resource utilization of the Tyk Gateway instances and the event broker. Ensure that there is sufficient capacity to handle the load.
- Consider scaling the Tyk Gateway horizontally by adding more instances to distribute the traffic load.
-
What are best practices of using Tyk Streams
- Use meaningful and descriptive names for your async APIs, topics, and subscriptions to improve readability and maintainability.
- Implement proper security measures, such as authentication and authorization, to protect your async APIs and restrict access to authorized clients only.
- Set appropriate rate limits and quotas to prevent abuse and ensure fair usage of the async API resources.
- Monitor the performance and health of your async APIs using Tyk’s built-in analytics and monitoring capabilities. Set up alerts and notifications for critical events.
- Version your async APIs to manage compatibility and enable seamless updates without disrupting existing clients.
- Provide comprehensive documentation for your async APIs, including details on message formats, schemas and example payloads, to assist developers in integrating with your APIs effectively.
Debugging Series
MongoDB
Tyk uses Mongo as a database to store much of its analytical data. This means if you have a dashboard instance that is down, there’s a high chance that this is because of either Mongo being down or an issue with your dashboard connecting to Mongo. Here, we’ll outline the following:- How to isolate Mongo as the root of the error
- The steps to take to help stop your system from going down.
-
Isolating Mongo as the fault
Here are a few ways to identify Mongo as the source of the problem:- Analytics is not showing up on the dashboard
- When hitting the
/helloendpoint, the dashboard is down - The Mongo database size is hitting hardware resource limits.
-
Mongo status
Similarly to Tyk, Mongo has a health check that we can run to get the status of our Mongo instance. This should be a starting point for debugging Mongo (depending on which system):Sudo systemctl status mongodorsudo service mongodb status- Logs under
/var/log/mongo/mongo.logshould also outline any outage
-
Mongo version
Does Tyk support the version of Mongo that you’re using? Read more about that here. -
Capped collections
Suppose a Mongo instance runs over a long period in addition to a lot of traffic in a Tyk system. In that case, the chances of the collections growing out of control are very real - especially thetyk_analyticscollections. In some cases,enable_detailed_logging: trueadds fuel to the fire, as this parameter should only be set temporarily during debugging. This configuration exists on the gateway and the API levels, so ensure this is off after debugging. We advise everyone to cap every collection in Mongo, as this prevents collections from growing out of control and bringing your dashboard down by hitting resource limits. You can determine each collection’s cap size by visiting our MongoDB sizing calculator. Here’s more information on how and why you want to cap your collections. -
Size caps versus TTL-capped collections
Are you trying to decide between capping your collections or by size? It depends on a couple of factors. Ultimately, both settings will get rid of older data, so it’s based on how far back you need to view it. Assuming you only need data for a few days, then using a TTL will be the best route, as it will only allow your collections to grow that wild over a short period. Alternatively, if you care about how big the collections grow and want to see longer-lived data, then capping by size is your best direction. This will limit the collection to developing within a controlled resource limit. And in the context of aggregate analytics, this collection will hold data for long periods. One thing to note here is that if you head down the TTL route, and if your environment has A LOT of traffic, then your collections can grow wild and fast, while a size-capped collection will always stay within a known size limit. -
Handling overgrown, uncapped collections
There are three ways to do this:- The first method is to delete (drop) the collection and create a new collection with a cap (commands below).
- The second method is to rename the collection to a random name and then create a new collection with a cap. Then restart Mongo with a larger size (we do this because the overgrown collections still exist). This is to confirm that the collection size grew too large and dropped the Mongo connection. The renaming also helps conserve the existing data if you still need it (but it will be useless in the background unless you attempt the third method).
- The third method is to delete (deleteMany() call below) the old data to trim down their collection size. Then, you can restart your instance to see if the connection goes up again.
-
Secure Mongo connection
You will use a secured connection to your Mongo instance in most production cases. Here are a few things to consider:- Verify there isn’t a network issue that stops your dashboard from connecting to Mongo. You can do this by hitting the dashboard server from your Mongo server (or vice versa)
-
Validate certificate and
.pemfiles - Connect (command below) to Mongo with certificates
- Verify Pump has the correct parameters to include your certificates
- Verify your dashboard has the correct parameters relative to your environment:
-
How to Cap analytics data storage
What methods are available to enable me to manage my MongoDB analytics storage? Time Based Caps Size Based CapsTime based caps (TTL indexes) are incompatible with already configured size based caps.
If you are using DocumentDB, capped collections are not supported. See here for more details.
-
MongoDB X.509 Client Authentication
You can use the MongoDB X509 Certificate flow to authenticate the Tyk Dashboard, Tyk Pump, and Tyk MDCB with your MongoDB install. This is slightly different from AWS DocumentDB setup instructions. Before we get into the configuration, we need to understand the two key components: connection strings and certificates.-
Connection Strings
- You must specify a username (and password if needed) in the connection string. Why do you need a username at all?
-
We must specify the following parameters:
?authSource=$external&authMechanism=MONGODB-X509"
Passwords
If you have to include a password, you can do it after the username in basic auth format:URL Encoding Protected Characters
Note that you must URL encode the:character into%40. So replace any:in the username field into the URL encoded version. - Certificates You’ll need to provide two certificates to complete the X509 Client Authentication: CA Cert containing just the public key of the Certificate Authority (CA). Client Cert containing both the public and private keys of the client.
Configuration
Here’s what it looks like all put together:-
Tyk Dashboard
Your
tyk_analytics.confshould include these fields at the root level: -
Tyk Pump
Tyk offers three different MongoDB pumps (
mongo,mongo_aggregate, andmongo_selective), each of which must be separately configured for X509 certificate authentication. The following fields must be set under themetasection of each pump (or set as environment variable):In addition to the other configs, these are the ones related to MongoDB: -
Tyk MDCB
As of Tyk MDCB v1.8.0, you have been able to secure Tyk MDCB with MongoDB using X509 Certificate Authentication flow.
The config settings are exactly the same as the Tyk Dashboard steps, just nested one level deeper:
Example Config:
-
Connection Strings
Tyk Self-Managed
This guide should help a user of Tyk Self-Managed in debugging common issues. A helpful way to go about this is by:- Isolating your components to see where the error is coming from
- Enabling debug logs to ensure you get all the information you need
-
Gateway
Querying the gateway’s/helloendpoint/hellohealth endpoint is the quickest way to determine the status of your Tyk instance. You can find more information in our docs about the Gateway Liveness health check. This endpoint is important as it allows the user to isolate the problem’s origin. At a glance, the/helloendpoint reports the Gateways connectivity to Redis, and the control plane components eg. Tyk Dashboard, Tyk Multi-Data Center Bridge (MDCB), and Tyk Cloud.If the Dashboard or RPC connectivity fails (control plane components), the Gateway will still function based on the last received configurations from those components. However, if Redis fails, Gateway will go down since it is a hard dependency.
Debug Logs
Setting the log level to debug will allow for more descriptive logs that will give a better context around any issue you might be facing. For example, here are the different outputs you receive when calling an Open Keyless API withinfo and debug log-level modes.
Here is the output when using info as the log level:
debug as the log level:
debug log level mode provides more information which will help during your debugging stage, i.e when the API call was started, when it was finished, how long it took for the call to finish, the endpoint that was called, the upstream that was called, the organization that the API belongs to, and more.
-
Gateway Debug Settings
If you’re using a*.conffor your configuration parameters:If you’re using environment variables for your configuration:If you’re using Tyk Helm Charts. Add the following items to yourvalues.yaml: -
Dashboard Debug Settings
If you’re using a*.conffor your configuration parameters:If you’re using environment variables for your configuration:If you’re using Tyk Helm Charts. Add the following items to yourvalues.yaml:You can find the full log levels in our documentation.
Versions
You can access all Tyk release information on the release notes overview page. We recommend always using the Long-Term Support (LTS) release for stability and long term support.Non-LTS versions
Tyk is backwards compatible, upgrading to newer versions won’t turn on new features or change the behavior of your existing environment. For the best experience when experimenting with Tyk and exploring its latest capabilities, you can use our latest version. You can access all Tyk releases on the release notes summary page.Dashboard
The Dashboard front-end (GUI included) uses Tyk Dashboard API to retrieve data to display or update. This means you can use the developer tools on your browser to access the API and its information. Looking into the API details, the URL, the headers, the payload and the response can help you investigate the source of the issue and replicate it with API calls using an HTTP client such as cURL or Postman. As a next step to this investigation, if that specific endpoint exists also in Tyk Gateway API, you can compare the responses from both gateway and dashboard requests.Isolating
As mentioned above, errors can happen in any of the components of your Tyk deployment, and as such, one of the critical things you’ll pick up during your debugging phase is isolating these environments.Dashboard Level
When debugging an issue, in order to isolate the gateway from the Dashboard, try to call the same API ednpoint on both Tyk Dashboard and Tyk Gateway If it works with the gateway API only, then the issue is likely to be in the Dashboard. It could be that you need to set in the Dashboard some configuration parameters (using the config file or via environment variables).Gateway or API level
Are you making calls against your gateway or API, and it’s not working? Try isolating the gateway from everything else. Often you’ll see that the gateway or API aren’t at fault and that it’s something else; it can be the load balancer you have in your environment blocking the call from ever reaching it. In the case of the API error-ing out, you can also isolate it by:- Creating a generic Httpbin API and calling it
- If this works, then the API configuration or the backend is at fault
- Changing the target URL of the API
- The upstream API can be at fault
- Assuming your API has a plugin, take away the plugin and test the API
- The error most likely exists in the plugin
- If the error exists in your plugin, try taking out certain parts of the code and testing it with minimal logic
- This means that part of your code with integrated logic is incorrect
- Is the target URL the same in another one of your APIs?
- The gateway sees the API as duplicated and changes the new target URL causing the gateway to error.