Documentation Index
Fetch the complete documentation index at: https://tyk.io/docs/llms.txt
Use this file to discover all available pages before exploring further.
Introduction
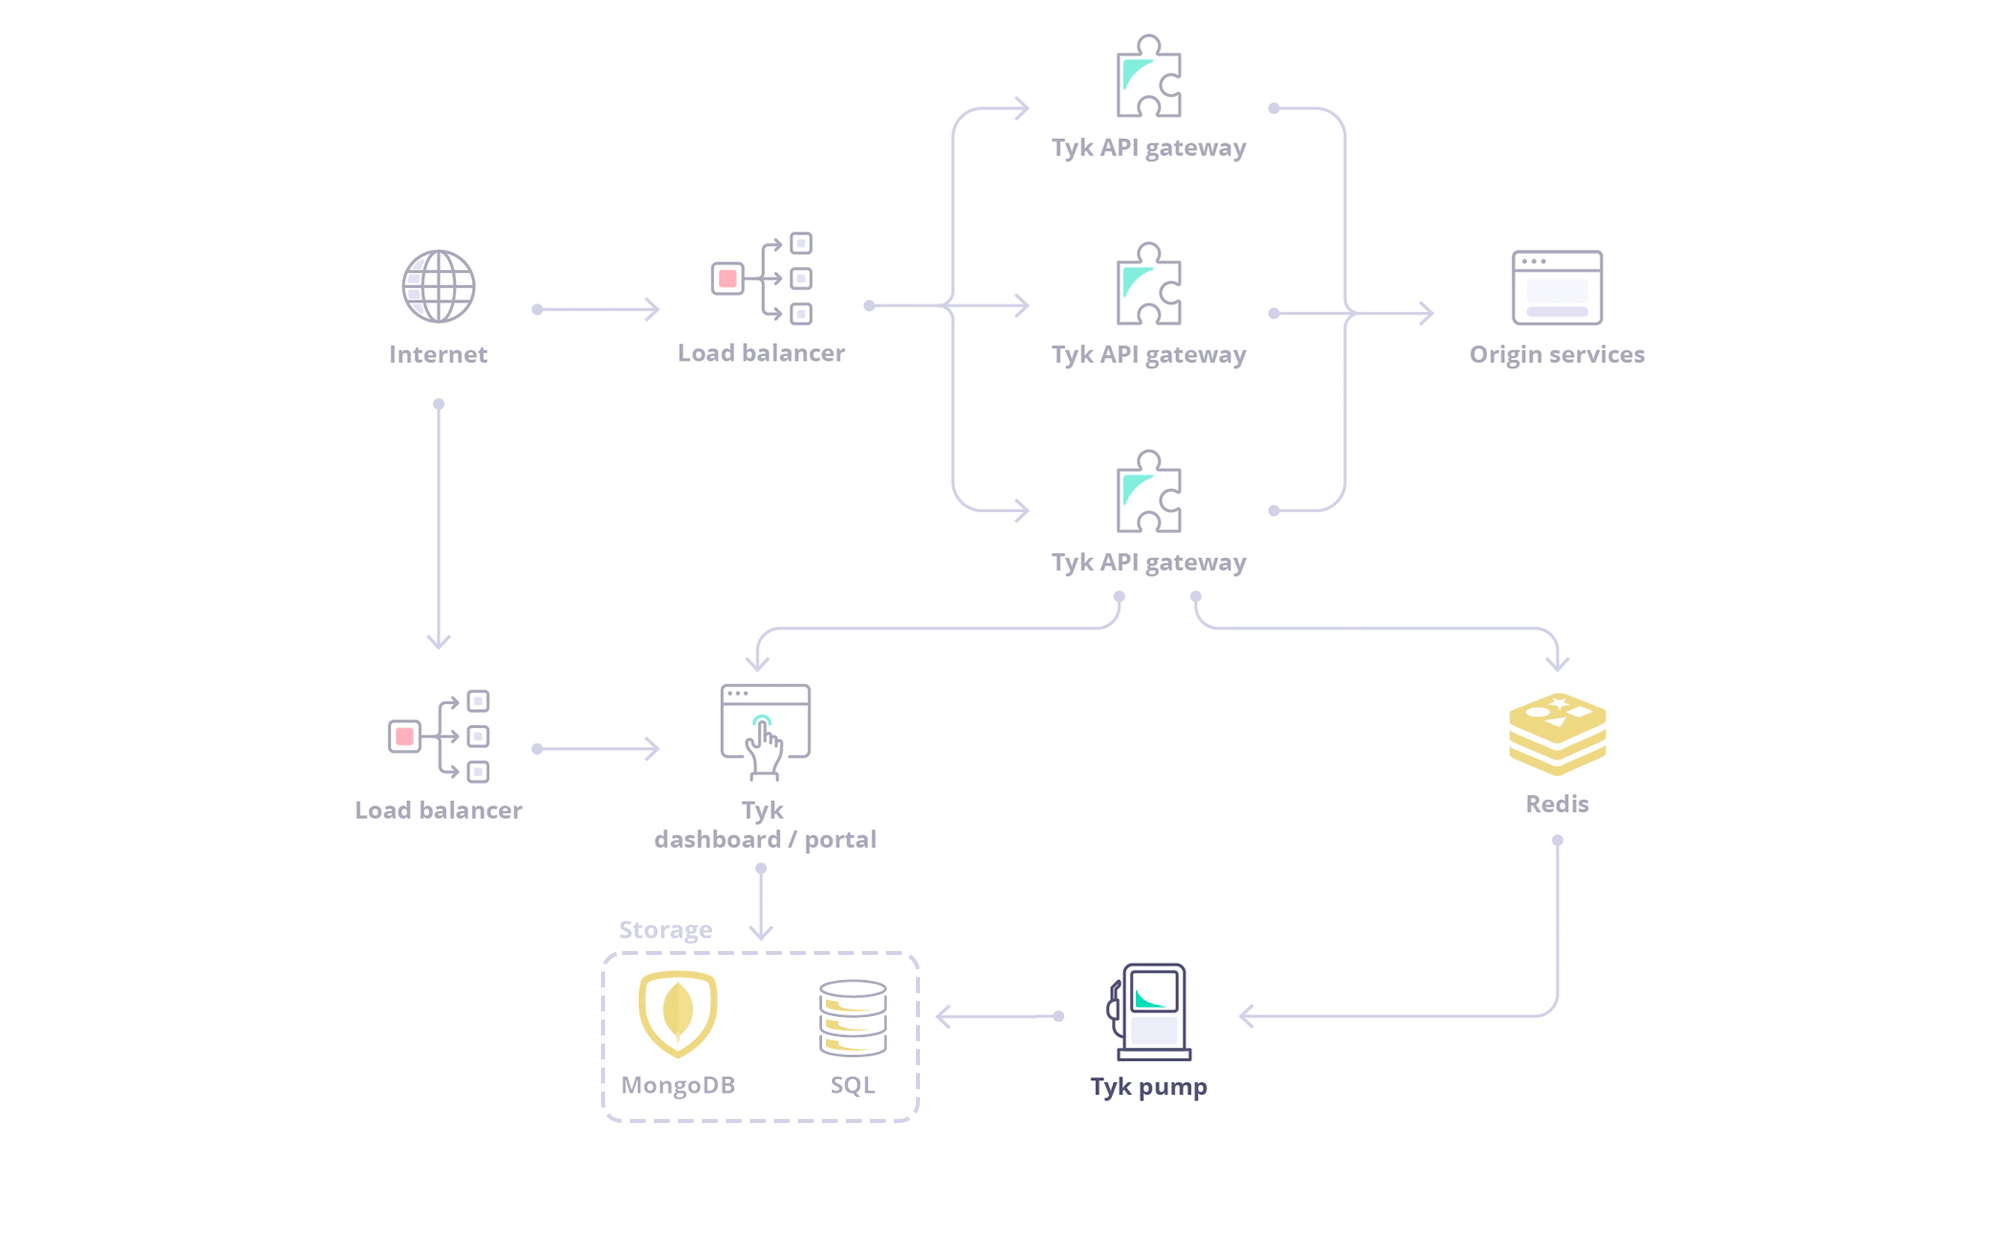
Traffic analytics are captured by the Gateway nodes and then temporarily stored in Redis. The Tyk Pump is responsible for moving those analytics into a persistent data store, such as MongoDB, where the traffic can be analyzed.What is the Tyk Pump?
The Tyk Pump is our open source analytics purger that moves the data generated by your Tyk nodes to any back-end. It is primarily used to display your analytics data in the Tyk Dashboard.The Tyk Pump is not currently configurable in our Tyk Cloud solution.
Tyk Pump Data Flow
Here’s the architecture depending on your deployment model:- Enterprise
- Open Source

 |
|---|
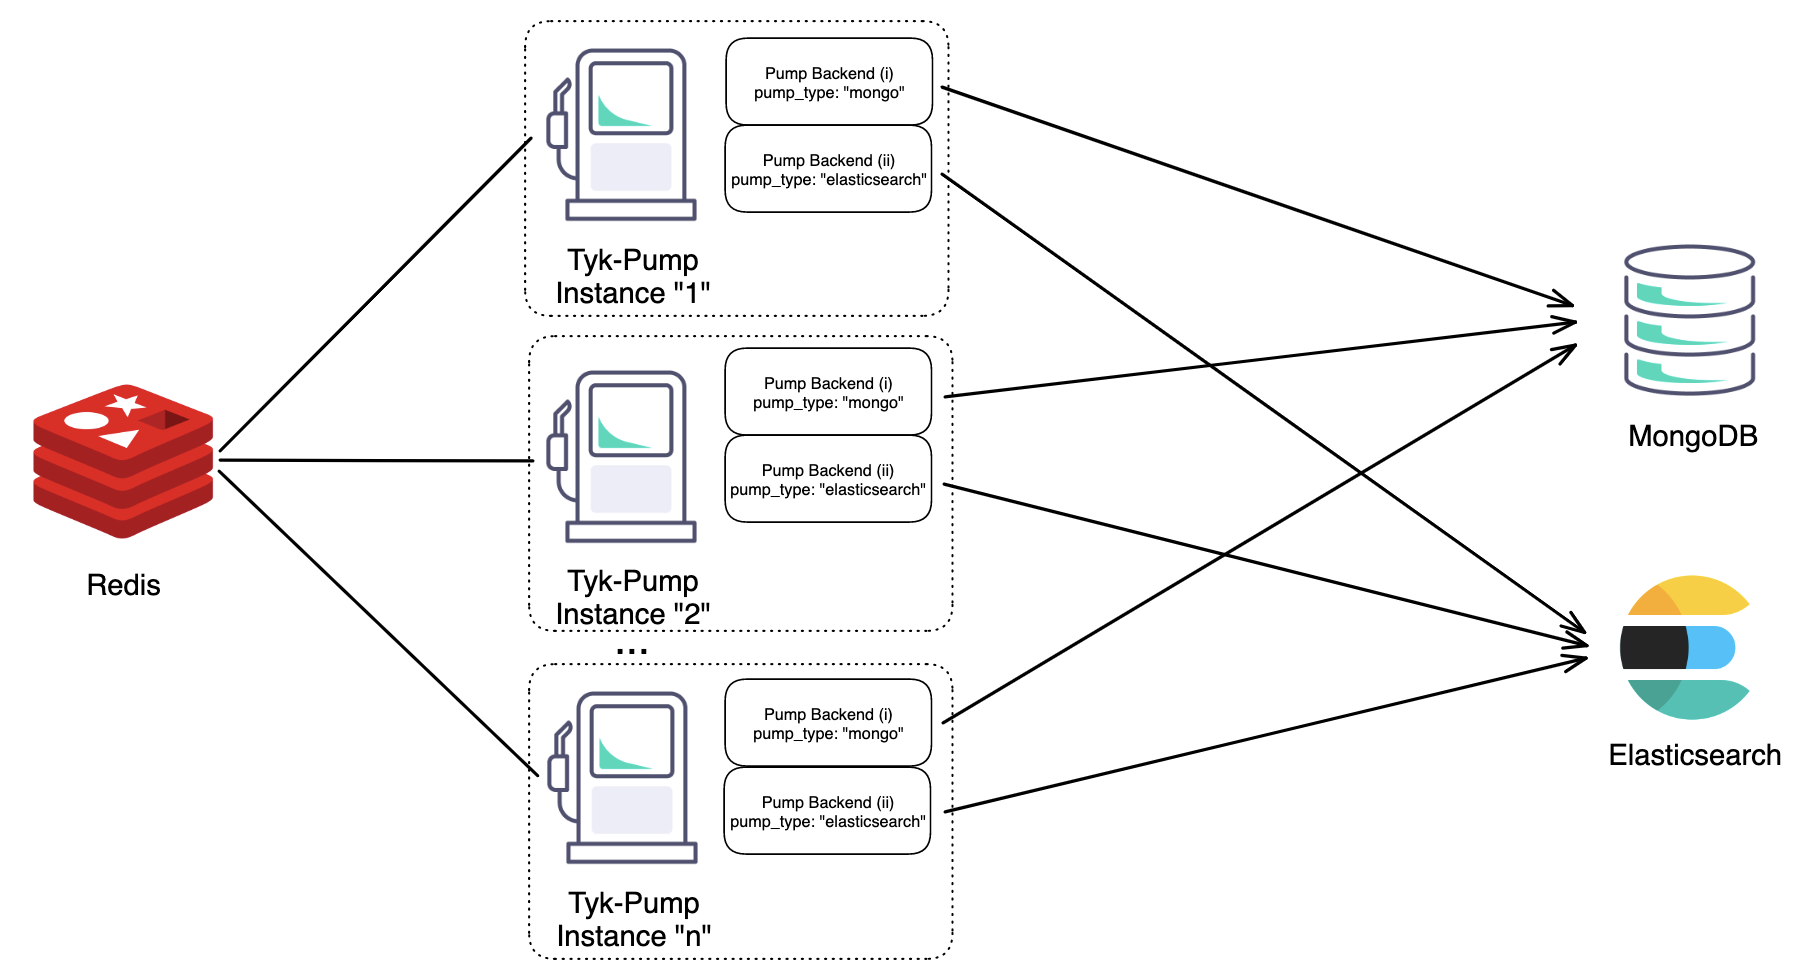
| Figure 1: An architecture diagram illustrating horizontal scaling of “n” Instances of Tyk-Pump each with two different backends. |
Other Supported Backend Services
We list our supported backends here.Configuring your Tyk Pump
See Tyk Pump Configuration for more details on setting up your Tyk Pump. Tyk Pump can be horizontally scaled without causing duplicate data, please see the following Table for the supported permutations of Tyk Pump scaling.| Supported | Summary |
|---|---|
| ✅ | Single Pump Instance, Single Backend |
| ✅ | Single Pump Instance, Multiple Backend(s) |
| ✅ | Multiple Pump Instances, Same Backend(s) |
| ❌ | Multiple Pump Instances, Different Backend(s) |
Getting Started
Tyk Pump Configuration
The Tyk Pump is our Open Source analytics purger that moves the data generated by your Tyk nodes to any back-end. By moving the analytics into your supported database, it allows the Tyk Dashboard to display traffic analytics across all your Tyk Gateways.Tyk Dashboard
MongoDB
The Tyk Dashboard uses themongo-pump-aggregate collection to display analytics. This is different than the standard mongo pump plugin that will store individual analytic items into MongoDB. The aggregate functionality was built to be fast, as querying raw analytics is expensive in large data sets. See Pump Dashboard Config for more details.
SQL
Tyk no longer supports SQLite as of Tyk 5.7.0. To avoid disruption, please transition to PostgreSQL, MongoDB, or one of the listed compatible alternatives.
- PostgreSQL
- SQLite
tyk-analytics.conf) there is now a storage section.
Field description
main- Main storage (APIs, Policies, Users, User Groups, etc.)analytics- Analytics storage (used for display all the charts and for all analytics screens)logs- Logs storage (log browser page)uptime- uptime tests analytics data
Common settings
For everystorage section, you must populate the following fields:
typeuse this field to define your SQL platform (currently SQLite or PostgreSQL are supported)connection_stringthe specific connection settings for your platform
sql name and database specific configuration options.
####### SQL example
Capping analytics data
Tyk Gateways can generate a lot of analytics data. Be sure to read about capping your Dashboard analyticsOmitting the configuration file
From Tyk Pump 1.5.1+, you can configure an environment variable to omit the configuration file with theTYK_PMP_OMITCONFIGFILE variable.
This is specially useful when using Docker, since by default, the Tyk Pump has a default configuration file with pre-loaded pumps.
Sharding analytics to different data sinks
In a multi-organization deployment, each organization, team, or environment might have their preferred analytics tooling. This capability allows the Tyk Pump to send analytics for different organizations or various APIs to different destinations. E.g. Org A can send their analytics to MongoDB + DataDog while Org B can send their analytics to DataDog + expose the Prometheus metrics endpoint.Configuring the sharded analytics
You can achieve the sharding by setting both an t and a , meaning that some data sinks can receive information for all orgs, whereas other data sinks will not receive certain organization’s analytics if it was block listed. This feature makes use of the field calledfilters, which can be defined per pump. This is its structure:
api_idsandorg_idsworks as allow list (APIs and orgs where we want to send the analytic records).skip_api_idsandskip_org_idsworks as block list (APIs and orgs where we want to filter out and not send their the analytic records).
org1 or org2 will go to the csv backend and everything but analytics records from api_id_1 to elasticsearch.
Setup Dashboard Analytics
To enable Dashboard Analytics, you would need to configure Tyk Pump to send analytic data to the Dashboard storage MongoDB / SQL. These are the different pumps that handle different kinds of analytic data.| Analytics | Activities Graph | Log Browser | Uptime Analytics |
|---|---|---|---|
| Mongo (Multi organization) | Mongo Aggregate Pump | Mongo Selective Pump | Uptime Pump |
| Mongo (Single organization) | Mongo Aggregate Pump | Mongo Pump | Uptime Pump |
| SQL | SQL Aggregate Pump | SQL Pump | Uptime Pump |
MongoDB
Mongo Pump
mongo Pump simply saves all individual requests across every organization to a collection called tyk_analytics. Each request will be stored as a single document.
Pump Config
Capping
This collection should be capped due to the number of individual documents. This is especially important if thedetailed_recording in the Gateway is turned on which means that the Gateway records the full payload of the request and response.
Omitting Indexes
From Pump 1.6+, the Mongo Pumps indexes default behavior is changed and the new configuration optionomit_index_creation is available. This option is applicable to the following Pumps: Mongo Pump,Mongo Aggregate Pump and Mongo Selective Pump.
The behavior now depends upon the value of ‘omit_index_creation’ and the Pump in use, as follows:
- If
omit_index_creationis set totrue, tyk-pump will not create any indexes (for Mongo pumps). - If
omit_index_creationis set tofalse(default) and you are usingDocumentDB, tyk-pump will create the Mongo indexes. - If
omit_index_creationis set tofalse(default) and you are usingMongoDB, the behavior of tyk-pump depends upon whether the collection already exists:- If the collection exists, tyk-pump will not create the indexes again.
- If the collection does not already exist, tyk-pump will create the indexes.
Dashboard Setting
In API Usage Data > Log Browser screen you will see all the individual requests that the Gateway has recorded and saved intyk_analytics collection using the mongo pump.
Because you have the option to store and display analytics of every organization or separately per organization, you need to configure the Tyk Dashboard with the matching setting according to the way you set the pump to store the data in MongoDB.
The field use_sharded_analytics controls the collection that the dashboard will query.
- If
use_sharded_analytics: false- the dashboard will query the collectiontyk_analyticsthat mongo pump populated - If
use_sharded_analytics: true- the dashboard will query the collection thatmongo-pump-selectivepump populated
Mongo Aggregate Pump
mongo-pump-aggregate pump stores data in a collection called **z_tyk_analyticz_aggregate_{ORG ID}**.
Pump Config
use_mixed_collection: true- will store analytics to both your organization defined collectionsz_tyk_analyticz_aggregate_{ORG ID}and your org-lesstyk_analytics_aggregatescollection.use_mixed_collection: false- your pump will only store analytics to your org defined collection.
tyk_analytics_aggregates collection is used to query analytics across your whole Tyk setup. This can be used, for example, by a superuser role that is not attached to an organization. When set to true, you also need to set use_sharded_analytics to true in your Dashboard config.
Dashboard Setting
This pump supplies the data for the following sub categoriesAPI Usage Data:
- Activity by API screen
- Activity by Key screen
- Errors screen
- The enable_aggregate_lookups: true field must be set in the Dashboard configuration file, in order for the Dashboard to query and display the aggregated data that
mongo-pump-aggregatesaved to MongoDB.
Capping
As a minimal number of documents get stored, you don’t need to worry about capping this. The documents contain aggregate info across an individual API, such as total requests, errors, tags and more. ####### High Traffic Environment Settings If you have a high traffic environment, and you want to ignore aggregations to avoid Mongo overloading and/or reduce aggregation documents size, you can do it using theignore_aggregations configuration option. The possible values are:
- APIID
- Errors
- Versions
- APIKeys
- OauthIDs
- Geo
- Tags
- Endpoints
- KeyEndpoint
- OauthEndpoint
- ApiEndpoint
request_id or timestamp), this collection can grow a lot since aggregation of unique values simply creates a record/document for every single value with a counter of 1. To mitigate this, avoid tagging unique headers as the first option. If you can’t change the API definition quickly, you can add the tag to the ignore list "ignore_aggregations": ["request_id"]. This ensures that Tyk pump does not aggregate per request_id.Also, if you are not sure what’s causing the growth of the collection, you can also set time capping on these collections and monitor them.
Mongo Selective Pump
mongo-pump-selective pump stores individual requests per organization in collections called z_tyk_analyticz_{ORG ID}.
Similar to the regular mongo pump, Each request will be stored as a single document.
Pump Config
This collection should be capped due to the number of individual documents.Capping
This collection should be capped due to the number of individual documents.Dashboard Setting
As with the regular analytics, if you are using the Selective pump, you need to setuse_sharded_keys: true in the dashboard config file so it will query z_tyk_analyticz_{ORG ID} collections to populate the Log Browser.
Uptime Tests Analytics
Pump Configuration
Tyk Dashboard Configuration
Tyk Gateway Setting
To enable Uptime Pump, modify gateway configuration enable_uptime_analytics to true.SQL
When using one of our supported SQL platforms, Tyk offers 3 types of SQL pumps:- Aggregated Analytics:
sql_aggregate - Raw Logs Analytics:
sql - Uptime Tests Analytics
- Sharding raw logs
- Sharding aggregated analytics
- Sharding uptime tests
SQL Pump
While aggregated analytics offer a decent amount of details, there are use cases when you’d like to have access to all request details in your analytics. For that you can generate analytics based on raw logs. This is especially helpful when, once you have all the analytics generated based on raw logs stored in your SQL database, you can then build your own custom metrics, charts etc. outside of your Tyk Dashboard, which may bring more value to your product. The pump needed for storing log data in the database is very similar to other pumps as well as the storage setting in the Tyk Dashboard config. It just requires the SQL name and database-specific configuration options.SQL Pump Configuration
For storing logs into thetyk_analytics database table.
type - The supported types are sqlite and postgres.
connection_string - Specifies the connection string to the database. For example, for sqlite it will be the path/name of the database, and for postgres, specifying the host, port, user, password, and dbname.
log_level - Specifies the SQL log verbosity. The possible values are: info,error and warning. By default, the value is silent, which means that it won’t log any SQL query.
table_sharding - Specifies if all the analytics records are going to be stored in one table or in multiple tables (one per day). By default, it is set to false.
If table_sharding is false, all the records are going to be stored in the tyk_analytics table. If set to true, daily records are stored in a tyk_analytics_YYYYMMDD date formatted table.
Dashboard Setting
In the API Usage Data > Log Browser screen you will see all the individual requests that the Gateway has recorded and saved intyk_analytics collection using the sql pump.
Make sure you have configured the dashboard with your SQL database connection settings:
SQL Aggregate Pump
This is the default option offered by Tyk, because it is configured to store the most important analytics details which will satisfy the needs of most of our clients. This allows your system to save database space and reporting is faster, consuming fewer resources.SQL Aggregate Pump Configuration
For storing logs into thetyk_aggregated database table.
type - The supported types are sqlite and postgres.
connection_string - Specifies the connection string to the database. For example, for sqlite it will be the path/name of the database, and for postgres, specifying the host, port, user, password, and dbname.
log_level - Specifies the SQL log verbosity. The possible values are: info, error, and warning. By default, the value is silent, which means that it won’t log any SQL query.
track_all_paths - Specifies if it should store aggregated data for all the endpoints. By default, it is set to false, which means that it only stores aggregated data for tracked endpoints.
ignore_tag_prefix_list - Specifies prefixes of tags that should be ignored.
table_sharding - Specifies if all the analytics records are going to be stored in one table or in multiple tables (one per day). By default, it is set to false.
If table_sharding is false, all the records are going to be stored in the tyk_aggregated table. If set to true, daily records are stored in a tyk_aggregated_YYYYMMDD date formatted table.
Dashboard Setting
This pump supplies the data for the following sub categoriesAPI Usage Data:
- Activity by API screen
- Activity by Key screen
- Errors screen
-
The enable_aggregate_lookups: true field must be set in the Dashboard configuration file, in order for the Dashboard to query and display the aggregated data that
sql-aggregatesaved to the database. - Make sure you have configured the dashboard with your SQL database connection settings:
SQL Uptime Pump
In anuptime_pump_config section, you can configure a SQL uptime pump. To do that, you need to add the field uptime_type with sql value.
type - The supported types are sqlite and postgres.
connection_string - Specifies the connection string to the database. For example, for sqlite it will be the path/name of the database, and for postgres, specifying the host, port, user, password, and dbname.
table_sharding - Specifies if all the analytics records will be stored in one table or multiple tables (one per day). By default, it is set to false.
If table_sharding is false, all the records will be stored in the tyk_analytics table. If set to true, daily records are stored in a tyk_analytics_YYYYMMDD date formatted table.
Tyk Dashboard Configuration
You need to setenable_aggregate_lookups to false
Then add your SQL database connection settings:
Uptime Tests Analytics
Tyk Pump Configuration
For storing logs into thetyk_aggregated database table.
Tyk Dashboard Configuration
Tyk Gateway Setting
To enable Uptime Pump, modify gateway configuration enable_uptime_analytics to true.Sharding
In a production environment, we recommend the following setup: By default, all logs/analytics are stored in one database table, making it hard and less performant to execute CRUD operations on the dataset when it grows significantly. To improve the data maintenance processes, as querying or removing data from one single table is slow, we have added a new option (table_sharding), so that the data can be stored daily (one table of data per day), which will automatically make querying or removing sets of data easier, whether dropping tables for removing logs/analytics, or reading multiple tables based on the selected period.
Tyk Pump Configuration
Tyk Dashboard Configuration
Graph Pump setup
MongoDB
Starting with version1.7.0 of Tyk Pump and version 4.3.0 of Tyk Gateway it is possible to configure Graph MongoDB Pump. Once configured, the pump enables support for Graphql-specific metrics. The Graphql-specific metrics currently supported include (more to be added in future versions ):
- Types Requested.
- Fields requested for each type.
- Error Information (not limited to HTTP status codes).
Setting up Graph MongoDB Pump
-
Set
enable_analyticstotruein yourtyk.conf. -
Enable Detailed recording by setting
enable_detailed_recordingin yourtyk.conftotrue. This is needed so that the GraphQL information can be parsed from the request body and response.This will enable detailed recording globally, across all APIs. This means that the behavior of individual APIs that have this configuration parameter set will be overridden. The Gateway must be restarted after updating this configuration parameter. -
Set up your Mongo
collection_name. -
Add your Graph MongoDB Pump configuration to the list of pumps in your
pump.conf(pump configuration file).
Current limitations
The Graph MongoDB Pump is being improved upon regularly and as such there are a few things to note about the Graph MongoDB Pump current behavior:- Size of your records - due to the detailed recording being needed for this Pump’s to function correctly, it is important to note that your records and consequently, your MongoDB storage could increase in size rather quickly.
- Subgraph requests are not recorded - Requests to tyk-controlled subgraphs from supergraphs in federation setting are currently not recorded by the Graph MongoDB Pump, just the supergraph requests are handled by the Graph MongoDB Pump.
- UDG requests are recorded but subsequent requests to data sources are currently ignored.
- Currently, Graph MongoDB Pump data can not be used in Tyk Dashboard yet, the data is only stored for recording purposes at the moment and can be exported to external tools for further analysis.
SQL
Starting with Version1.8.0 of Tyk Pump and version 5.0.0 of the Tyk Gateway; It is possible to export GraphQL analytics to an SQL database.
Setting up Graph SQL Pump
With the Graph SQL pump currently includes information (per request) like:- Types Requested
- Fields requested for each type
- Error Information
- Root Operations Requested.
-
Set
enable_anayticstotruein yourtyk.conf. -
Enable Detailed recording by setting
enable_detailed_recordingin yourtyk.conftotrue. This is needed so that the GraphQL information can be parsed from the request body and response.This will enable detailed recording globally, across all APIs. This means that the behavior of individual APIs that have this configuration parameter set will be overridden. The Gateway must be restarted after updating this configuration parameter. -
Configure your
pump.confusing this sample configuration:
postgres, sqlite and mysql databases. The table_name refers to the table that will be created in the case of unsharded setups, and the prefix that will be used for sharded setups
e.g tyk_analytics_graph_20230327.
The Graph SQL pump currently has the same limitations as the Graph Mongo Pump.
Setting up Graph SQL Aggregate Pump
Thesql-graph-aggregate can be configured similar to the Graph SQL pump:
External Data Stores
The Tyk Pump component takes all of the analytics in Tyk and moves the data from the Gateway into your Dashboard. It is possible to set it up to send the analytics data it finds to other data stores. Currently we support the following:- MongoDB or SQL (Used by the Tyk Dashboard)
- CSV
- Elasticsearch (2.0 - 7.x)
- Graylog
- Resurface.io
- InfluxDB
- Moesif
- Splunk
- StatsD
- DogStatsD
- Hybrid (Tyk RPC)
- Prometheus
- Logz.io
- Kafka
- Syslog (FluentD)
CSV
Tyk Pump can be configured to create or modify a CSV file to track API Analytics.JSON / Conf file
Add the following configuration fields to the pumps section within yourpump.conf file:
Environment variables
Datadog
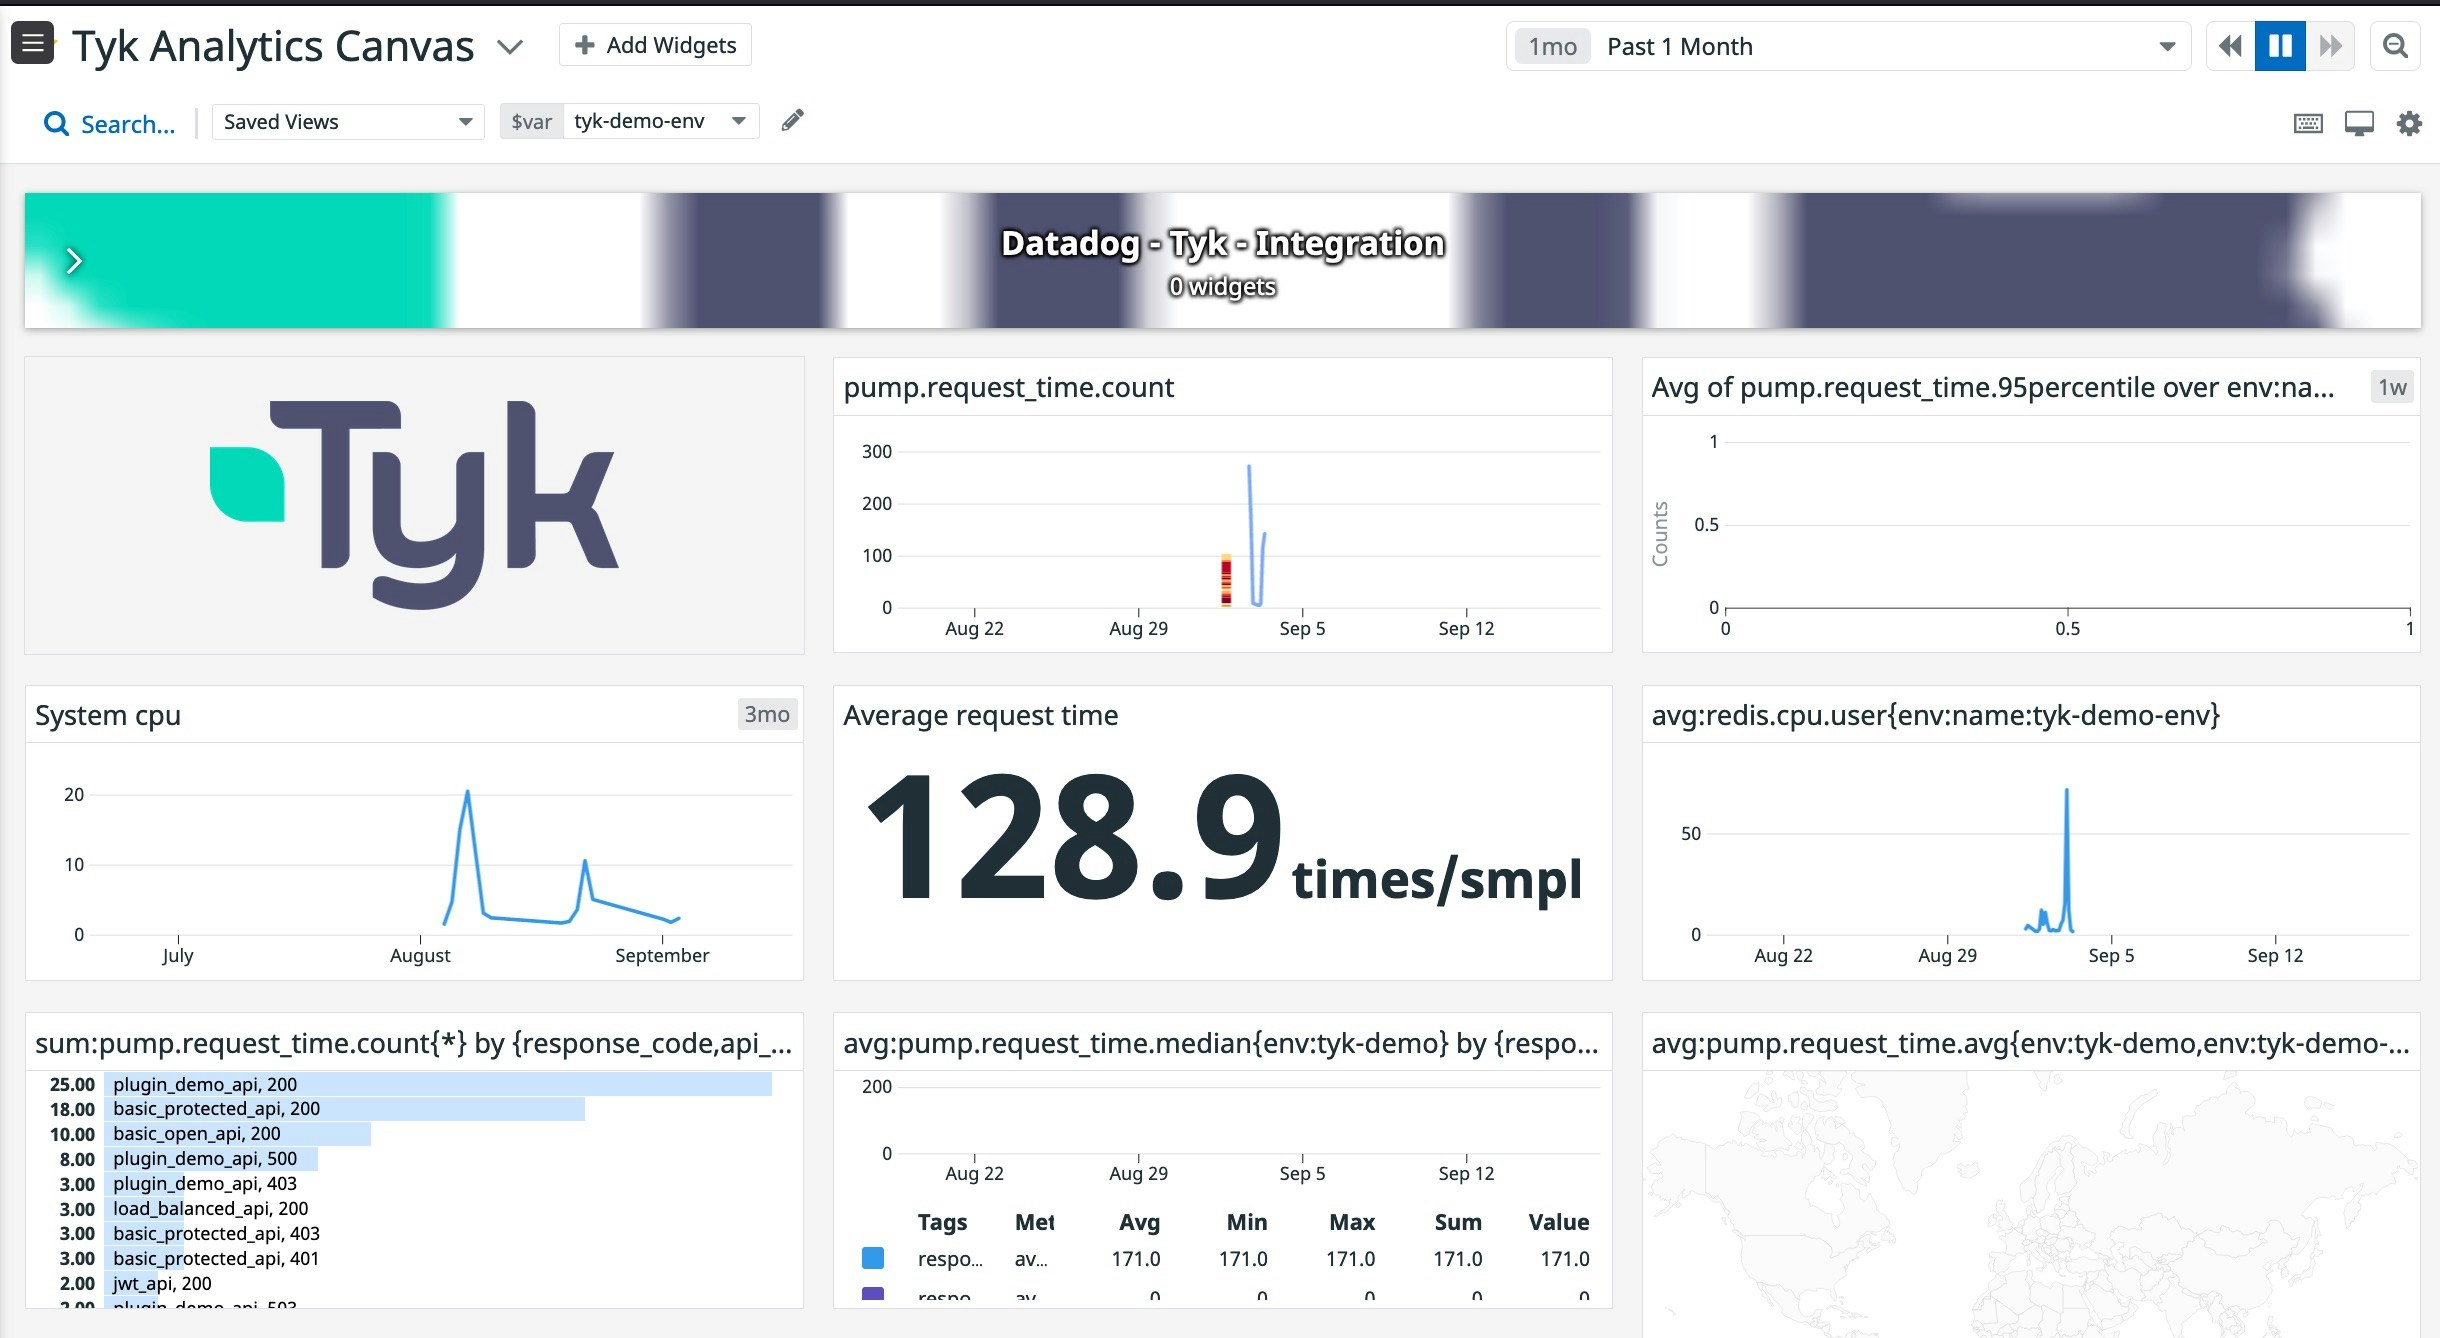
The Tyk Pump can be configured to send your API traffic analytics to Datadog with which you can build a dashboards with various metrics based on your API traffic in Tyk.Datadog dashboard example
We ceated a defaulkt Tyk dashboard canvat to give our users an easier starting point. You can find it in Datadog portal, under theDashboards --> lists section, (https://app.datadoghq.com/dashboard/lists)[https://app.datadoghq.com/dashboard/lists], and it is called Tyk Analytics Canvas. To use this dashboard you will need to make sure that your datadog agent deployment has the following tag env:tyk-demo-env and that your Tyk Pump configuration has dogstatsd.meta.namespace set to pump. You can also import it from Datadog official GH repo and change those values in the dashboard itself to visualize your analytics data as it flows into Datadog.
Prerequisites
- A working Datadog agent installed on your Environment. See the Datadog Tyk integration docs for more information.
- Either a Tyk Pro install or Tyk OSS Gateway install along with a Tyk Pump install.
How it works
When running the Datadog Agent, DogstatsD gets the request_time metric from your Tyk Pump in real time, per request, so you can understand the usage of your APIs and get the flexibility of aggregating by various parameters such as date, version, returned code, method etc.Tyk Pump configuration
Below is a sample DogstatD section from a Tykpump.conf file
Field descriptions
address: address of the datadog agent including host & portnamespace: prefix for your metrics to datadogasync_uds: Enable async UDS over UDPasync_uds_write_timeout_seconds: Integer write timeout in seconds ifasync_uds: truebuffered: Enable buffering of messagesbuffered_max_messages: Max messages in single datagram ifbuffered: true. Default 16sample_rate: default 1 which equates to 100% of requests. To sample at 50%, set to 0.5tags: List of tags to be added to the metric. The possible options are listed in the below example
pathmethodresponse_codeapi_versionapi_nameapi_idorg_idtrackedoauth_id
path tag.
On startup, you should see the loaded configs when initialising the DogstatsD pump
Elasticsearch
Elasticsearch is a highly scalable and distributed search engine that is designed to handle large amounts of data.JSON / Conf
Add the following configuration fields to the pumps section within yourpump.conf file:
Configuration fields
index_name: The name of the index that all the analytics data will be placed in. Defaults totyk_analyticselasticsearch_url: If sniffing is disabled, the URL that all data will be sent to. Defaults tohttp://localhost:9200enable_sniffing: If sniffing is enabled, theelasticsearch_urlwill be used to make a request to get a list of all the nodes in the cluster, the returned addresses will then be used. Defaults tofalsedocument_type: The type of the document that is created in Elasticsearch. Defaults totyk_analyticsrolling_index: Appends the date to the end of the index name, so each days data is split into a different index name. For example,tyk_analytics-2016.02.28. Defaults tofalse.extended_stats: If set to true will include the following additional fields:Raw Request,Raw ResponseandUser Agent.version: Specifies the ES version. Use3for ES 3.X,5for ES 5.X,6for ES 6.X,7for ES 7.X . Defaults to3.disable_bulk: Disable batch writing. Defaults tofalse.bulk_config: Batch writing trigger configuration. Each option is an OR with each other:workers: Number of workers. Defaults to1.flush_interval: Specifies the time in seconds to flush the data and send it to ES. Default is disabled.bulk_actions: Specifies the number of requests needed to flush the data and send it to ES. Defaults to 1000 requests. If it is needed, can be disabled with-1.bulk_size: Specifies the size (in bytes) needed to flush the data and send it to ES. Defaults to 5MB. Can be disabled with-1.
Environment variables
Moesif
This is a step by step guide to setting up Moesif API Analytics and Monetization platform to understand customer API usage and setup usage-based billing. We also have a blog post which highlights how Tyk and Moesif work together. The assumptions are that you have Docker installed and Tyk Self-Managed already running. See the Tyk Pump Configuration for more details.Overview
With the Moesif Tyk plugin, your API logs are sent to Moesif asynchronously to provide analytics on customer API usage along with your API payloads like JSON and XML. This plugin also enables you to monetize your API with billing meters and provide a self-service onboarding experience. Moesif also collects information such as the authenticated user (AliasId or OAuthId) to identify customers using your API. An overview on how Moesif and Tyk works together is available here.Steps for Configuration
- Get a Moesif Application Id Go to www.moesif.com and sign up for a free account. Application Ids are write-only API keys specific to an application in Moesif such as “Development” or “Production”. You can always create more applications in Moesif.
- Enable Moesif backend in Tyk Pump Add Moesif as an analytics backend along with your Moesif Application Id you obtained in the last step to your Tyk Pump Configuration
- Ensure analytics is enabled
This will enable detailed recording globally, across all APIs. This means that the behavior of individual APIs that have this configuration parameter set will be overridden. The Gateway must be restarted after updating this configuration parameter.
- Restart Tyk Pump to pickup the Moesif config
$ docker restart tyk-pump
- PROFIT!
Configuration options
The Tyk Pump for Moesif has a few configuration options that can be set in yourpump.env:
| Parameter | Required | Description | Environment Variable |
|---|---|---|---|
| application_id | required | Moesif Application Id. Multiple Tyk api_id’s will be logged under the same app id. | TYK_PMP_PUMPS_MOESIF_META_APPLICATIONID |
| request_header_masks | optional | Mask a specific request header field. Type: String Array [] string | TYK_PMP_PUMPS_MOESIF_META_REQUESTHEADERMASKS |
| request_body_masks | optional | Mask a specific - request body field. Type: String Array [] string | TYK_PMP_PUMPS_MOESIF_META_REQUESTBODYMASKS |
| response_header_masks | optional | Mask a specific response header field. Type: String Array [] string | TYK_PMP_PUMPS_MOESIF_META_RESPONSEHEADERMASKS |
| response_body_masks | optional | Mask a specific response body field. Type: String Array [] string | TYK_PMP_PUMPS_MOESIF_META_RESPONSEBODYMASKS |
| disable_capture_request_body | optional | Disable logging of request body. Type: Boolean. Default value is false. | TYK_PMP_PUMPS_MOESIF_META_DISABLECAPTUREREQUESTBODY |
| disable_capture_response_body | optional | Disable logging of response body. Type: Boolean. Default value is false. | TYK_PMP_PUMPS_MOESIF_META_DISABLECAPTURERESPONSEBODY |
| user_id_header | optional | Field name to identify User from a request or response header. Type: String. Default maps to the token alias | TYK_PMP_PUMPS_MOESIF_META_USERIDHEADER |
| company_id_header | optional | Field name to identify Company (Account) from a request or response header. Type: String | TYK_PMP_PUMPS_MOESIF_META_COMPANYIDHEADER |
Identifying users
By default, the plugin will collect the authenticated user (AliasId or OAuthId) to identify the customer. This can be overridden by setting theuser_id_header to a header that contains your API user/consumer id such as X-Consumer-Id. You can also set the company_id_header which contains the company to link the user to. See Moesif docs on identifying customers
Splunk
This is a step by step guide to setting Splunk to receive logs from the Tyk Pump. The assumptions are that you have Docker installed and Tyk Pro Self-Managed already running.Steps for Configuration
-
Run Splunk using Docker
Assuming you have Docker installed locally, run the following from a terminal:
-
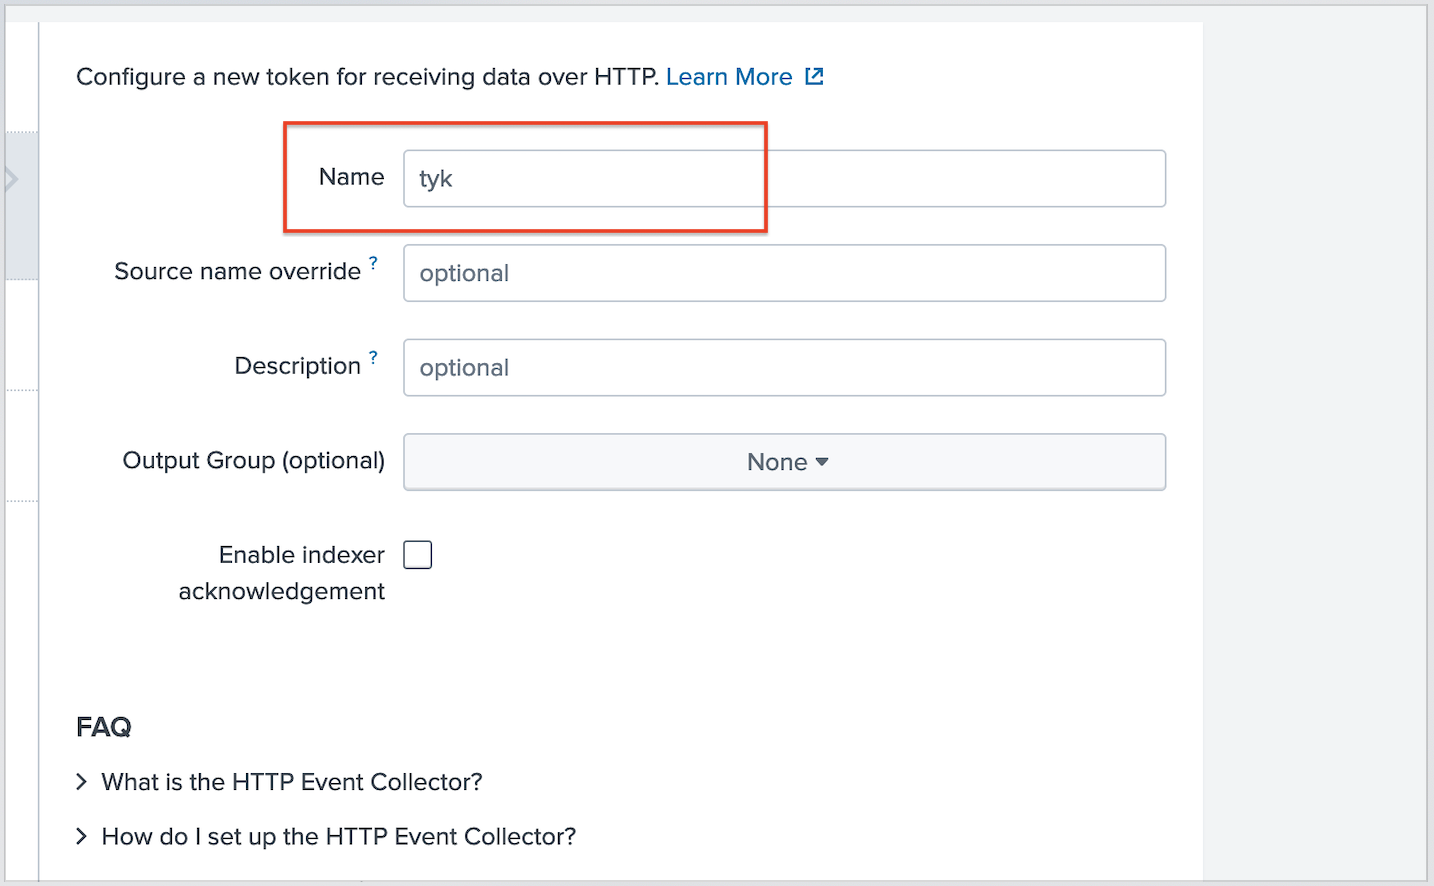
Setup a collector in Splunk
A) Visit http://localhost:8000 and log into the Splunk Dashboard using the username
adminand the password we set in the Docker run command,mypasswordB) Create a new Data input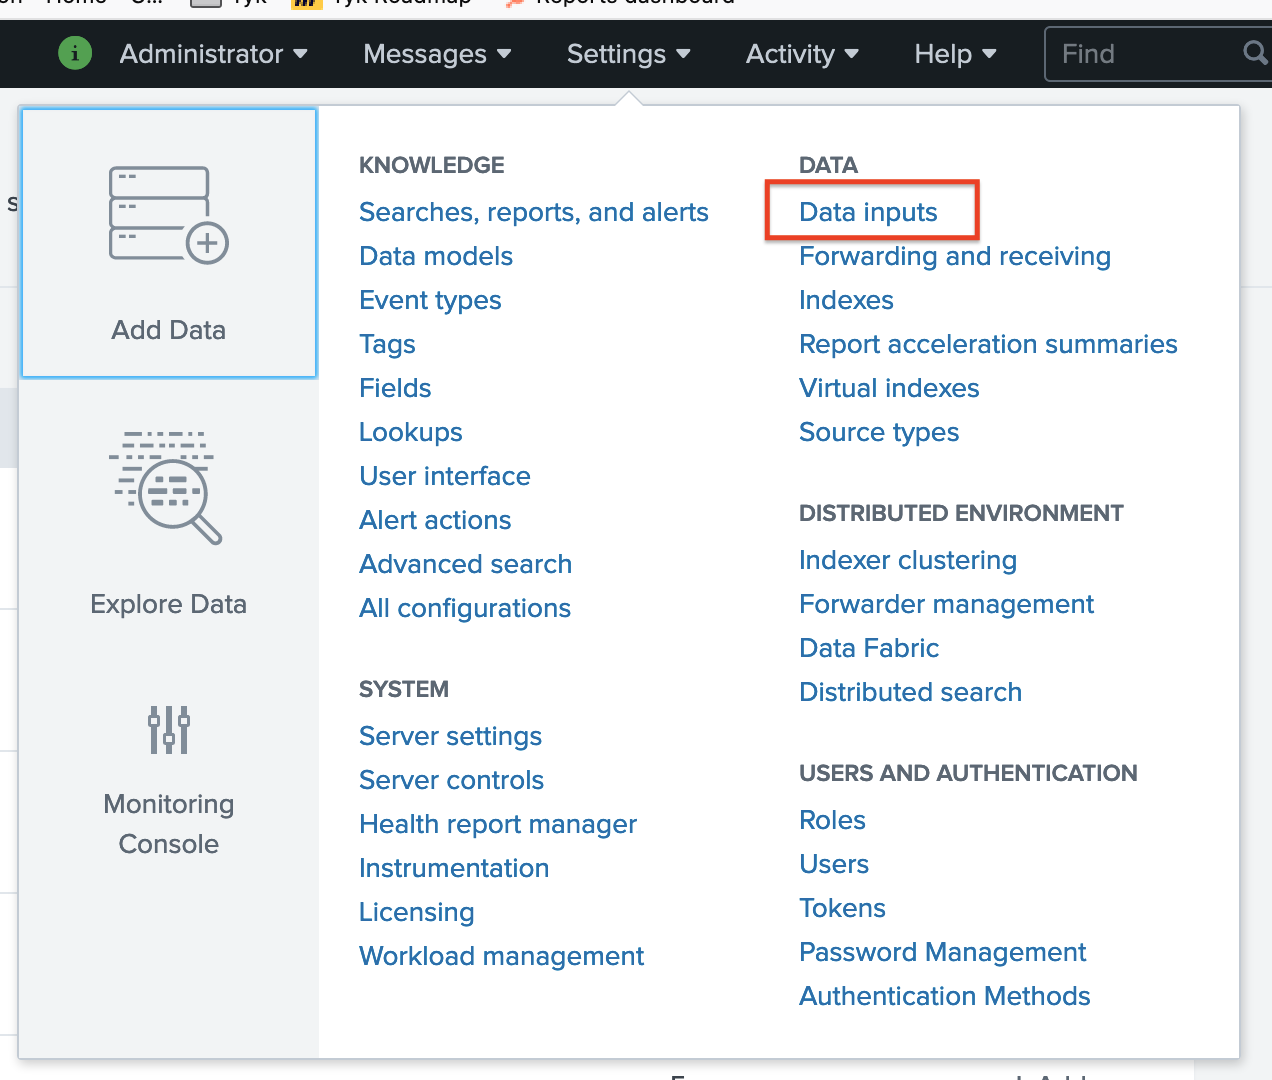
HTTP Event Collector -> Add New
-
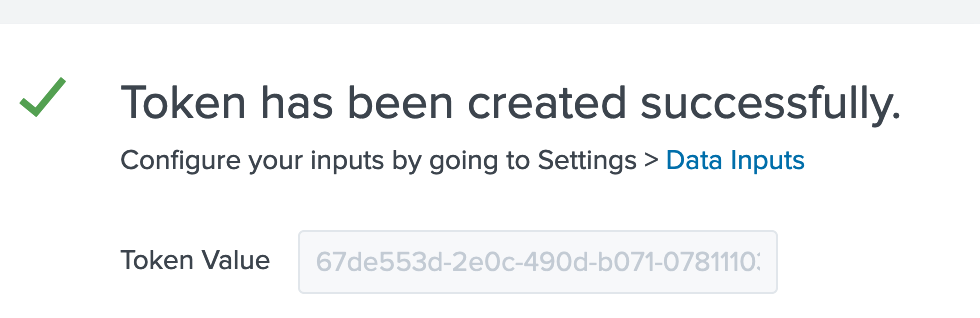
Add the Splunk bit to pump.conf
Edit your pump’s
pump.confand add this bit to the “Pumps” section, like so, adding the token from step #1: Make sure to add your token from the previous step into thecollector_tokenfield above
Make sure that the
localhost value matches with your setup. Head on over to our community forum to ask for help if you are stuck here.-
Restart Tyk Pump to pickup the Splunk config
If you are running Tyk Pump in Docker:
$ docker restart tyk-pump -
PROFIT!
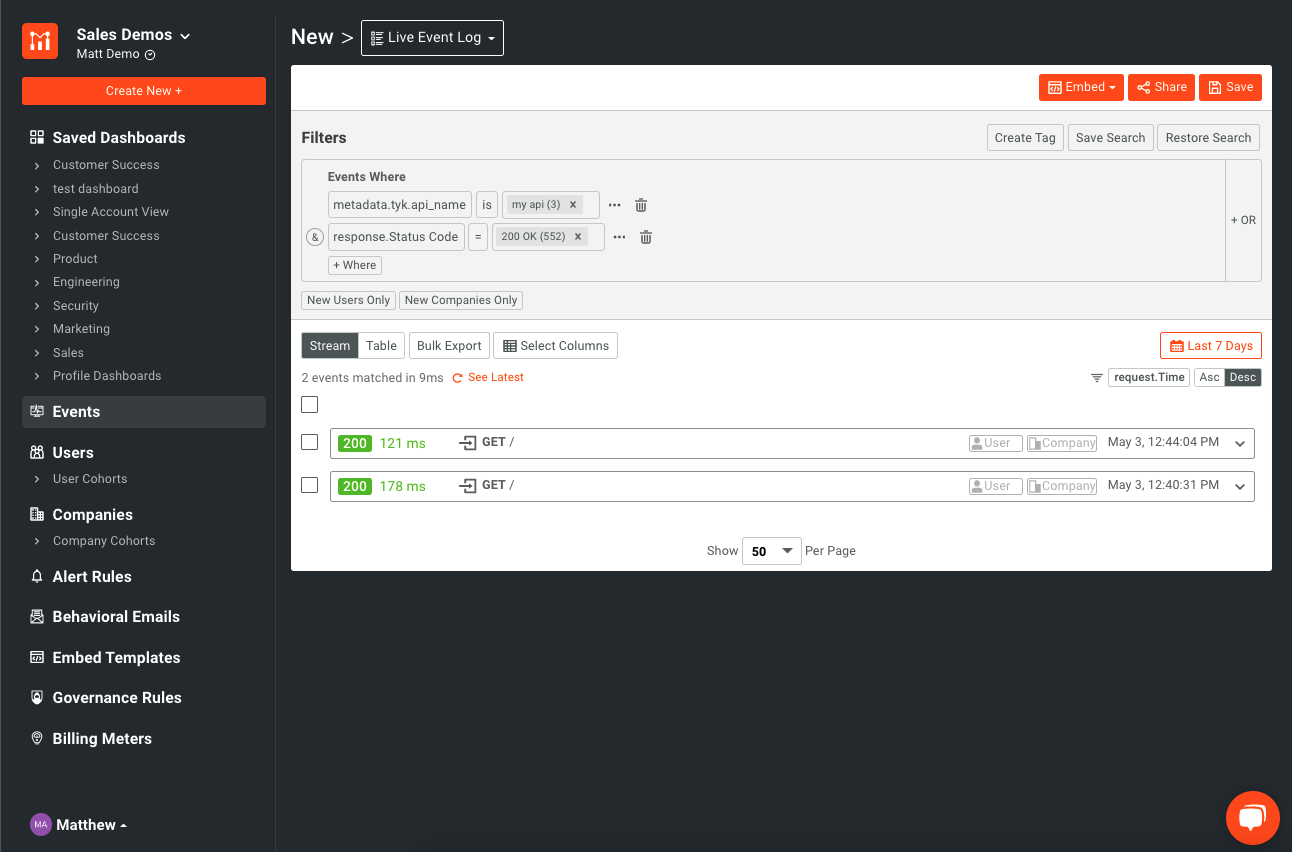
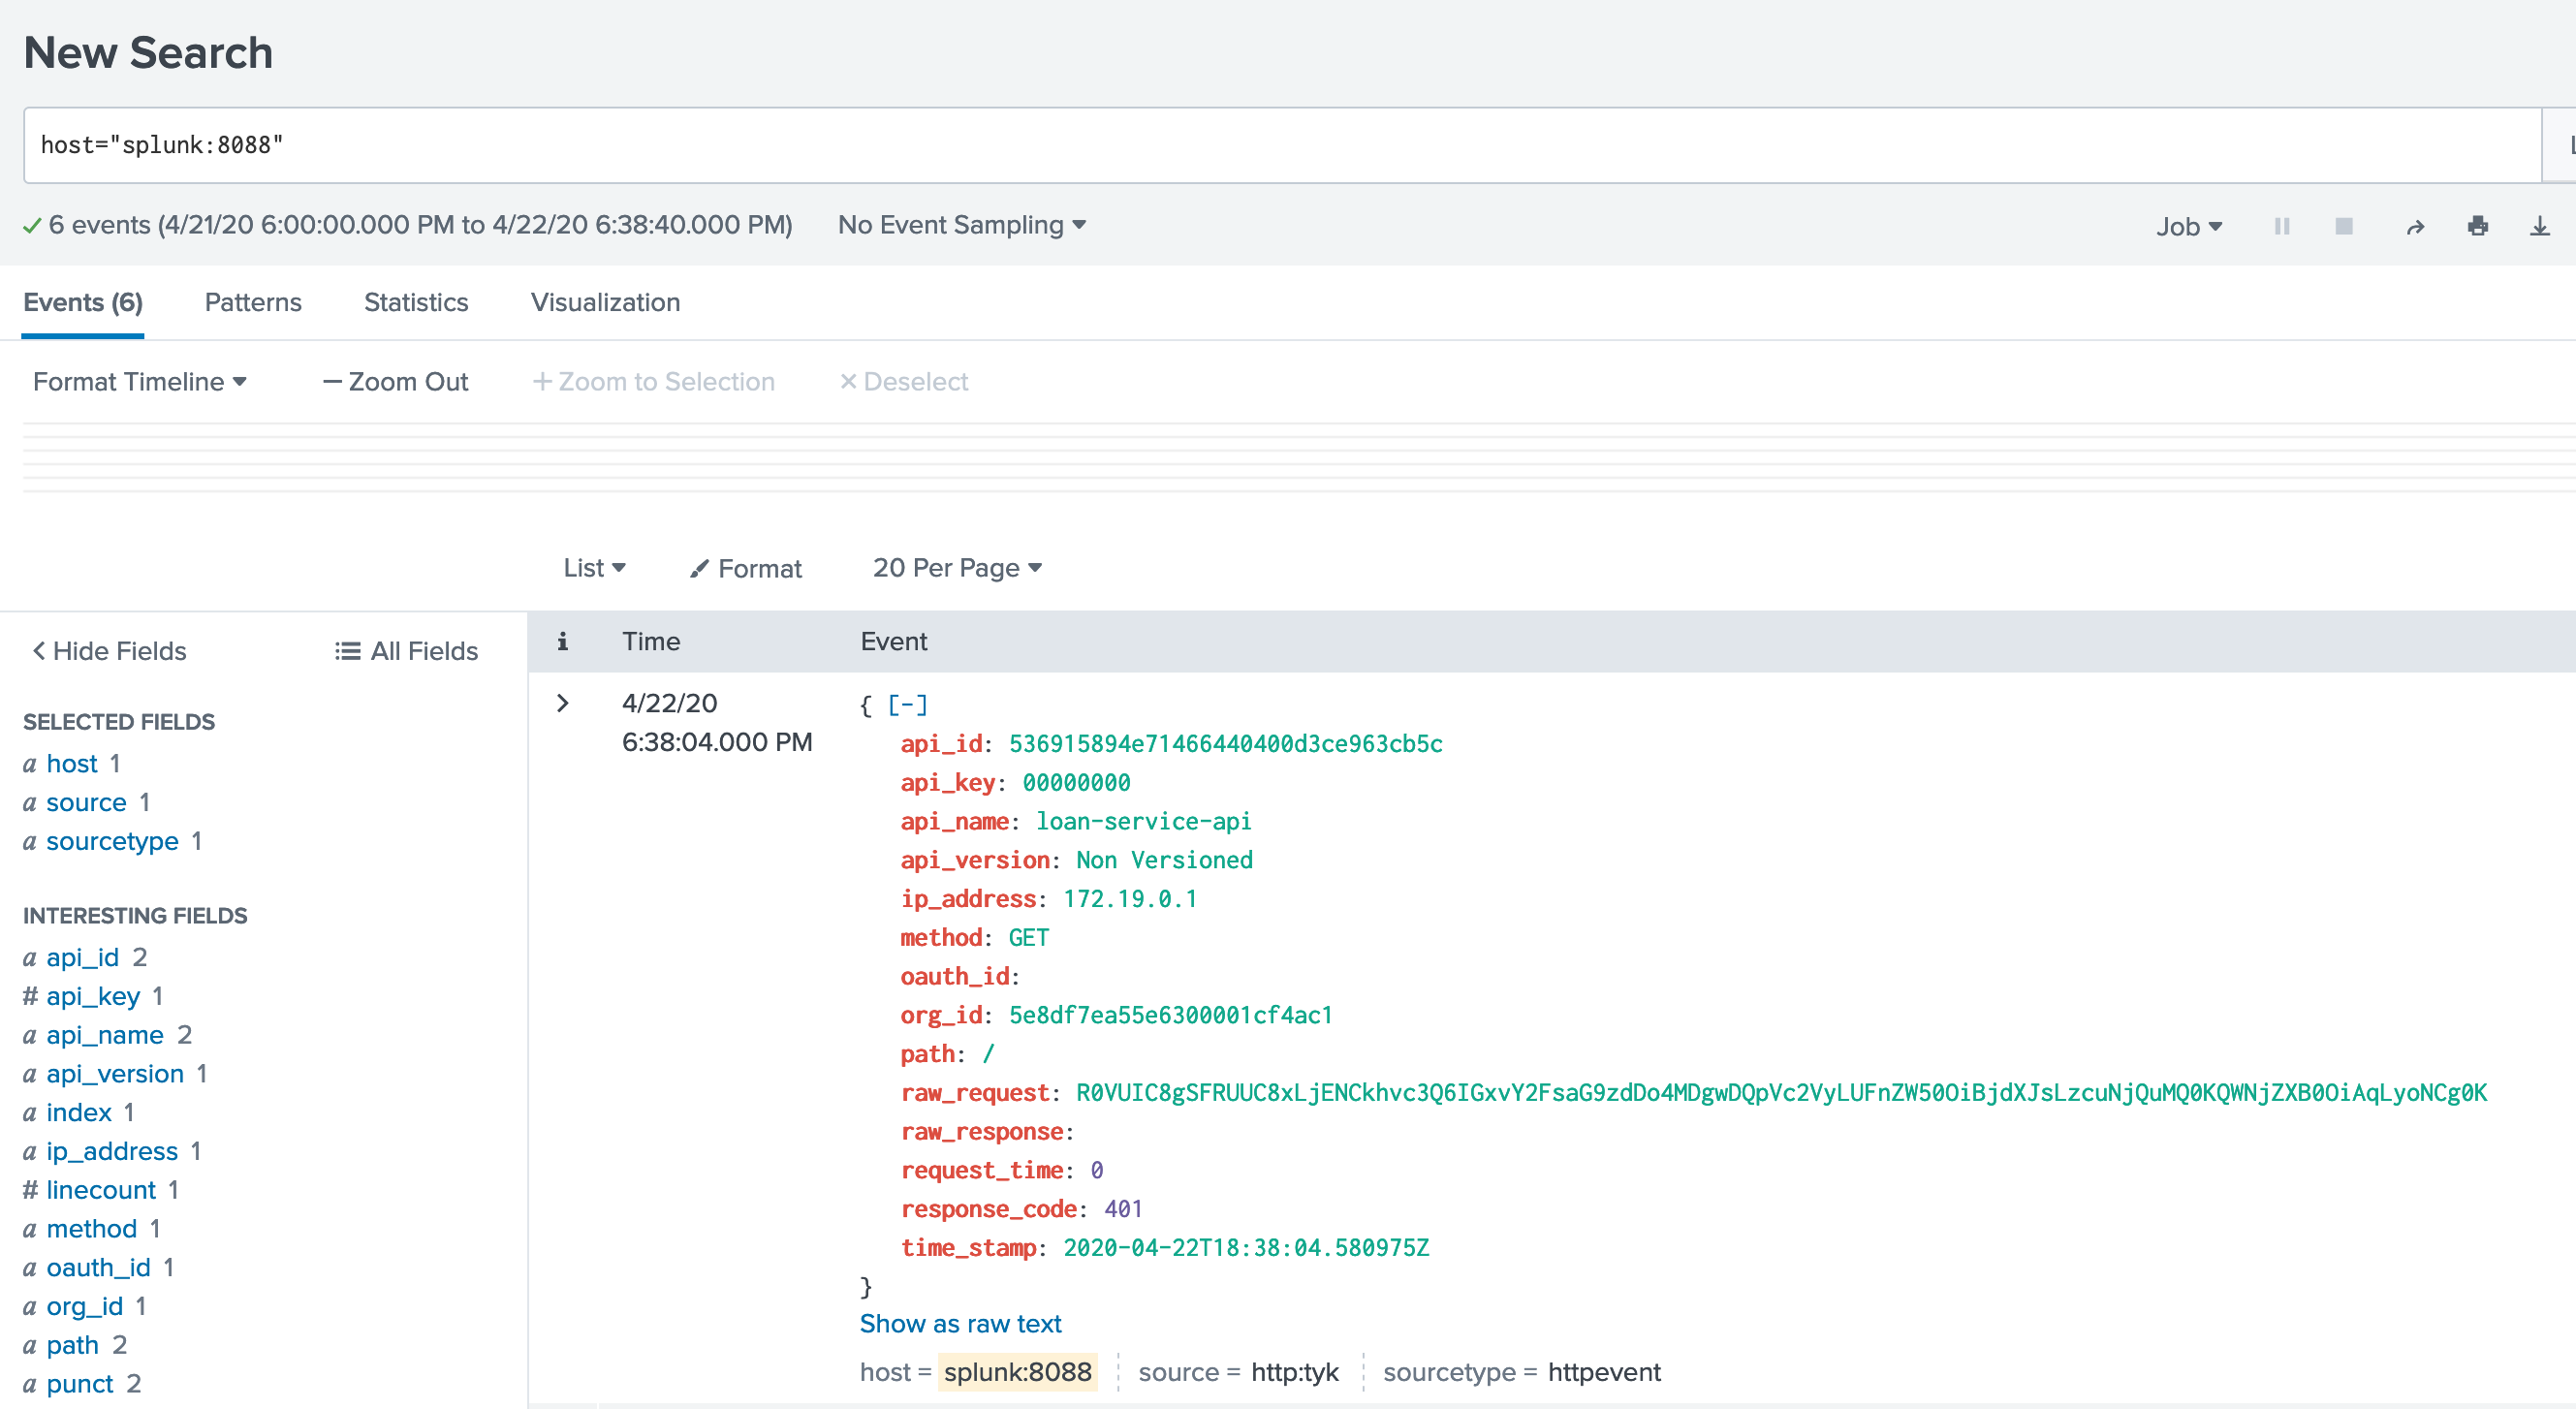
Let’s make a few API calls against Tyk, and see if they flow into Splunk
Success:
Logzio
Logz.io is a cloud-based log management and analytics platform that provides log management built on Elasticsearch, Logstash and Kibana.JSON / Conf file
Add the following configuration fields to the pumps section within yourpump.conf file:
Environment variables
Advanced configuration fields
meta.url: Use if you do not want to use the default Logz.io URL, for example when using a proxy. The default url ishttps://listener.logz.io:8071.meta.queue_dir: The directory for the queue.meta.drain_duration: This sets the drain duration (when to flush logs on the disk). The default value is3s.meta.disk_threshold: Set the disk queue threshold. Once the threshold is crossed the sender will not enqueue the received logs. The default value is98(percentage of disk).meta.check_disk_space: Set the sender to check if it crosses the maximum allowed disk usage. The default value istrue.
Tyk Analytics Record Fields
Below is a detailed list of each field contained within our Tyk Analytics Record that is sent from Tyk Pump.Method
Request method. Example:GET, POST.
Host
RequestHost header.
Remarks: Includes host and optional port number of the server to which the request was sent.
Example: tyk.io, or tyk.io:8080 if port is included.
Path
Request path. Remarks: Displayed in decoded form.Example:
/foo/bar for /foo%2Fbar or /foo/bar.
RawPath
Request path. Remarks: Original request path without changes just decoded.Example:
/foo/bar for /foo%2Fbar or /foo/bar.
ContentLength
RequestContent-Length header.
Remarks: The number of bytes in the request body.Example:
10 for request body 0123456789.
UserAgent
RequestUser-Agent header.
Example: curl/7.86.0.
Day
Request day. Remarks: Based onTimeStamp field.Example:
16 for 2022-11-16T03:01:54Z.
Month
Request month. Remarks: Based onTimeStamp field.Example:
11 for 2022-11-16T03:01:54Z.
Year
Request year. Remarks: Based onTimeStamp field.
Example: 2022 for 2022-11-16T03:01:54Z.
Hour
Request hour. Remarks: Based onTimeStamp field.Example:
3 for 2022-11-16T03:01:54Z.
ResponseCode
Response code. Remarks: Only contains the integer element of the response code. Can be generated by either the gateway or upstream server, depending on how the request is handled.Example:
200 for 200 OK.
APIKey
Request authentication key. Remarks: OAuthentication key, as provided in request. If no API key is provided then gateway will substitute a default value.Example: Unhashed
auth_key, hashed 6129dc1e8b64c6b4, or 00000000 if no authentication provided.
TimeStamp
Request timestamp. Remarks: Generated by the gateway, based on the time it receives the request from the client.Example:
2022-11-16T03:01:54.648+00:00.
APIVersion
Version of API Definition requested. Remarks: Based on version configuration of context API definition. If API is unversioned then value is “Not Versioned”.Example: Could be an alphanumeric value such as
1 or b. Is Not Versioned if not versioned.
APIName
Name of API Definition requested. Example:Foo API.
APIID
Id of API Definition requested. Example:727dad853a8a45f64ab981154d1ffdad.
OrgID
Organization Id of API Definition requested. Example:5e9d9544a1dcd60001d0ed20.
OauthID
Id of OAuth client. Remarks: Value is empty string if not using OAuth, or OAuth client not present.Example:
my-oauth-client-id.
RequestTime
Duration of upstream roundtrip. Remarks: Equal to value ofLatency.Total field.
Example: 3 for a 3ms roundtrip.
RawRequest
Raw HTTP request. Remarks: Base64 encoded copy of the request sent from the gateway to the upstream server.Example:
R0VUIC9nZXQgSFRUUC8xLjEKSG9zdDogdHlrLmlv.
RawResponse
Raw HTTP response. Remarks: Base64 encoded copy of the response sent from the gateway to the client.Example:
SFRUUC8xLjEgMjAwIE9LCkNvbnRlbnQtTGVuZ3RoOiAxOQpEYXRlOiBXZWQsIDE2IE5vdiAyMDIyIDA2OjIxOjE2IEdNVApTZXJ2ZXI6IGd1bmljb3JuLzE5LjkuMAoKewogICJmb28iOiAiYmFyIgp9Cg==.
IPAddress
Client IP address. Remarks: Taken from eitherX-Real-IP or X-Forwarded-For request headers, if set. Otherwise, determined by gateway based on request.Example:
172.18.0.1.
Geo
Client geolocation data. Remarks: Calculated using MaxMind database, based on client IP address.Example:
{"country":{"isocode":"SG"},"city":{"geonameid":0,"names":{}},"location":{"latitude":0,"longitude":0,"timezone":""}}.
Network
Network statistics. Remarks: Not currently used.Latency
Latency statistics Remarks: Contains two fields;upstream is the roundtrip duration between the gateway sending the request to the upstream server and it receiving a response. total is the upstream value plus additional gateway-side functionality such as processing analytics data.Example:
{"total":3,"upstream":3}.
We record the round trip time of the call from the gateways reverse proxy. So what you get is the sum of
leaving Tyk -> upstream -> response received back at Tyk.Tags
Session context tags. Remarks: Can contain many tags which refer to many things, such as the gateway, API key, organization, API definition etc.Example:
["key-00000000","org-5e9d9544a1dcd60001d0ed20","api-accbdd1b89e84ec97f4f16d4e3197d5c"].
Alias
Session alias. Remarks: Alias of the context authenticated identity. Blank if no alias set or request is unauthenticated.Example:
my-key-alias.
TrackPath
Tracked endpoint flag. Remarks: Value istrue if the requested endpoint is configured to be tracked, otherwise false.Example:
true or false.
ExpireAt
Future expiry date. Remarks: Can be used to implement automated data expiry, if supported by storage.Example:
2022-11-23T07:26:25.762+00:00.
API Traffic Logs
Gateway Only API Traffic logs (also called Traffic Analytics) are comprehensive records of all API requests processed by Tyk Gateway. They capture detailed information about each request and response for analysis and reporting purposes.API Traffic logs are not written to stdout/stderr, unlike application and access logs. Instead, they are stored in Redis, then processed and forwarded by Tyk Pump to configured data sinks, such as databases or other external tools.
How API Traffic Logging Works
When a client makes a request to the Tyk Gateway, the details of the request and response are captured and stored in Redis. Tyk Pump reads the API traffic records from Redis every 10 seconds and then flushes them after processing. It processes the records and forwards them to the configured data sinks, such as databases or other external tools. You can configure multiple pumps to send different types of data to different sinks. This setup allows you to route raw or processed analytics data wherever you need it. The Mongo Aggregate Pump and SQL Aggregate Pump aggregate raw analytics records before storing the summarized statistics in MongoDB or SQL databases. When you use Tyk Dashboard, the Aggregate Pump collates this aggregated data and displays it in the analytics UI.Configure API Traffic Logs
You can enable API traffic logging at the Gateway level by setting theenable_analytics field in the configuration file or by defining the equivalent environment variable, TYK_GW_ENABLEANALYTICS.
To prevent transaction records from being generated for specific endpoints, enable the do-not-track middleware on those endpoints. This approach gives you fine-grained control over request tracking.
For a complete list of analytics configuration options available in the Gateway, refer to the analytics configuration reference documentation.
To use analytics in the Tyk Dashboard, configure both per-request and aggregated pumps for your chosen database platform. For step-by-step guidance, see the Setup Dashboard Analytics section.
Configure Detailed Recording
By default, the Tyk Gateway does not include request and response payloads in API traffic logs. This behavior keeps log records small and reduces the risk of capturing sensitive data. You can configure Tyk Gateway to capture request and response payloads in the API traffic log when required. Tyk refers to this capability as detailed recording. You can enable it at different levels of granularity, following this order of precedence:- Be aware that enabling detailed recording increases the size of the records and will require more storage space, as Tyk will store the entire request and response in wire format.
- Tyk Cloud users can enable detailed recording per-API following the instructions on this page or, if required at the Gateway level, via a support request. The traffic logs are subject to the subscription’s storage quota, so we recommend enabling detailed logging only if necessary to avoid unnecessary costs.
- API Level
- Key Level
- Gateway Level
You can enable detailed recording for an individual API by setting the server.detailedActivityLogs.enabled flag within the Tyk Vendor Extension.In the Dashboard UI, you can configure detailed recording using the Record payload in traffic logs option in the API Designer.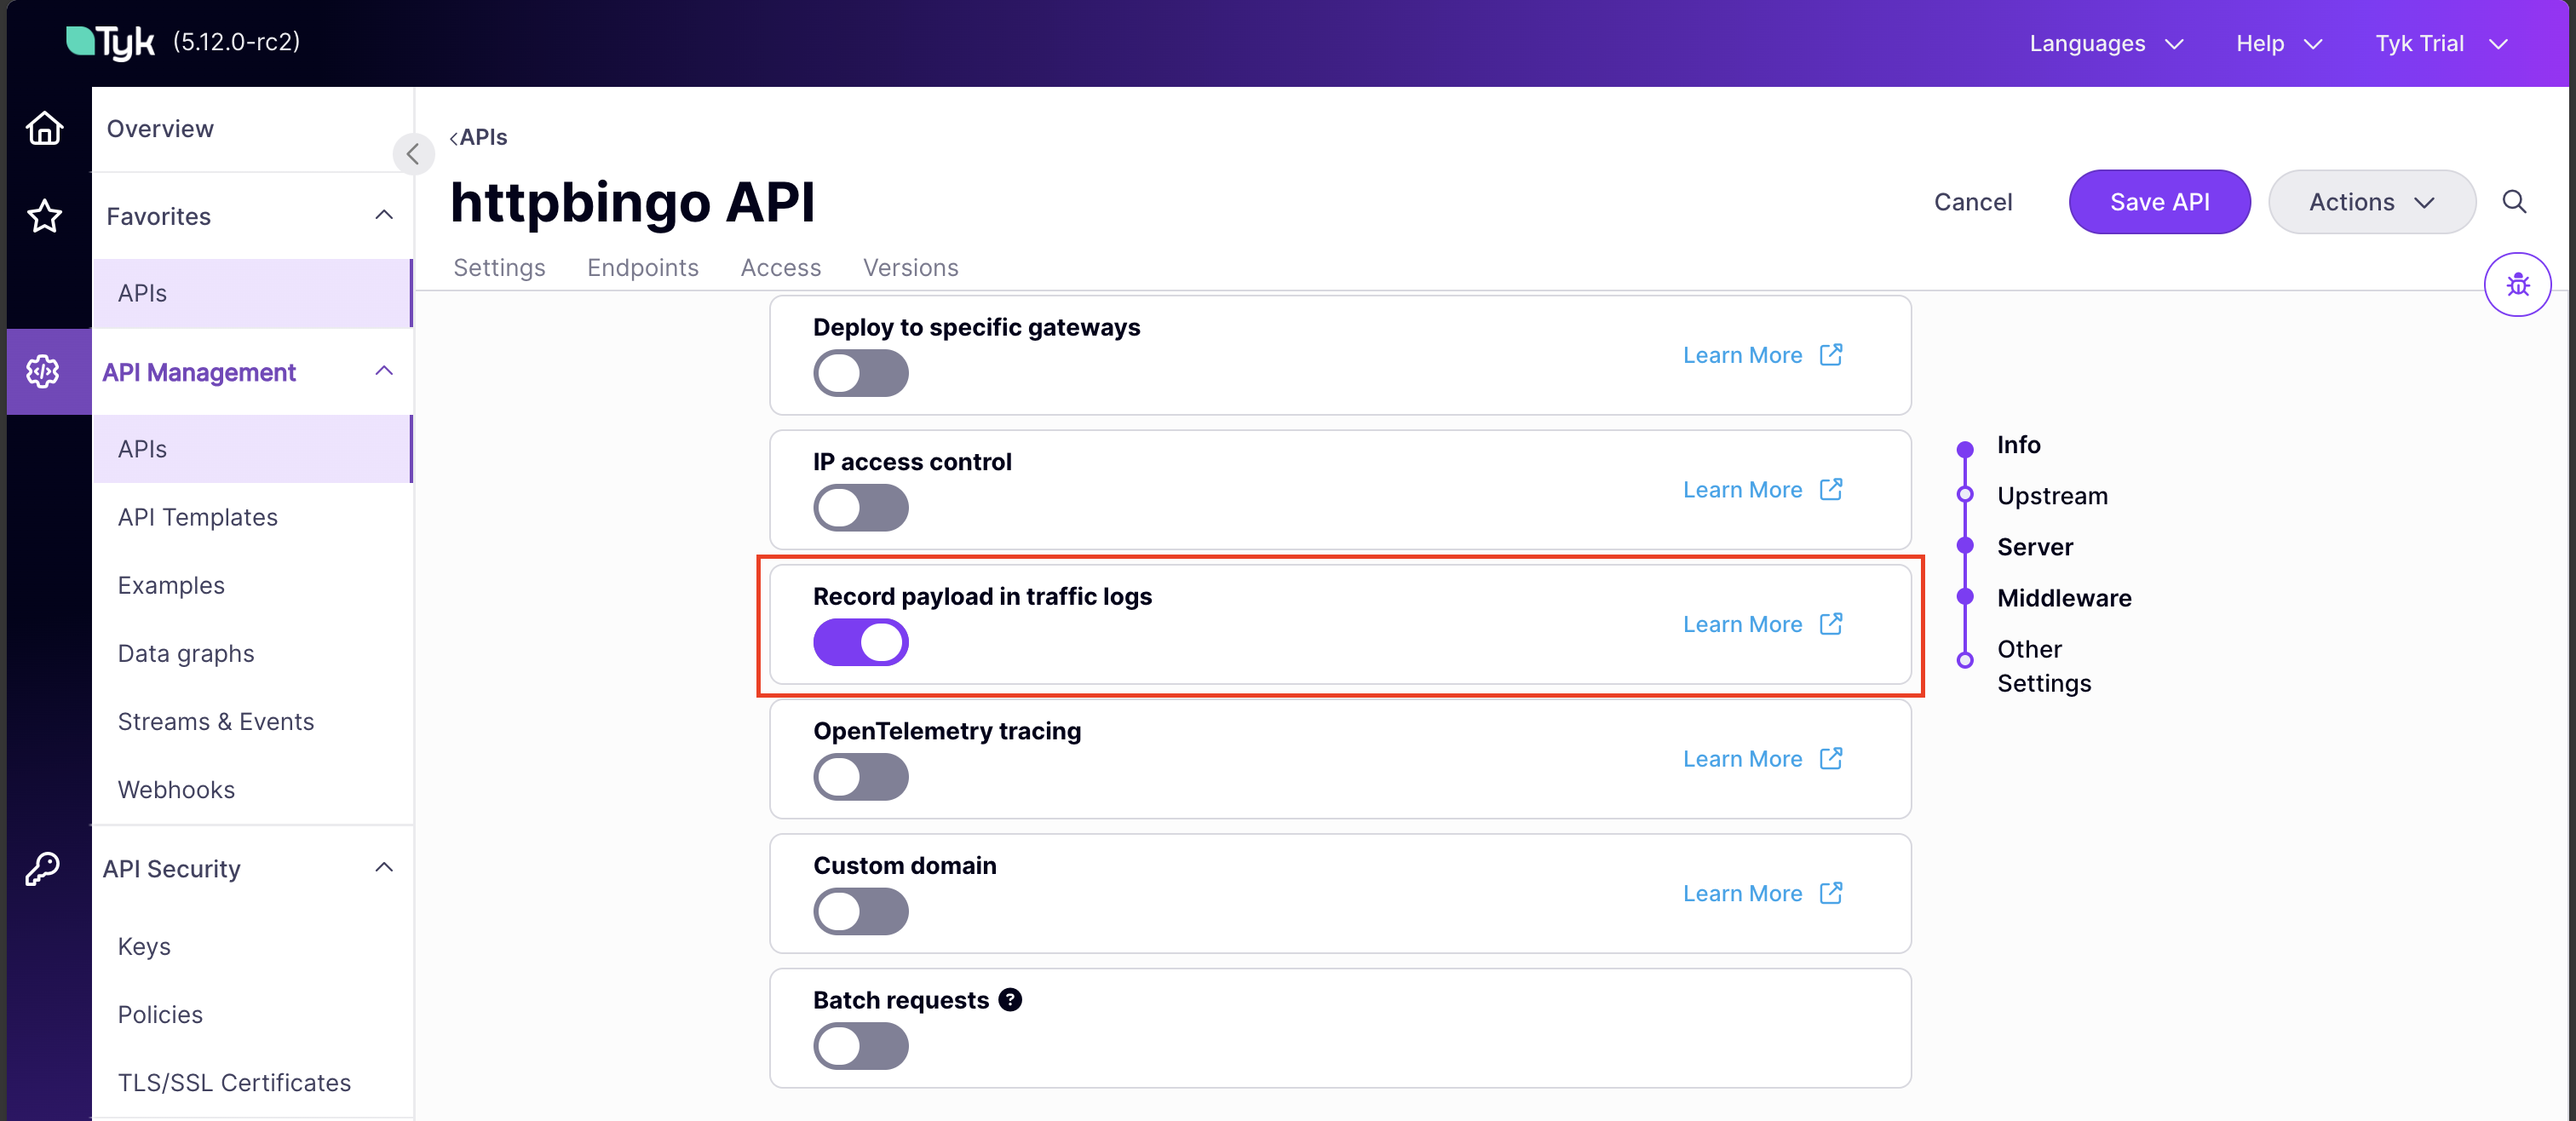
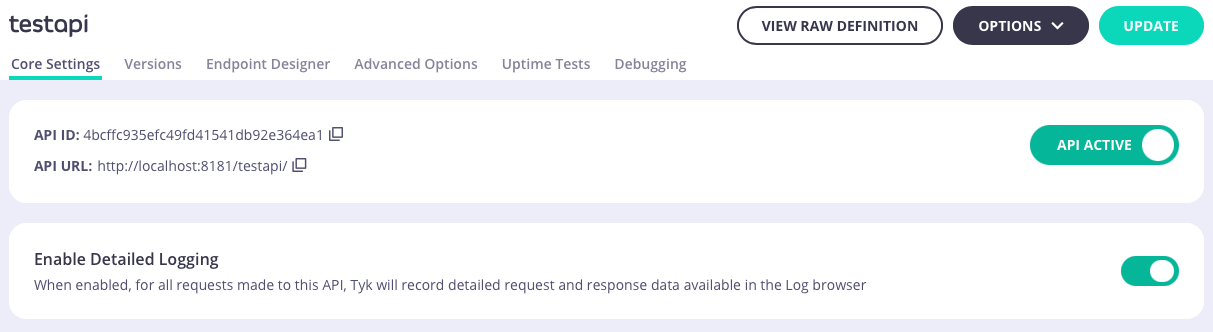
enable_detailed_recording flag in the root of the API definition.In the Tyk Classic API Designer, the Enable Detailed Logging option can be found in Core Settings.spec.enable_detailed_recording to true, as in this example:Aggregated Analytics
The traffic logs generated by the Tyk Gateway are stored in the local Redis temporal storage. They must be transferred to a persistent data store (such as MongoDB or PostgreSQL) for use by analytics tools, typically using Tyk Pump. Tyk Pump can also generate aggregated statistics from these data using the dedicated Mongo Aggregate and SQL Aggregate pumps. These offload processing from the Tyk Dashboard and reduce storage requirements compared to storing all raw logs. The aggregate pumps calculate statistics from the analytics records, aggregated by hour, for the following keys in the traffic logs:| Key | Analytics aggregated by | Dashboard screen |
|---|---|---|
APIID | API proxy | Activity by API |
TrackPath | API endpoint | Activity by endpoint |
ResponseCode | HTTP status code (success/error) | Activity by errors |
APIVersion | API version | n/a |
APIKey | Client access key/token | Activity by Key |
OauthID | OAuth client (if OAuth used) | Traffic per OAuth Client |
Geo | Geographic location of client | Activity by location |
Custom Aggregation Keys
Whereas Tyk Pump will automatically produce aggregated statistics for the keys in the previous section, you can also define custom aggregation keys using Tyk’s custom analytics tag feature, which identifies specific HTTP request headers to be used as aggregation keys. This has various uses, for example- You need to record additional information from the request into the analytics but want to avoid detailed logging due to the volume of traffic logs.
- You wish to track a group of API requests, for example:
- Show me all API requests where
tenant-id=123 - Show me all API requests where
user-group=abc
- Show me all API requests where
middleware.global section of the Tyk Vendor Extension, within the trafficLogs section. Custom aggregation tags are specified as a list of HTTP headers in middleware.global.trafficLogs.tagHeaders that Tyk should use for generation of custom aggregation tags for the API.
For example if we include the header name x-user-id in the list of headers, then Tyk will create an aggregation key for each different value observed in that header. These aggregation keys will be given the name <header_name>-<header_value>, for example x-user-id-1234 if the request contains the HTTP header "x-user-id":1234.
Tyk Classic APIs
If you are using Tyk Classic APIs, then the equivalent field in the API definition is tag_headers.
In the Tyk Classic API Designer, the Tag Headers option can be found in Advanced Options.
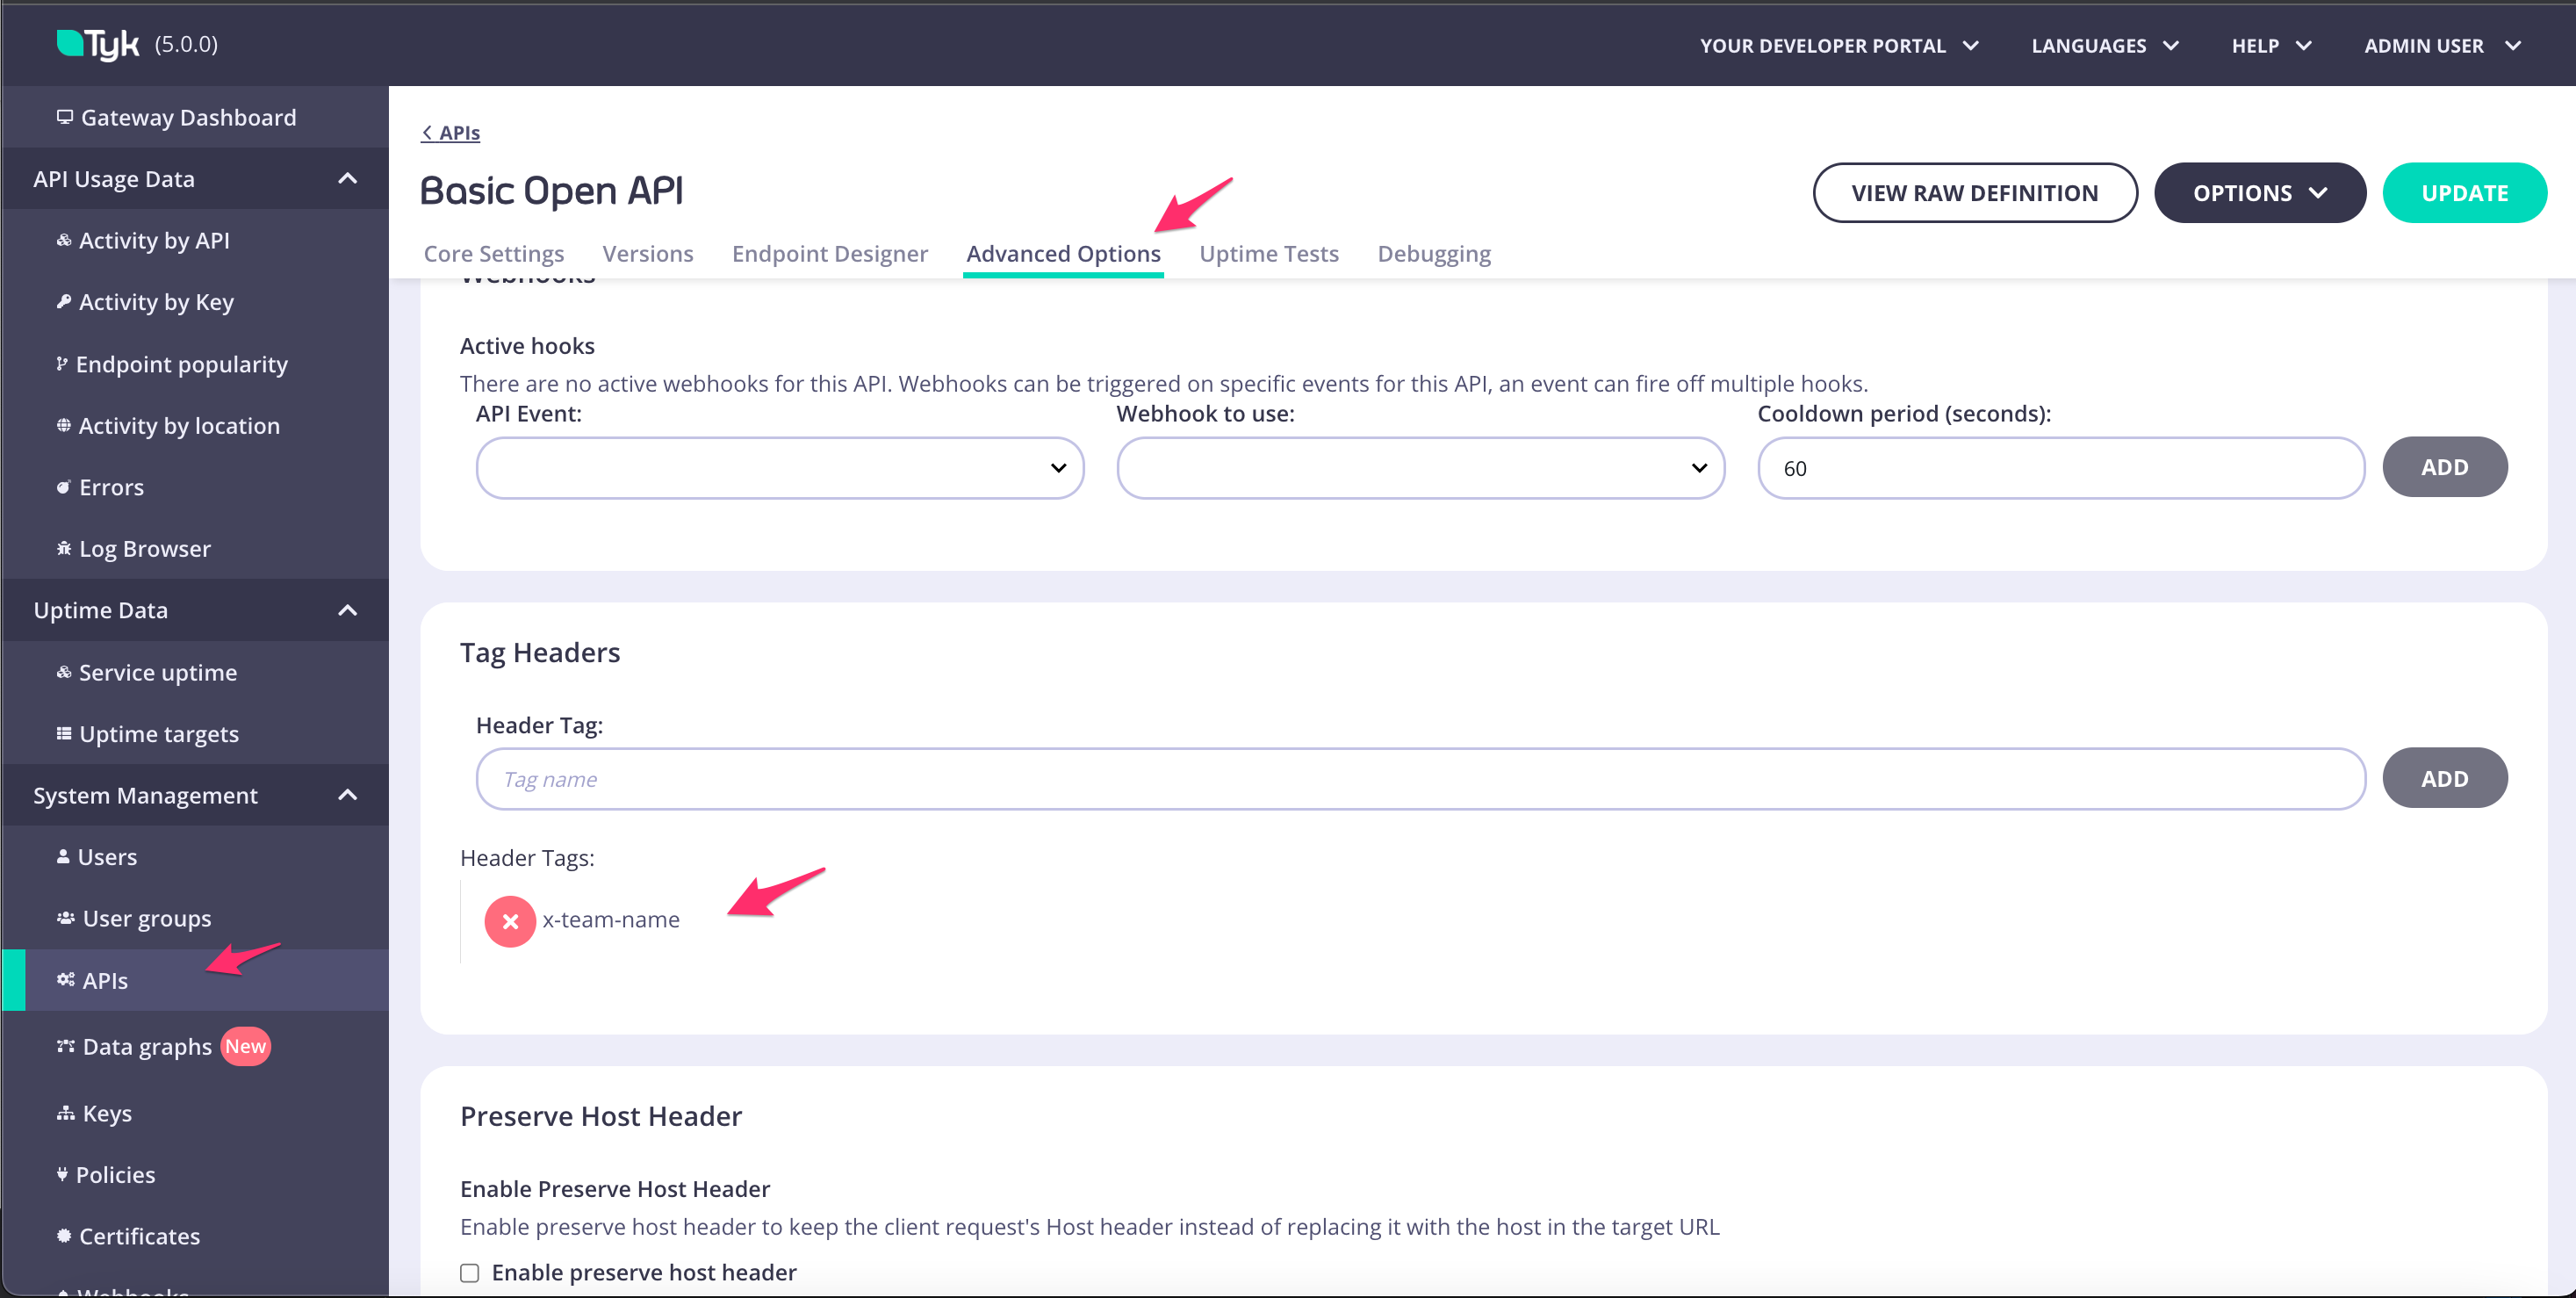
spec.tag_headers to true, as in this example:
Host and User-Agent headers exist within the tag_headers array. For each incoming request, Tyk will add host-<header_value> and user-agent-<header_value> tags to the traffic log.
Suppressing generation of aggregates for custom keys
If you don’t want or need aggregated analytics for the headers you record with tagHeaders, you can configure Tyk Pump (or Tyk MDCB if it is performing the pump functionality) to discard those statistics when writing to the persistent analytics store.
For both cases, you add the tags you want to ignore, or their prefixes, to the ignore_tag_prefix_list field in the appropriate configuration file or environment variable:
If you add headers to the tags list that are unique to each request, such as a timestamp or unique request Id, then Tyk Gateway will essentially create an aggregation point per request and the number of these tags in an hour will be equal to the number of requests. Since there’s no real value in aggregating something that has a total of one, we recommend that you add such headers to the ignore list.
Monitor your APIs with Prometheus
Your Tyk Pump can expose Prometheus metrics for the requests served by your Tyk Gateway. This is helpful if you want to track how often your APIs are being called and how they are performing. Tyk collects latency data of how long your services take to respond to requests, how often your services are being called and what status code they return. We have created a demo project in GitHub if you want to see this setup in action.Prerequisites
- A Tyk installation (either Self-Managed or Open Source Gateway)
- Tyk Pump 1.6 or higher
Configure Tyk Pump to expose Prometheus metrics
Prometheus collects metrics from targets by scraping metrics HTTP endpoints. To expose Tyk’s metrics in the Prometheus format, you need to add the following lines to your Tyk Pump configuration filepump.conf:
Host
<tyk-pump> with your host name or IP address.
Docker
http://<tyk-pump>:9090 from your browser.
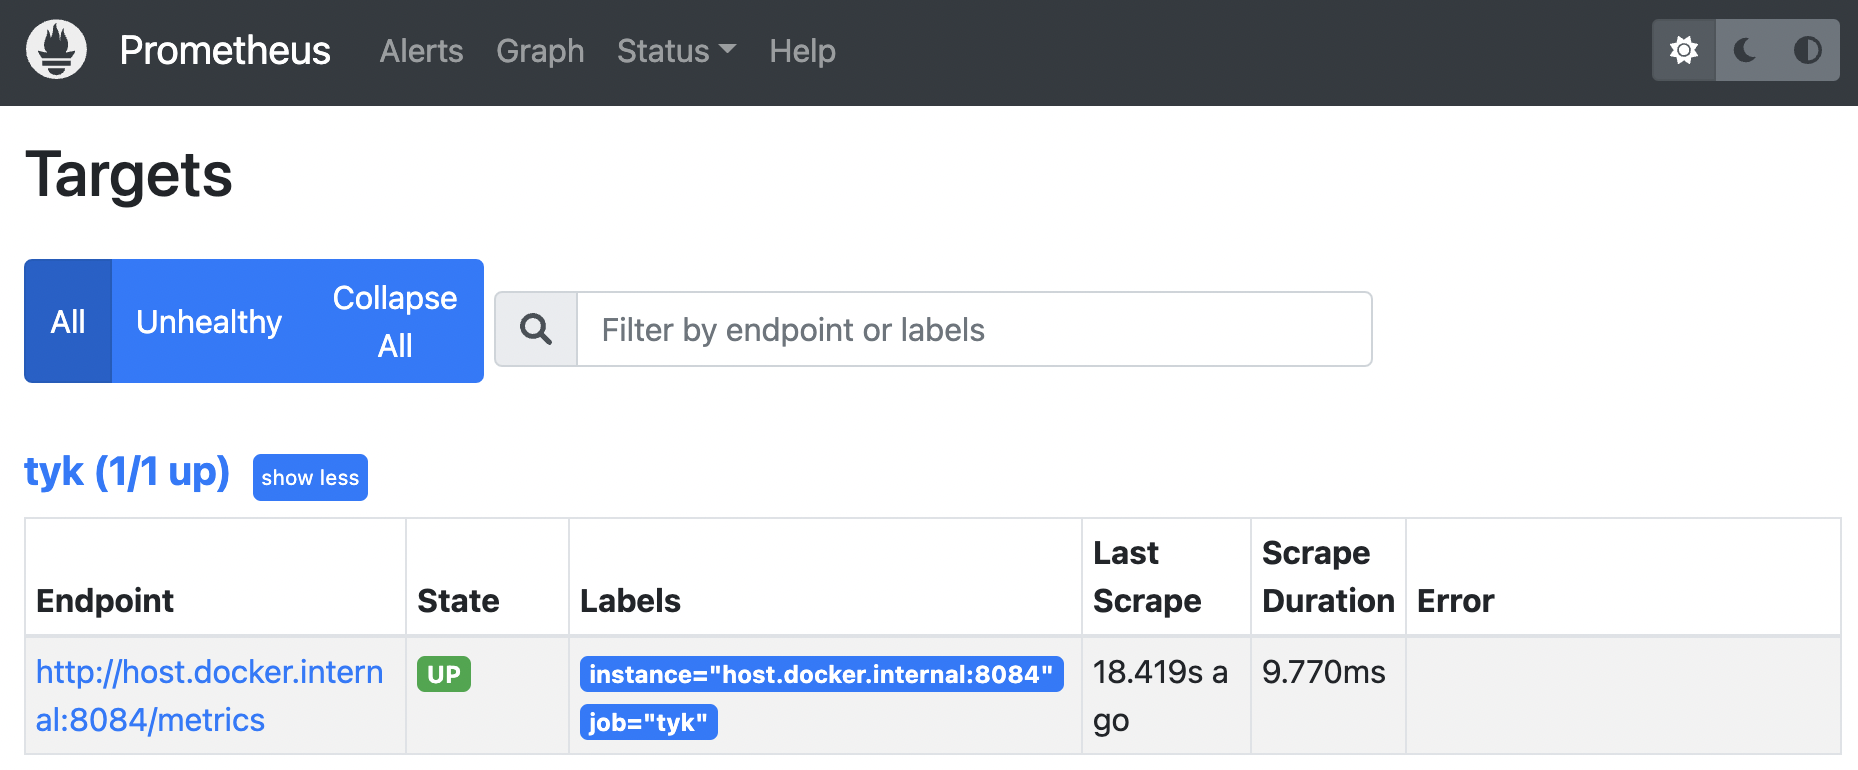
Configure Prometheus to scrape the metrics endpoint
Prometheus is configured via a configuration file where you can define the metrics endpoint Prometheus will scrape periodically. Here’s an example configuration scraping Tyk Pump metric endpoints:Host
Docker
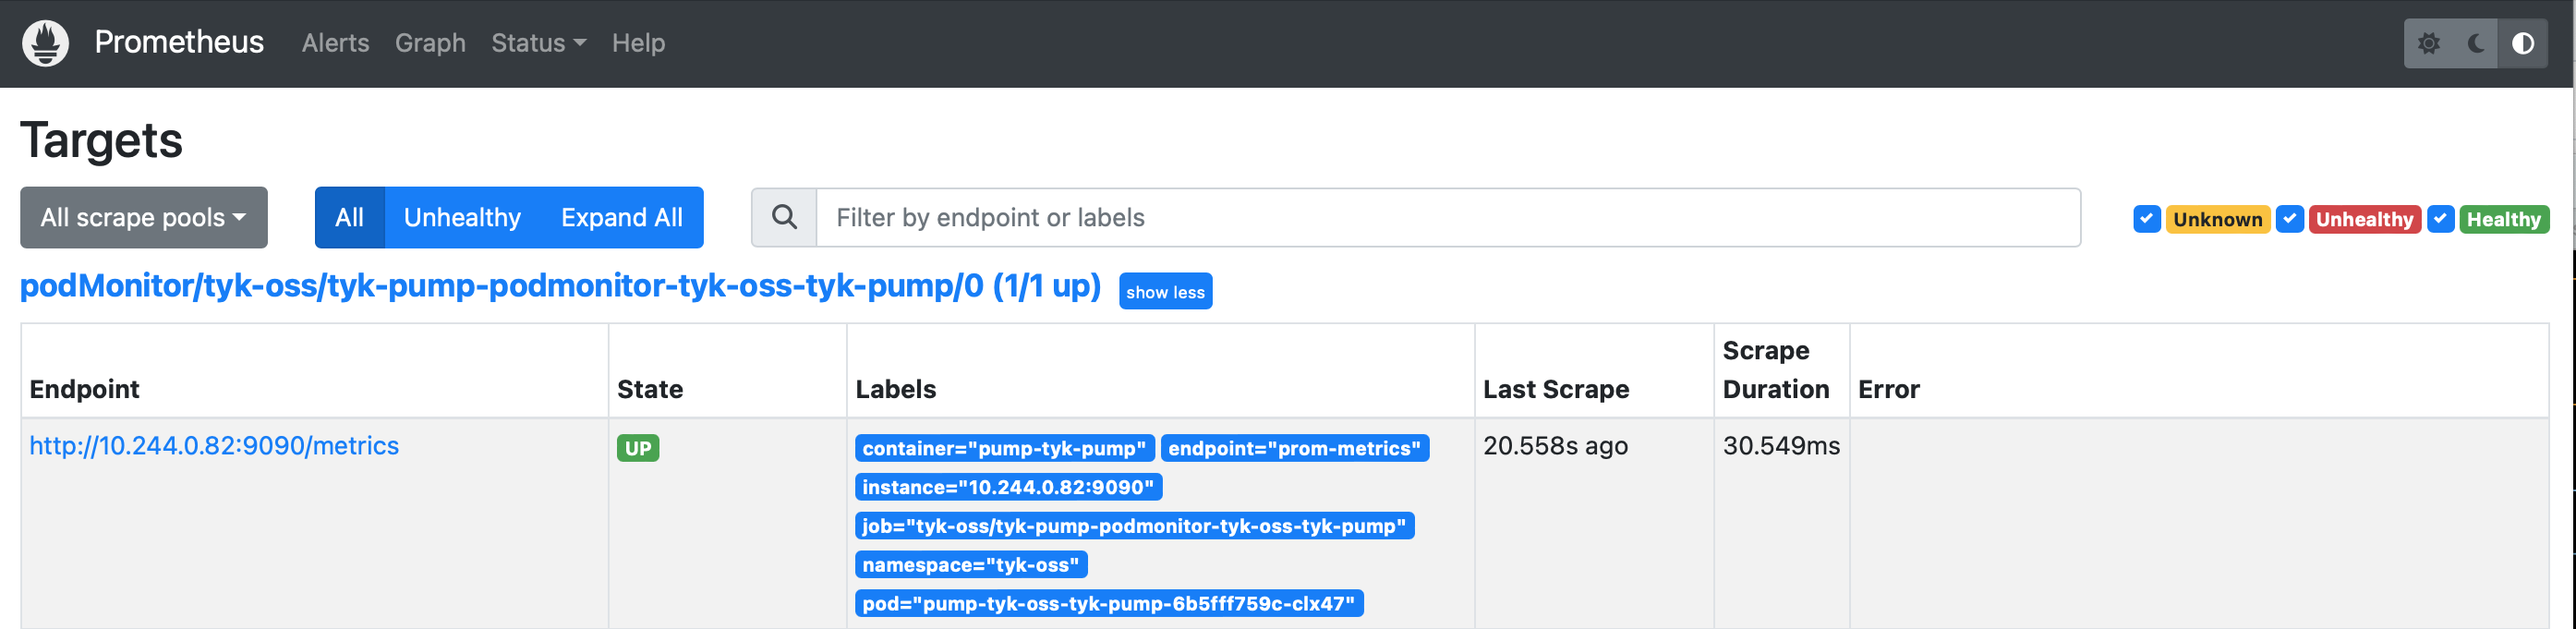
- Then restart your Prometheus instance after any configuration change
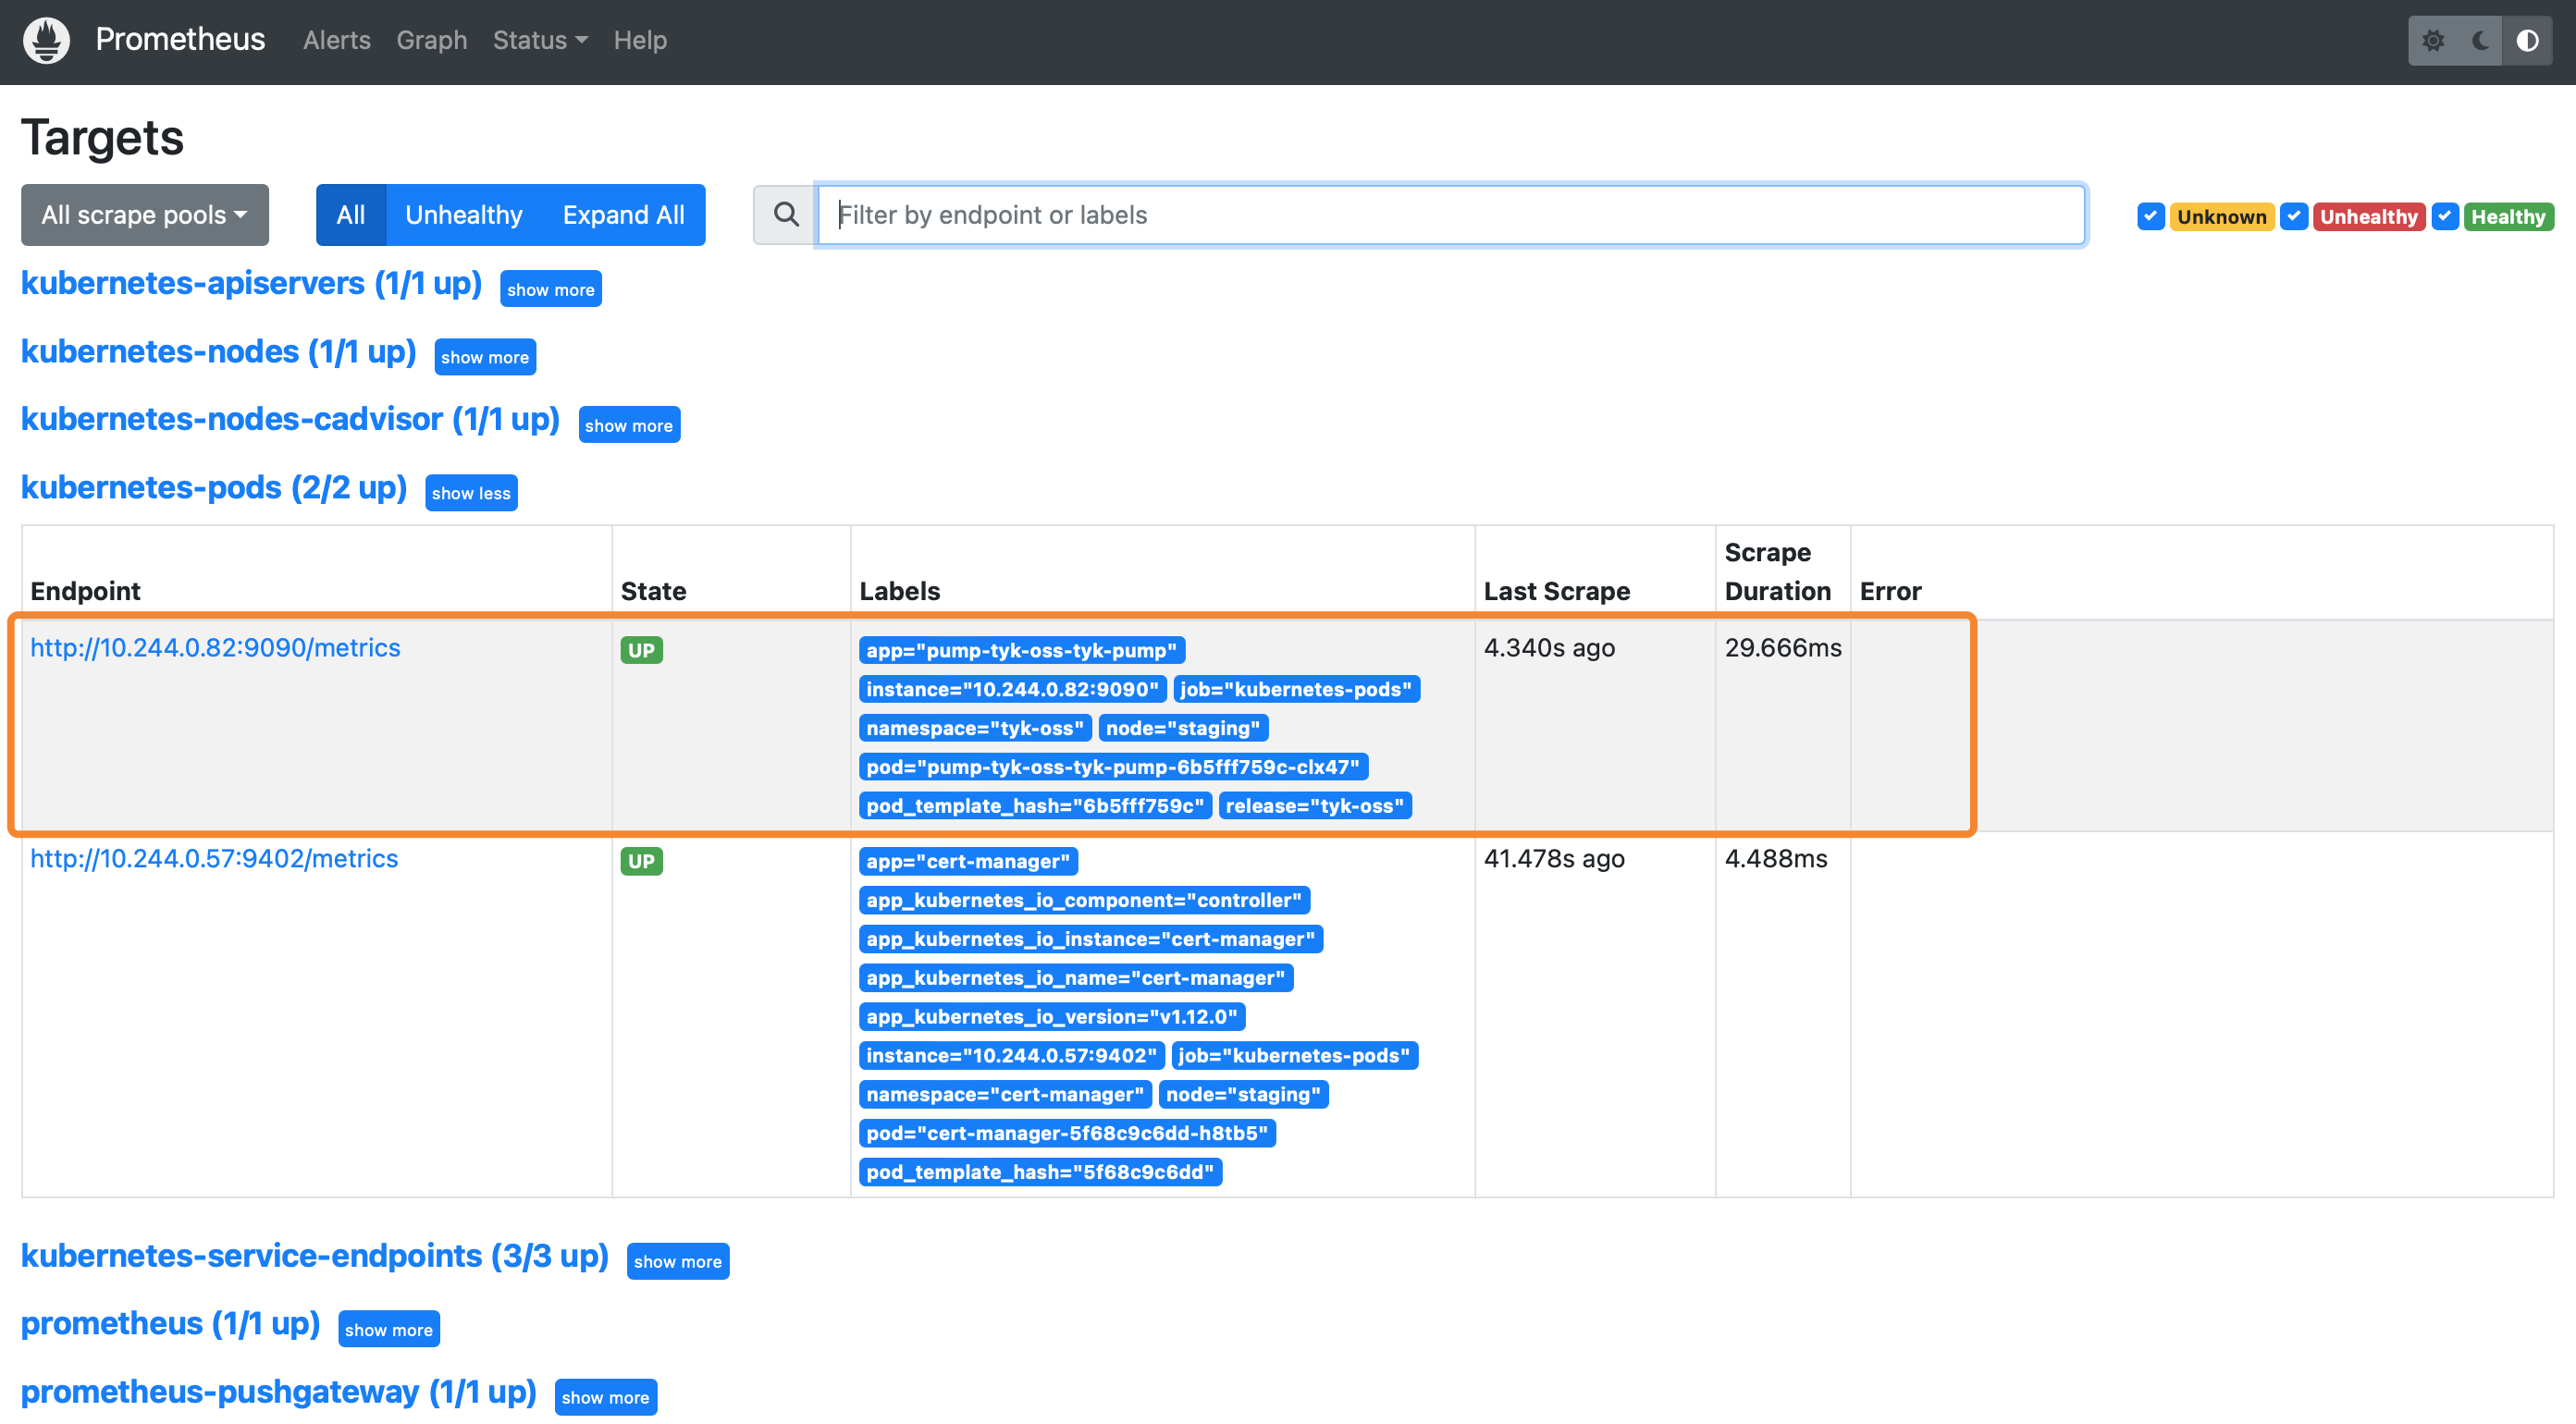
- In Prometheus under “Status” / “Targets”, we can see that Prometheus is able to scrape the metrics successfully: state is UP.
Exploring your metrics in Grafana
Before trying out, make sure to generate traffic by calling your APIs. You will find a couple of useful queries in our Tyk Pump GitHub repo based on the metrics exposed by Tyk. These will demonstrate which metric types are exported and how you can customize them. You also need to make sure that Grafana is connected to your Prometheus server. This can be configured under Configuration / Data sources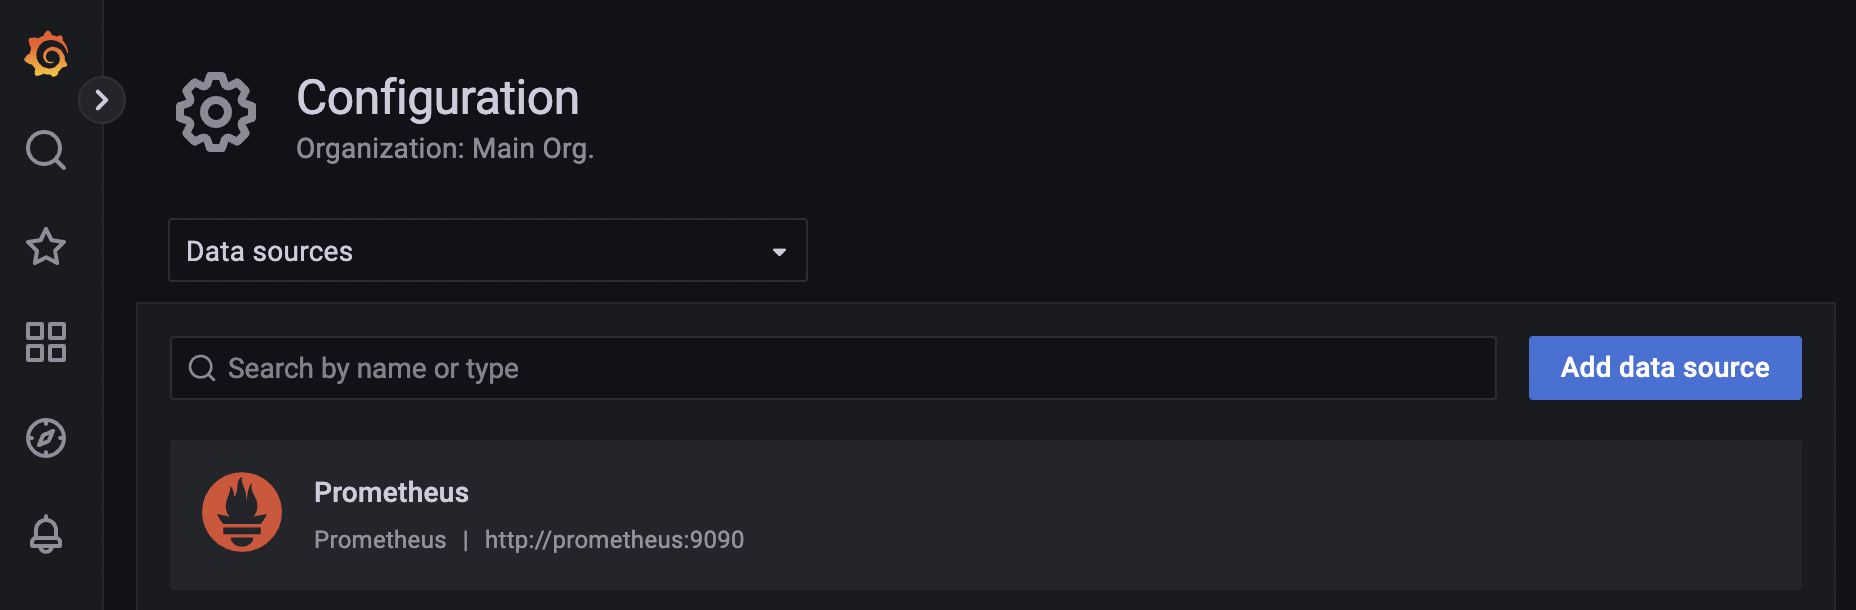
Useful queries
Here are some useful queries to help you monitor the health of your APIs:Upstream time across all services
Tyk collects latency data of how long your upstream services take to respond to requests. This data can be used to configure an alert if the latency goes beyond a certain threshold. This query calculated the 95th percentile of the total request latency of all the upstream services. To run the query: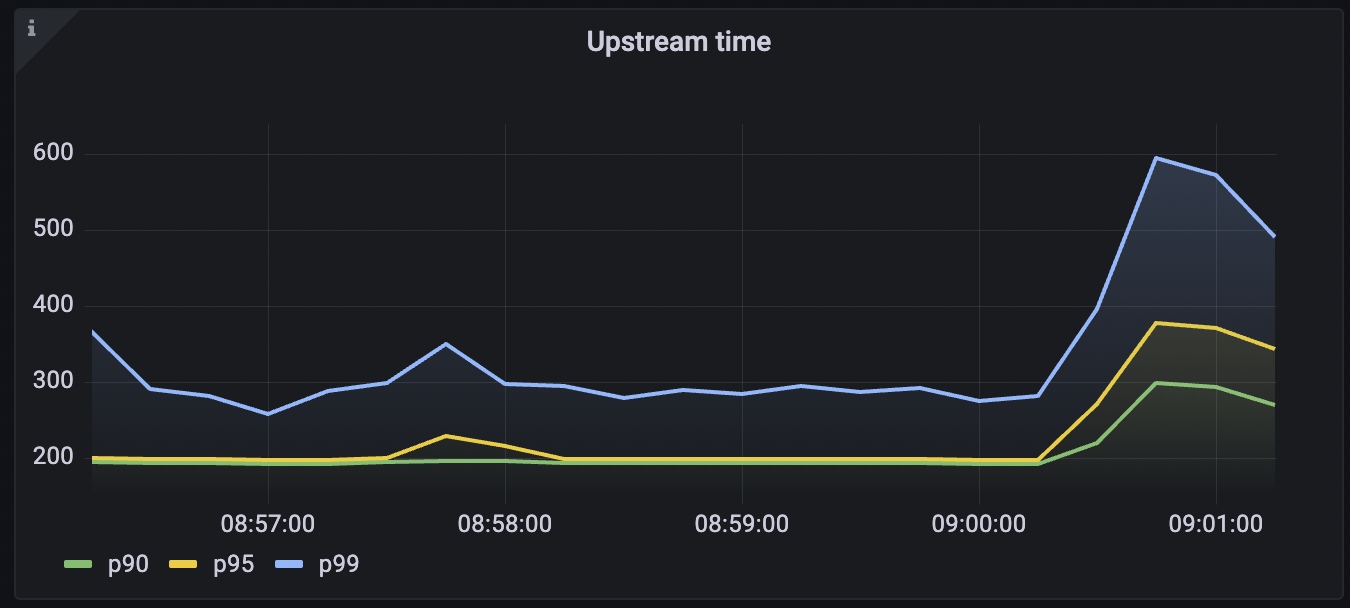
Upstream time per API
This query calculated the 95th percentile of the request latency of upstream services for the selected API. To run this query:<api name> with the name of your API for this query.
Request rate
Track the request rate of your services:Request Rate per API
Track the request rate of your services for the selected API:<api name> with the name of your API for this query.
Error Rates
Track the error rate your services are serving:Error rates per API
Track the error rate your services are serving for the selected API:<api name> with the name of your API for this query.
Setup Prometheus Pump
We’ll show you how to setup Tyk Pump for Prometheus Service Discovery.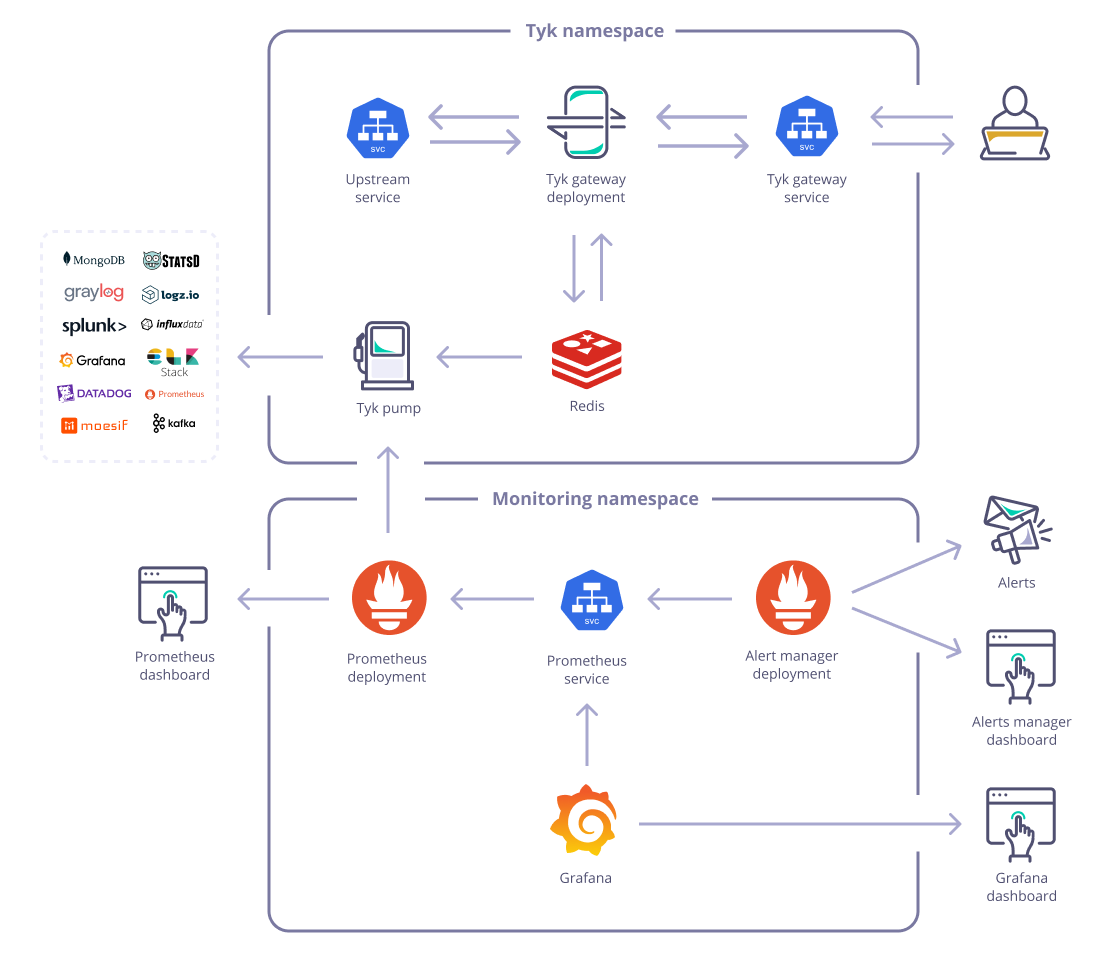
Integrate with Prometheus using Prometheus Operator
Steps for Configuration:-
Setup Prometheus
Using the prometheus-community/kube-prometheus-stack chart
In this example, we use kube-prometheus-stack, which installs a collection of Kubernetes manifests, Grafana dashboards, and Prometheus rules combined with documentation and scripts to provide easy to operate end-to-end Kubernetes cluster monitoring with Prometheus using the Prometheus Operator.
This is a useful stack where you can get Prometheus, the Prometheus Operator, and Grafana all deployed and configured in one go.
-
Install Tyk Pump with PodMonitor
If you have Prometheus Operator enabled on the cluster, it would look for “PodMonitor” or “ServiceMonitor” resources and scrap from specified port. The only thing you would need to modify here is the helm release name for Prometheus Operator.
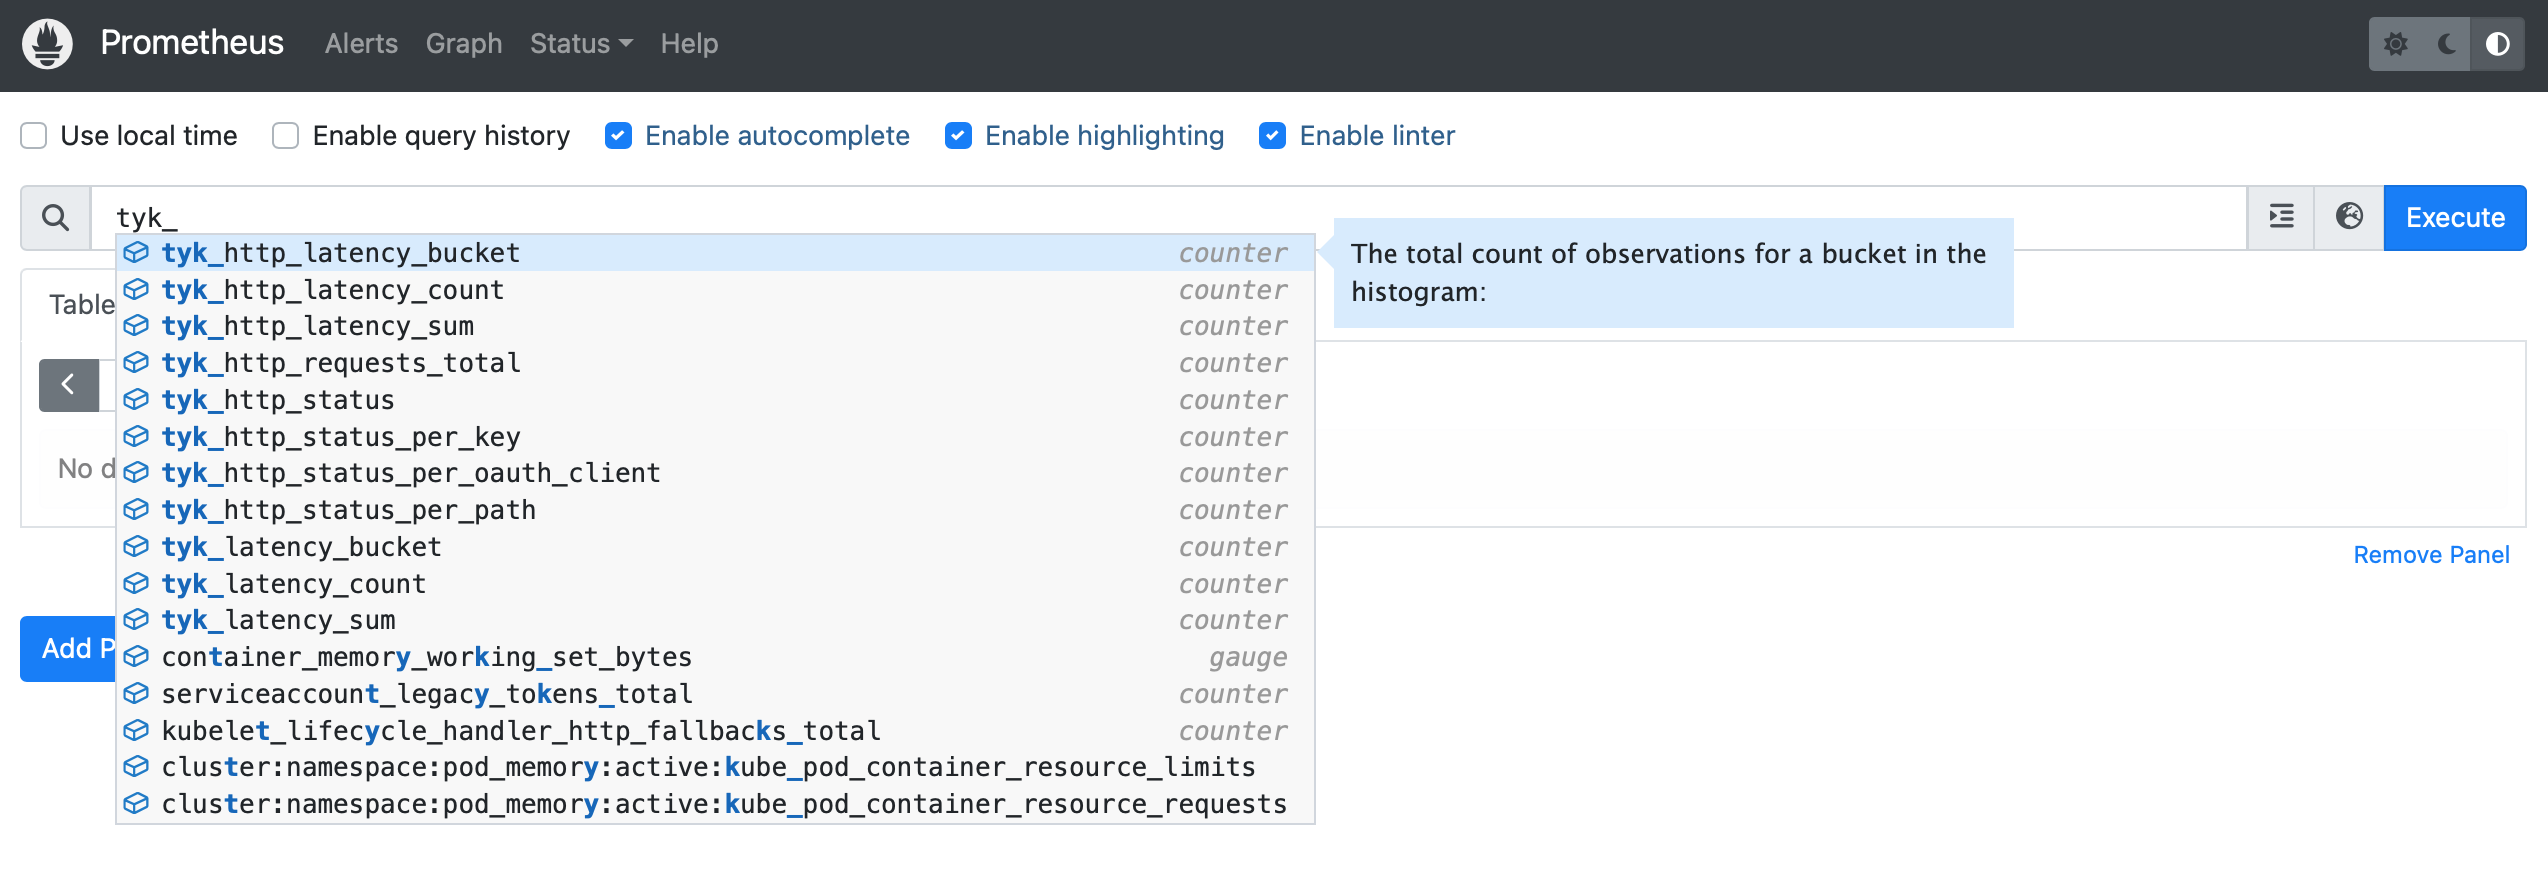
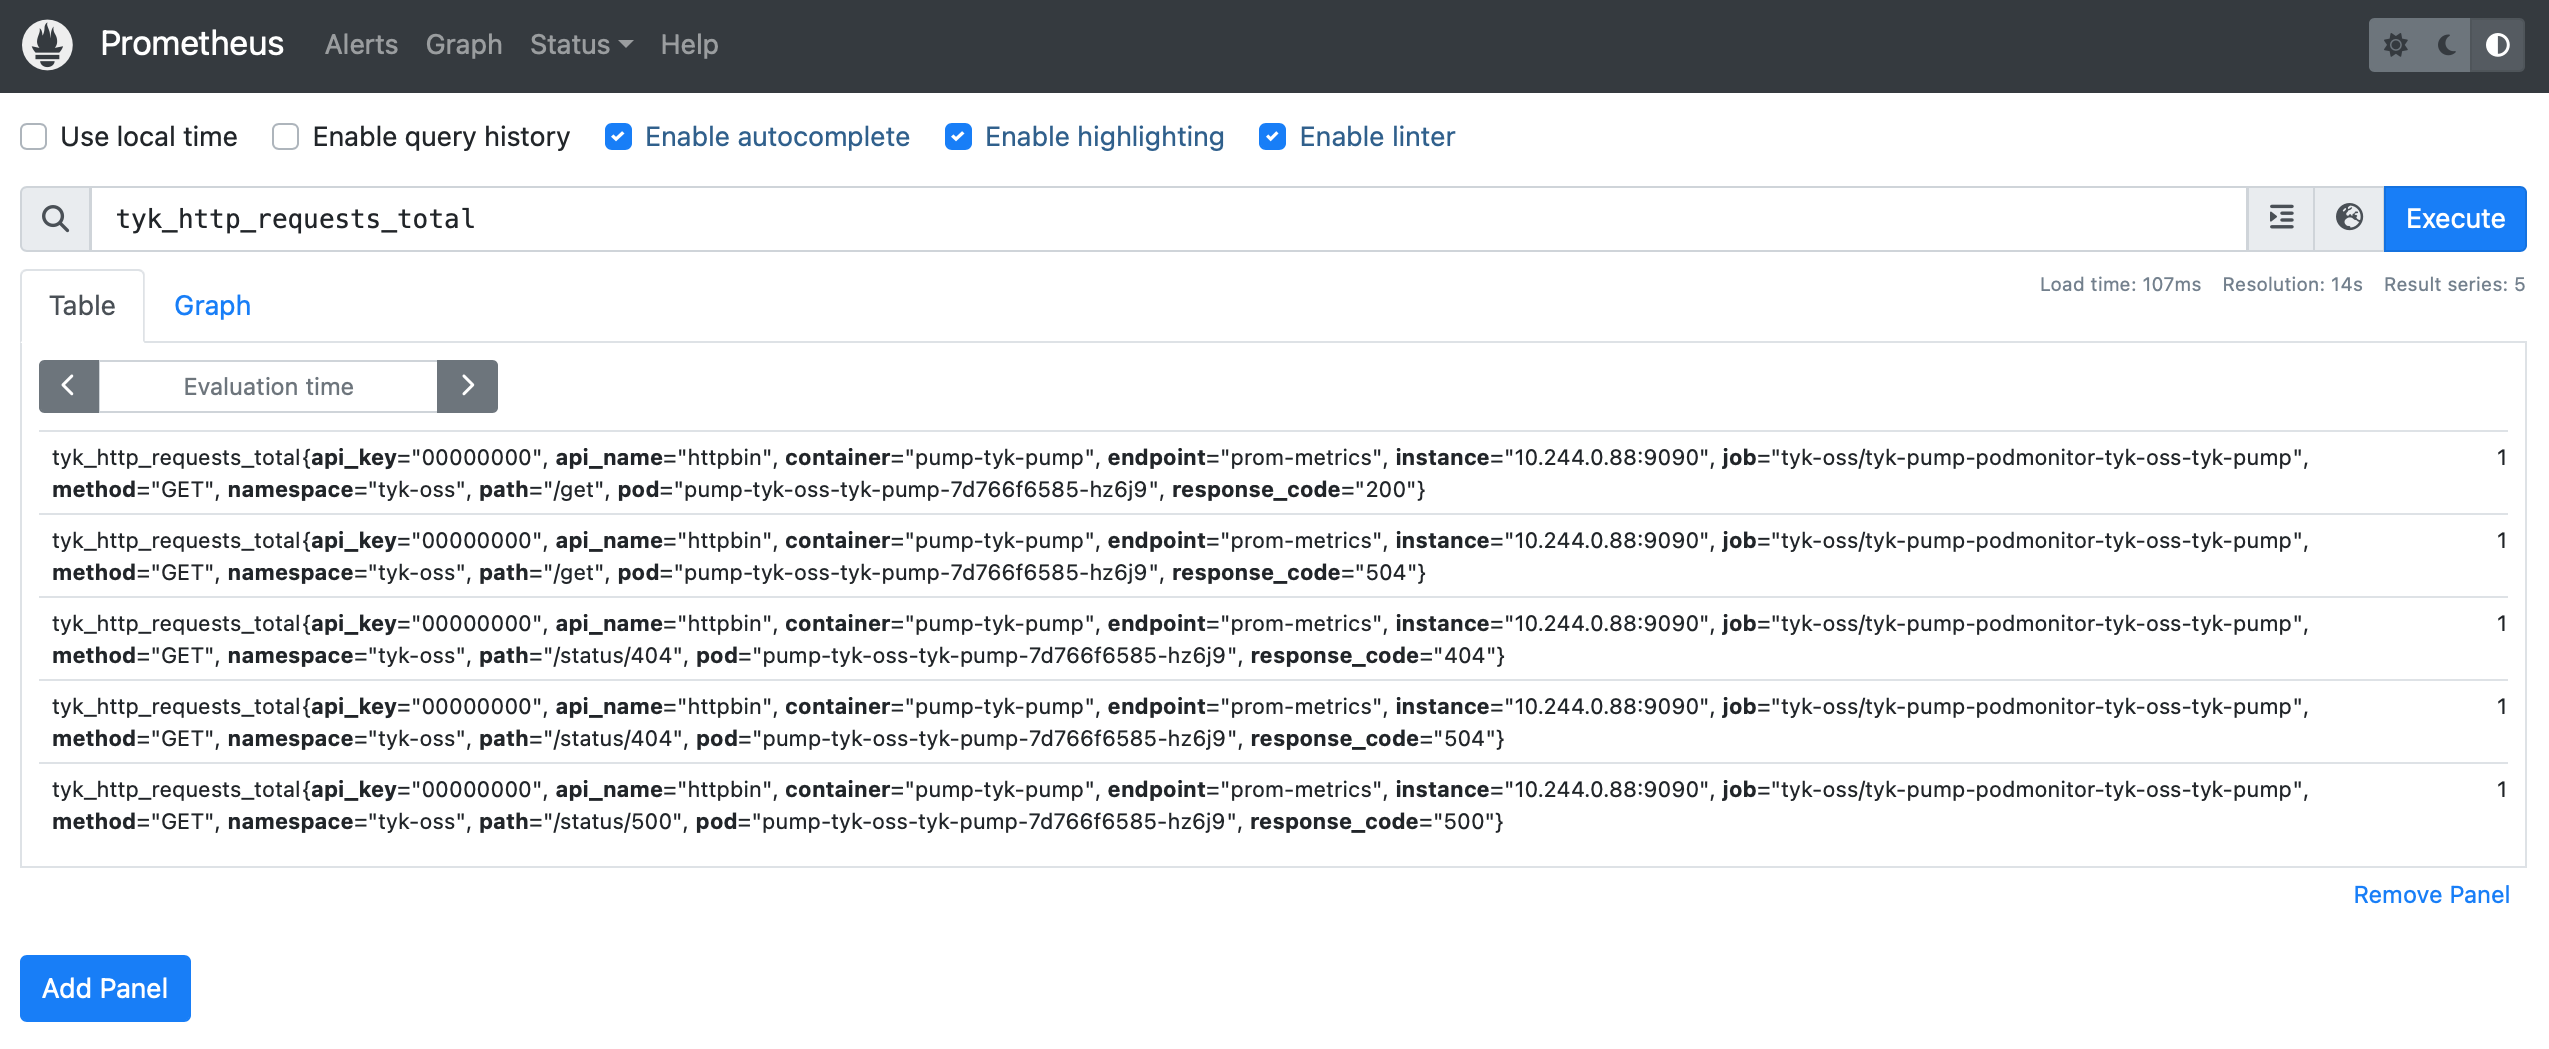
Also you can customize Prometheus Custom Metrics based on your analytics needs. We are using
tyk_http_requests_totalandtyk_http_latencydescribed here for illustration:
Please make sure you are installing Redis versions that are supported by Tyk. Please refer to Tyk docs to get list of supported versions.
For Custom Metrics, commas are escaped to be used in helm —set command. You can remove the backslashes in front of the commas if you are to set it in values.yaml. We have included an example in the default values.yaml comments section.
-
Verification
When successfully configured, you could see the following messages in pump log:
On Prometheus Dashboard, you can see the Pump is listed as one of the target and Prometheus is successfully scrapped from it.
Integrate with Prometheus using annotations
Steps for Configuration:-
Setup Prometheus
Using the prometheus-community/prometheus chart
Alternatively, if you are not using Prometheus Operator, please check how your Prometheus can support service discovery. Let say you’re using the prometheus-community/prometheus chart, which configures Prometheus to scrape from any Pods with following annotations:
To install Prometheus, run
-
Install Tyk Pump with prometheus annotations
Please make sure you are installing Redis versions that are supported by Tyk. Please refer to Tyk docs to get list of supported versions.
-
Verification
After some time, you can see that Prometheus is successfully scraping from Tyk Pump:
Expose a service for Prometheus to scrape
You can expose Pump as a service so that Prometheus can access the/metrics endpoint for scraping. Just enable service in tyk-pump.pump.service:
Tyk Pump Capping Analytics Data Storage
Tyk Gateways can generate a lot of analytics data. A guideline is that for every 3 million requests that your Gateway processes it will generate roughly 1GB of data. If you have Tyk Pump set up with the aggregate pump as well as the regular MongoDB pump, then you can make thetyk_analytics collection a capped collection. Capping a collection guarantees that analytics data is rolling within a size limit, acting like a FIFO buffer which means that when it reaches a specific size, instead of continuing to grow, it will replace old records with new ones.
If you are using DocumentDB, capped collections are not supported. See here for more details.
tyk_analytics collection contains granular log data, which is why it can grow rapidly. The aggregate pump will convert this data into a aggregate format and store it in a separate collection. The aggregate collection is used for processing reporting requests as it is much more efficient.
If you’ve got an existing collection which you want to convert to be capped you can use the convertToCapped MongoDB command.
If you wish to configure the pump to cap the collections for you upon creating the collection, you may add the following
configurations to your uptime_pump_config and / or mongo.meta objects in pump.conf.
collection_cap_max_size_bytes sets the maximum size of the capped collection.
collection_cap_enable enables capped collections.
If capped collections are enabled and a max size is not set, a default cap size of 5Gib is applied.
Existing collections will never be modified.
An alternative to capped collections is MongoDB’s Time To Live indexing (TTL). TTL indexes are incompatible with capped collections. If you have set a capped collection, a TTL index will not get created, and you will see error messages in the MongoDB logs. See MongoDB TTL Docs for more details on TTL indexes.
Time Based Cap in single tenant environments
If you wish to reduce or manage the amount of data in your MongoDB, you can add an TTL expire index to the collection, so older records will be evicted automatically.Time based caps (TTL indexes) are incompatible with already configured size based caps.
timestamp field is older then specified expiration time.
Time Based Cap in multi-tenant environments
When you have multiple organizations, you can control analytics expiration on per organization basis. This technique also use TTL indexes, as described above, but index should look like:expireAt to correspond to the time the document should expire. MongoDB will automatically delete documents from the tyk_analytics collection 0 seconds after the expireAt time in the document. The expireAt will be calculated and created by Tyk in the following step.
Create an Organization Quota
data_expires - Sets the data expires to a time in seconds for it to expire. Tyk will calculate the expiry date for you.
Size Based Cap
Add the Size Cap
The size value should be in bytes, and we recommend using a value just under the amount of RAM on your machine.
Adding the Size Cap if using a mongo_selective Pump
Themongo_selective pump stores data on a per organization basis. You will have to run the following command in your MongoDB shell for an individual organization as follows.
Separated Analytics Storage
For high-traffic systems that make heavy use of analytics, it makes sense to separate out the Redis analytics server from the Redis configuration server that supplies auth tokens and handles rate limiting configuration. To enable a separate analytics server, update yourtyk.conf with the following section:
addrs is new in v2.9.3, and replaces hosts which is now deprecated.enable_cluster to false, you only need to set one entry in addrs:
The configuration is the same (and uses the same underlying driver) as the regular configuration, so Redis Cluster is fully supported.