> ## Documentation Index
> Fetch the complete documentation index at: https://tyk.io/docs/llms.txt
> Use this file to discover all available pages before exploring further.
# Send Tyk Traces to New Relic
> Step-by-step guide to connect Tyk Gateway distributed traces to New Relic using the OpenTelemetry Collector.
This guide explains how to set up [New Relic](https://newrelic.com/) to ingest OpenTelemetry traces via the OpenTelemetry Collector (OTel Collector) using Docker. At the end of this guide, you will be able to visualize traces and metrics from your Tyk Gateway on the New Relic console.
## Prerequisites
* [Docker installed on your machine](https://docs.docker.com/get-docker/)
* [New Relic Account](https://newrelic.com/)
* New Relic API Key
* Gateway v5.2.0 or higher
* OTel Collector [docker image](https://hub.docker.com/r/otel/opentelemetry-collector)
## Steps for Configuration
### Step 1. Obtain New Relic API Key
1. Navigate to your New Relic Console.
2. Go to **Profile → API keys**.
3. Copy the key labeled as `INGEST-LICENSE`.
You can follow the [official New Relic documentation](https://docs.newrelic.com/docs/apis/intro-apis/new-relic-api-keys/) for more information.
**Example token:**
```bash theme={null}
93qwr27e49e168d3844c5h3d1e878a463f24NZJL
```
### Step 2. Configuration Files
**OTel Collector Configuration YAML**
1. Create a file named `otel-collector-config.yml` under the configs directory.
2. Copy the following template into that file:
```yaml expandable theme={null}
receivers:
otlp:
protocols:
http:
endpoint: 0.0.0.0:4318
grpc:
endpoint: 0.0.0.0:4317
processors:
batch:
exporters:
otlphttp:
endpoint: ""
headers:
api-Key: ""
extensions:
health_check:
pprof:
endpoint: :1888
zpages:
endpoint: :55679
service:
extensions: [pprof, zpages, health_check]
pipelines:
traces:
receivers: [otlp]
processors: [batch]
exporters: [otlphttp]
```
* Replace `` with your specific New Relic endpoint (`https://otlp.nr-data.net` for US or `https://otlp.eu01.nr-data.net` for EU).
* Replace `` with the API key obtained in Step 1.
**Docker Compose configuration**
1. Create a file named `docker-compose.yml` at the root level of your project directory.
2. Paste the following code into that file:
```yaml expandable theme={null}
version: "3.9"
services:
otel-collector:
image: otel/opentelemetry-collector:latest
volumes:
- ./otel-collector-config.yml:/etc/otel-collector.yml
command: ["--config=/etc/otel-collector.yml"]
networks:
- tyk
ports:
- "1888:1888" # pprof extension
- "13133:13133" # health_check extension
- "4317:4317" # OTLP gRPC receiver
- "4318:4318" # OTLP http receiver
- "55670:55679" # zpages extension
networks:
tyk:
```
Replace the variable fields with the relevant data.
### Step 3. Testing and Verifying Traces
1. Run `docker-compose up -d` to start all services.
2. Initialize your Tyk environment.
3. Create a simple API and deploy it to your Tyk Gateway. You can follow the [Tyk Dashboard documentation](/nightly/api-management/gateway-config-managing-classic#create-an-api) for more information.
4. Send requests to the API using cURL or Postman.
5. Open New Relic Console.
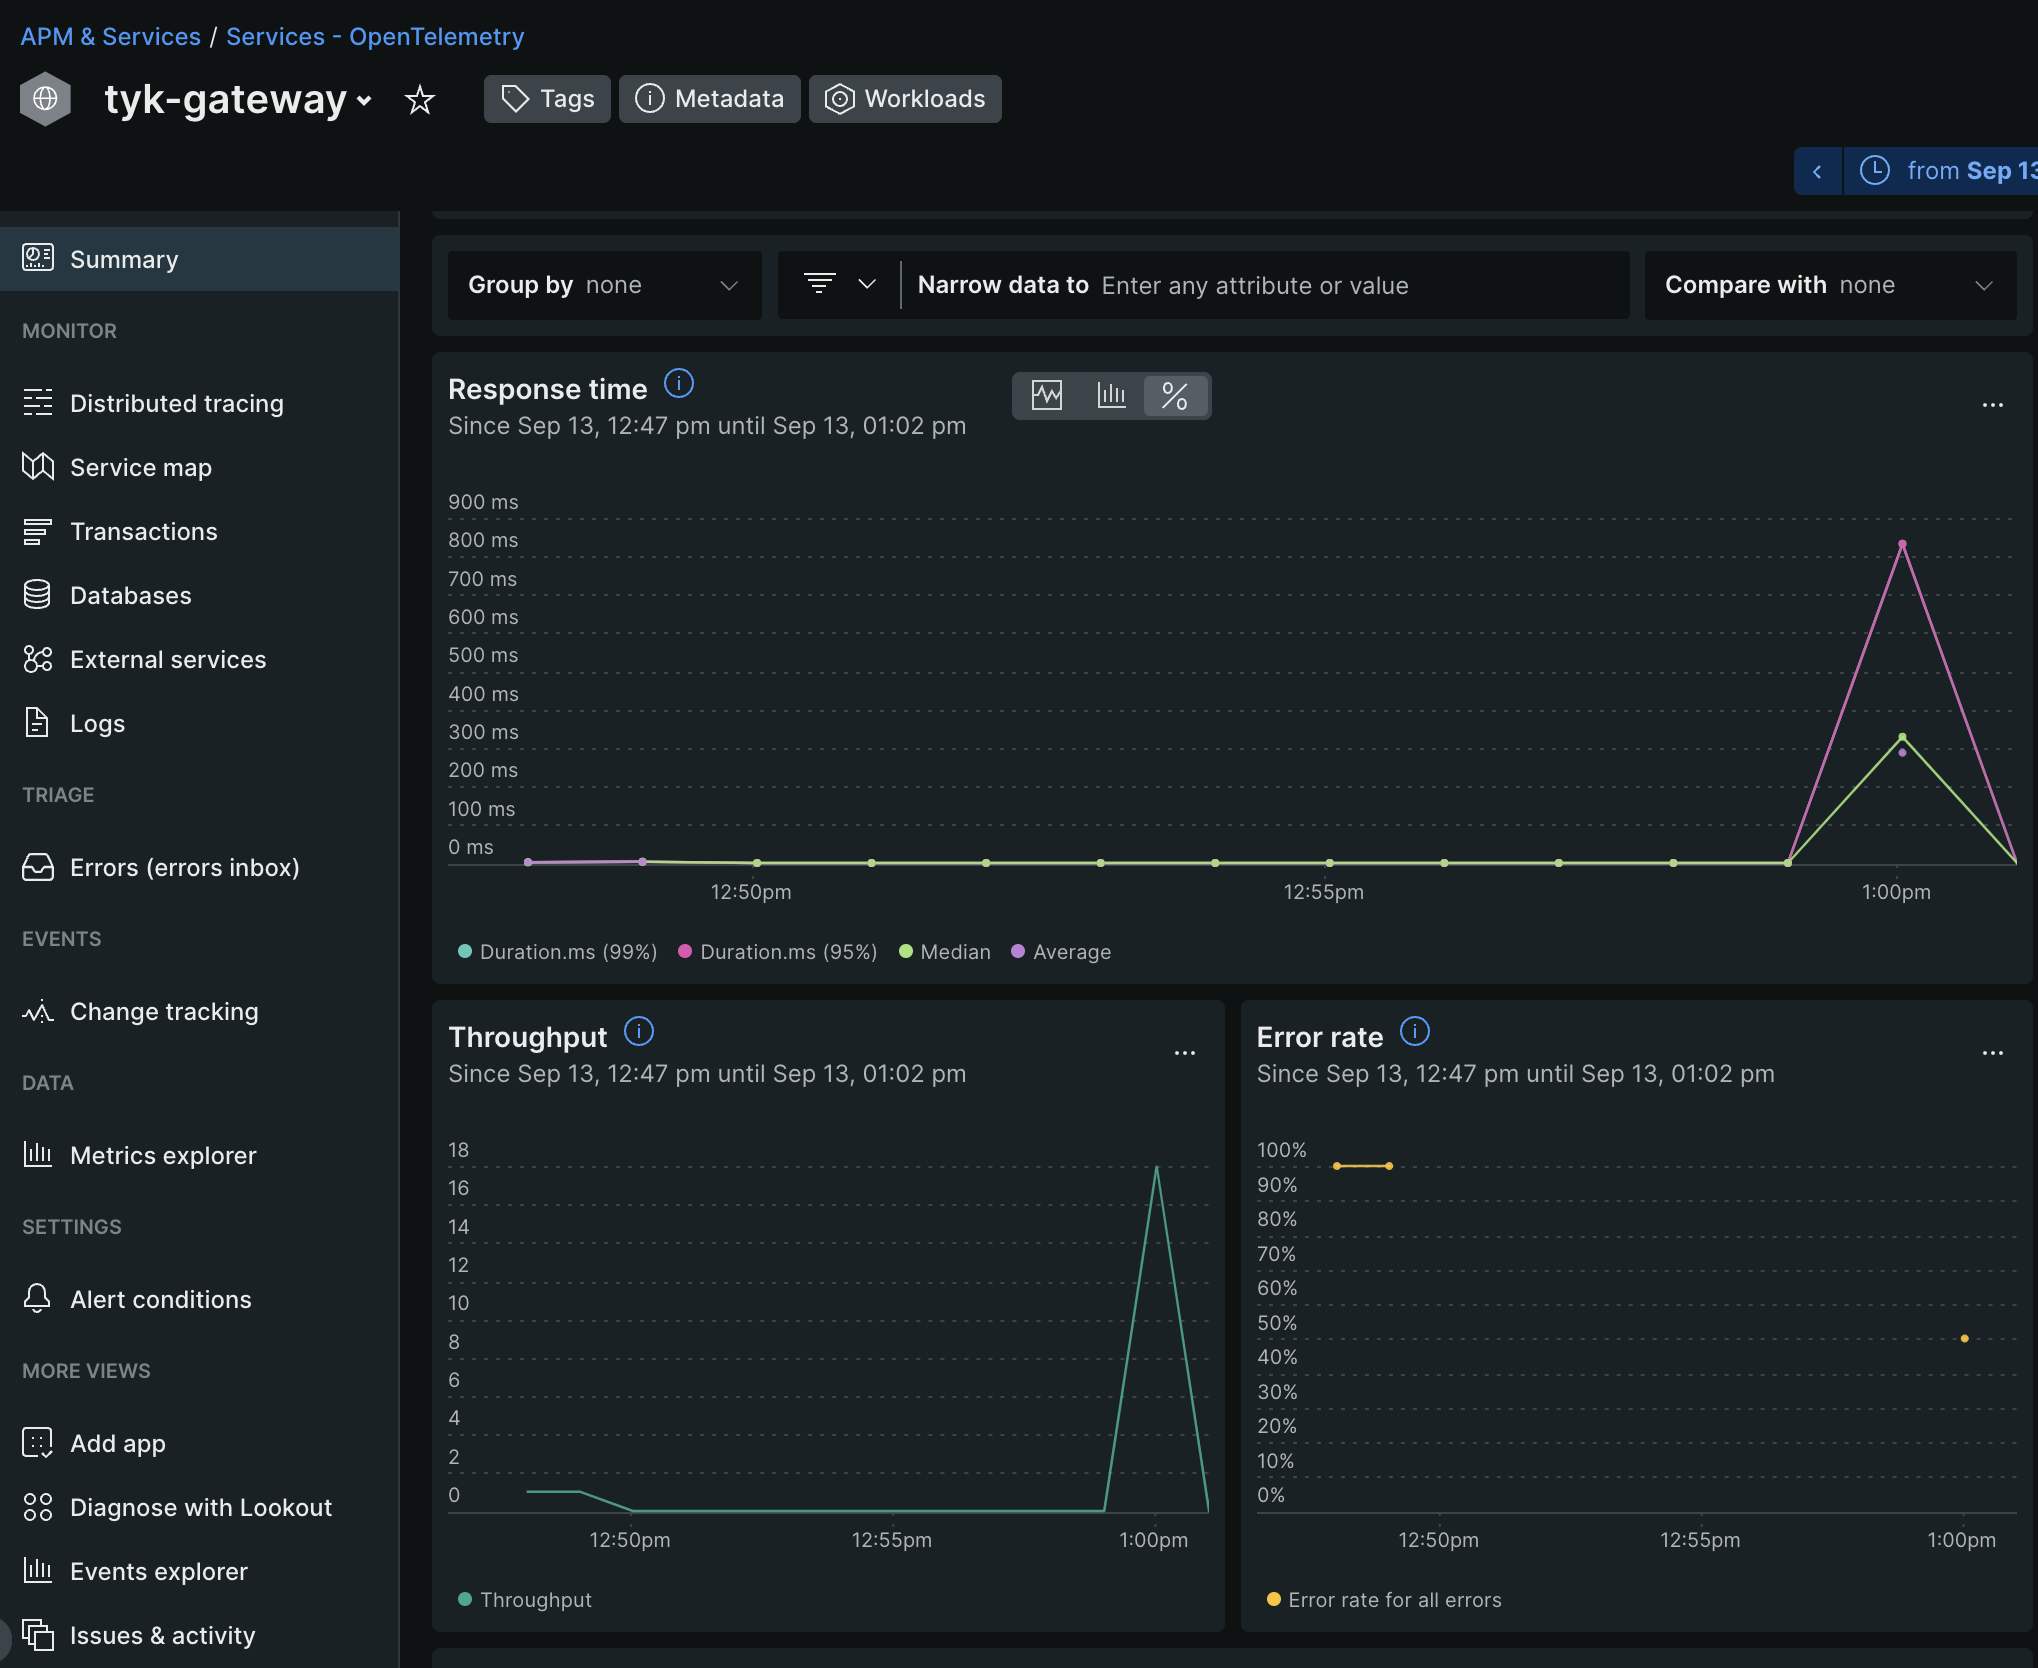
6. Navigate to **APM & Services → Services - OpenTelemetry → tyk-gateway**.
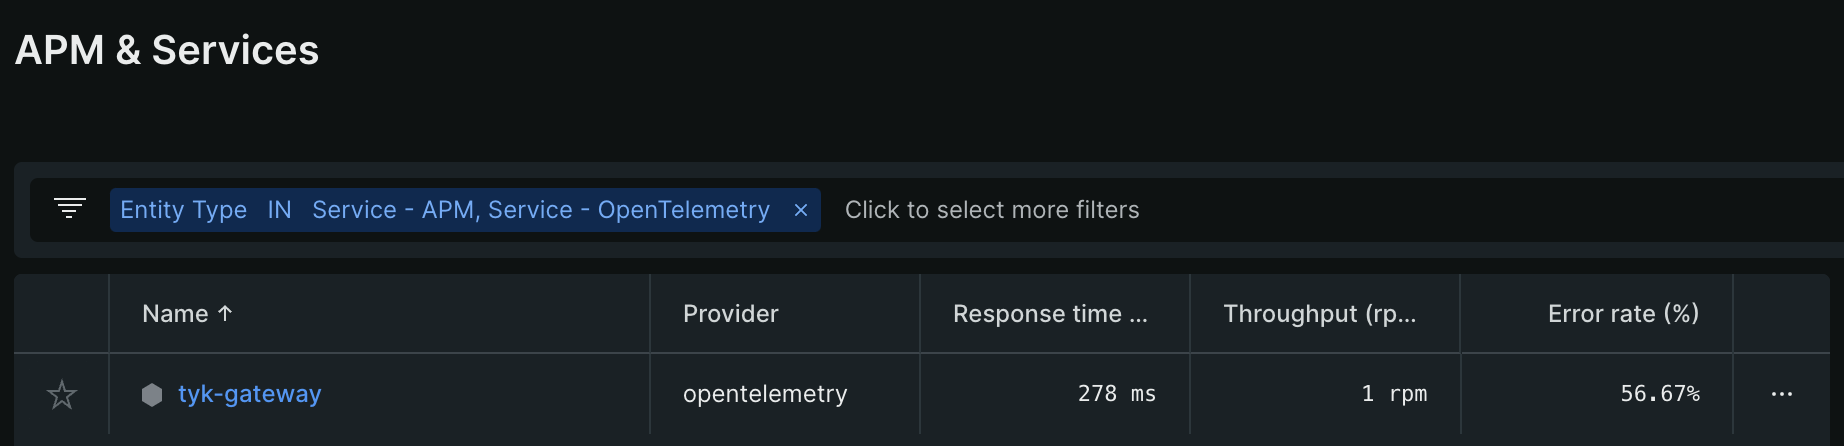 7. Wait for about 5 minutes for the data to populate.
Traces and graphs should now be visible on your New Relic console.
7. Wait for about 5 minutes for the data to populate.
Traces and graphs should now be visible on your New Relic console.
 If traces are not showing, try refreshing the New Relic dashboard.
You have successfully integrated New Relic with Tyk Gateway via the OpenTelemetry Collector. You can now monitor and trace your APIs directly from the New Relic console.
## Troubleshooting
If the traces aren't appearing:
* Double-check your API key and endpoints.
* Ensure that your Tyk Gateway and New Relic are both running and connected.
If traces are not showing, try refreshing the New Relic dashboard.
You have successfully integrated New Relic with Tyk Gateway via the OpenTelemetry Collector. You can now monitor and trace your APIs directly from the New Relic console.
## Troubleshooting
If the traces aren't appearing:
* Double-check your API key and endpoints.
* Ensure that your Tyk Gateway and New Relic are both running and connected.