> ## Documentation Index
> Fetch the complete documentation index at: https://tyk.io/docs/llms.txt
> Use this file to discover all available pages before exploring further.
# How to build a Grafana dashboard for MCP traffic
> Build a Grafana dashboard to monitor MCP tool call volumes, error rates, and latency using Tyk Gateway's OpenTelemetry metrics.
Without instrumentation, MCP traffic is opaque: you know requests are flowing, but not which tools agents are calling, which are slow, or where failures are concentrated. This guide builds a [Grafana](https://grafana.com/) dashboard for MCP traffic using Tyk Gateway's [OpenTelemetry](https://opentelemetry.io/) metrics. By the end, you will have three panels covering request volume by JSON-RPC method, error rate, and top tools by call volume.
***
## Prerequisites
### 1. Enable OTel metrics on the gateway
Tyk exports metrics via OTLP (not a [Prometheus](https://prometheus.io/) scrape endpoint directly). The recommended setup uses an OpenTelemetry Collector to receive OTLP from Tyk and expose a Prometheus scrape endpoint.
Add the following to your `tyk.conf`:
```json theme={null}
"opentelemetry": {
"enabled": true,
"exporter": "grpc",
"endpoint": "localhost:4317"
}
```
Then run an OTel Collector configured to receive OTLP on `:4317` and export to Prometheus on `:8889`. See [OpenTelemetry in Tyk](/nightly/api-management/traces) for full configuration options.
### 2. Enable traffic logs on the MCP proxy
Tyk Gateway only records metrics for APIs that have traffic logging enabled. In the Dashboard, open your MCP proxy definition, navigate to **Advanced Options**, and enable **Traffic Logs**. Without this, no requests are recorded and all panels will be empty.
### 3. Configure the MCP metric instruments
The metric instruments are configured in `tyk.conf`, under `opentelemetry.metrics`. Add the following to your gateway config:
```json theme={null}
"opentelemetry": {
"enabled": true,
"exporter": "grpc",
"endpoint": "localhost:4317",
"metrics": {
"enabled": true,
"api_metrics": [
{
"name": "tyk.mcp.requests.total",
"type": "counter",
"description": "MCP request count by method, tool, API, and session",
"dimensions": [
{ "source": "metadata", "key": "mcp_method", "label": "mcp_method", "default": "" },
{ "source": "metadata", "key": "mcp_primitive_type", "label": "primitive_type", "default": "" },
{ "source": "metadata", "key": "mcp_primitive_name", "label": "tool_name", "default": "" },
{ "source": "metadata", "key": "mcp_error_code", "label": "error_code", "default": "" },
{ "source": "metadata", "key": "api_id", "label": "api_id" },
{ "source": "session", "key": "alias", "label": "session", "default": "unknown" }
]
},
{
"name": "tyk.mcp.upstream.duration",
"type": "histogram",
"description": "Upstream MCP server latency per tool and API",
"histogram_source": "upstream",
"histogram_buckets": [0.01, 0.05, 0.1, 0.25, 0.5, 1, 2.5, 5, 10],
"dimensions": [
{ "source": "metadata", "key": "mcp_primitive_name", "label": "tool_name", "default": "" },
{ "source": "metadata", "key": "api_id", "label": "api_id" }
]
},
{
"name": "tyk.mcp.request.duration",
"type": "histogram",
"description": "End-to-end MCP request latency per tool and API",
"histogram_source": "total",
"histogram_buckets": [0.01, 0.05, 0.1, 0.25, 0.5, 1, 2.5, 5, 10],
"dimensions": [
{ "source": "metadata", "key": "mcp_primitive_name", "label": "tool_name", "default": "" },
{ "source": "metadata", "key": "mcp_method", "label": "mcp_method", "default": "" },
{ "source": "metadata", "key": "api_id", "label": "api_id" }
]
},
{
"name": "tyk.mcp.method.distribution",
"type": "counter",
"description": "Distribution of MCP method types for session efficiency analysis",
"dimensions": [
{ "source": "metadata", "key": "mcp_method", "label": "mcp_method", "default": "" },
{ "source": "metadata", "key": "api_id", "label": "api_id" }
]
}
]
}
}
```
Restart the gateway after making this change. See [MCP metrics](/nightly/ai-management/mcp-gateway/mcp-metrics) for the full reference on each instrument and additional use cases.
***
OTel metric names are translated when Prometheus scrapes them: dots become underscores, counter instruments get a `_total` suffix, and histogram instruments with a seconds unit get a `_seconds` suffix. So `tyk.mcp.requests.total` becomes `tyk_mcp_requests_total` in PromQL, and `tyk.mcp.upstream.duration` becomes `tyk_mcp_upstream_duration_seconds_bucket`, `tyk_mcp_upstream_duration_seconds_sum`, and `tyk_mcp_upstream_duration_seconds_count`.
***
## Instructions
### Step 1: Create the dashboard
1. In Grafana, go to **Connections → Data Sources → Add new data source**, select **Prometheus**, set the URL to your Prometheus server (e.g. `http://prometheus:9090`), and click **Save & test**.
2. Go to **Dashboards → New → New dashboard**.
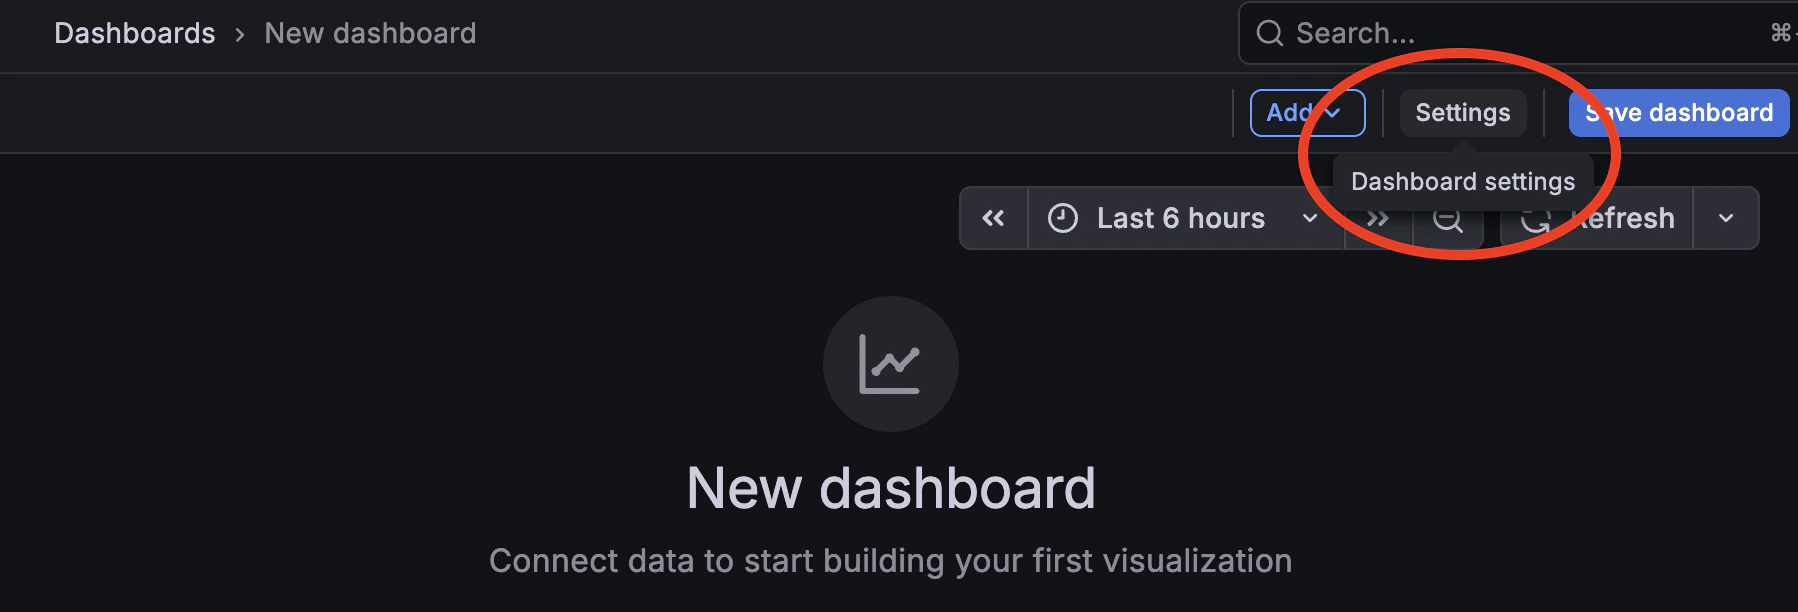
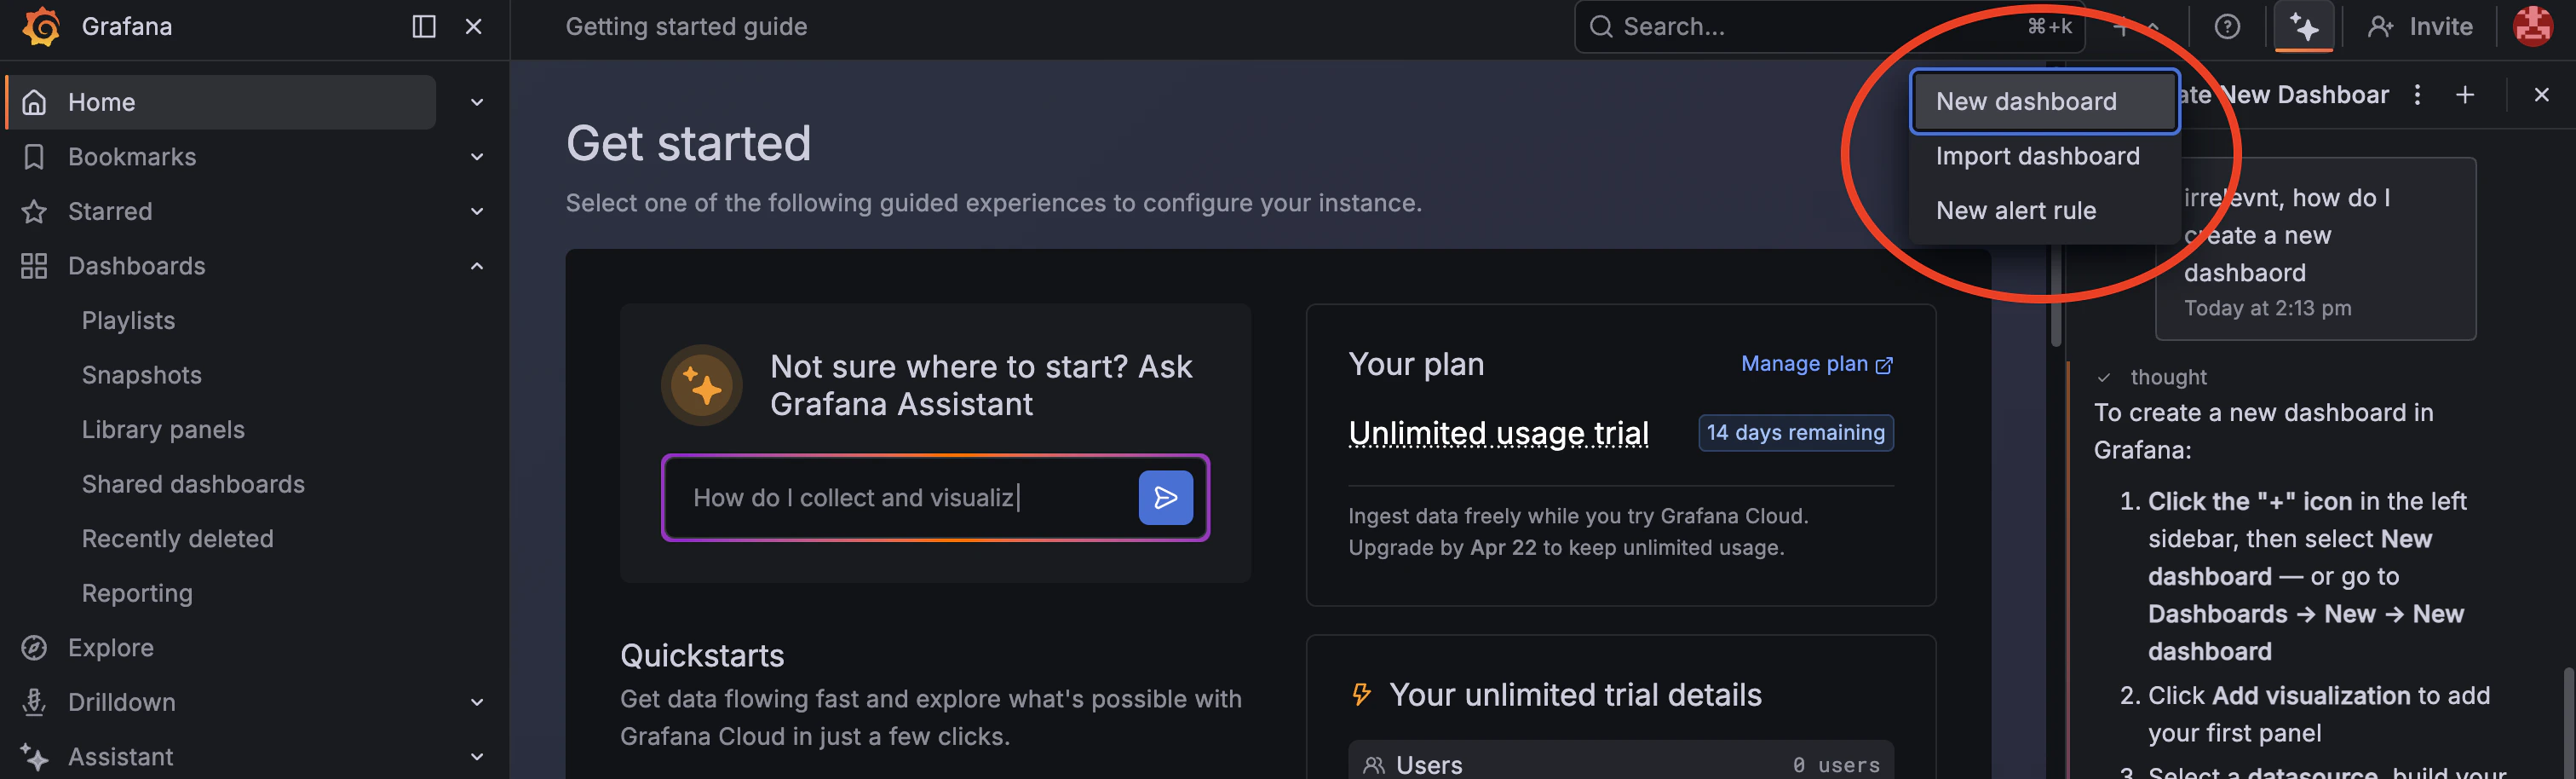 3. Open **Dashboard settings → Variables → Add variable**.
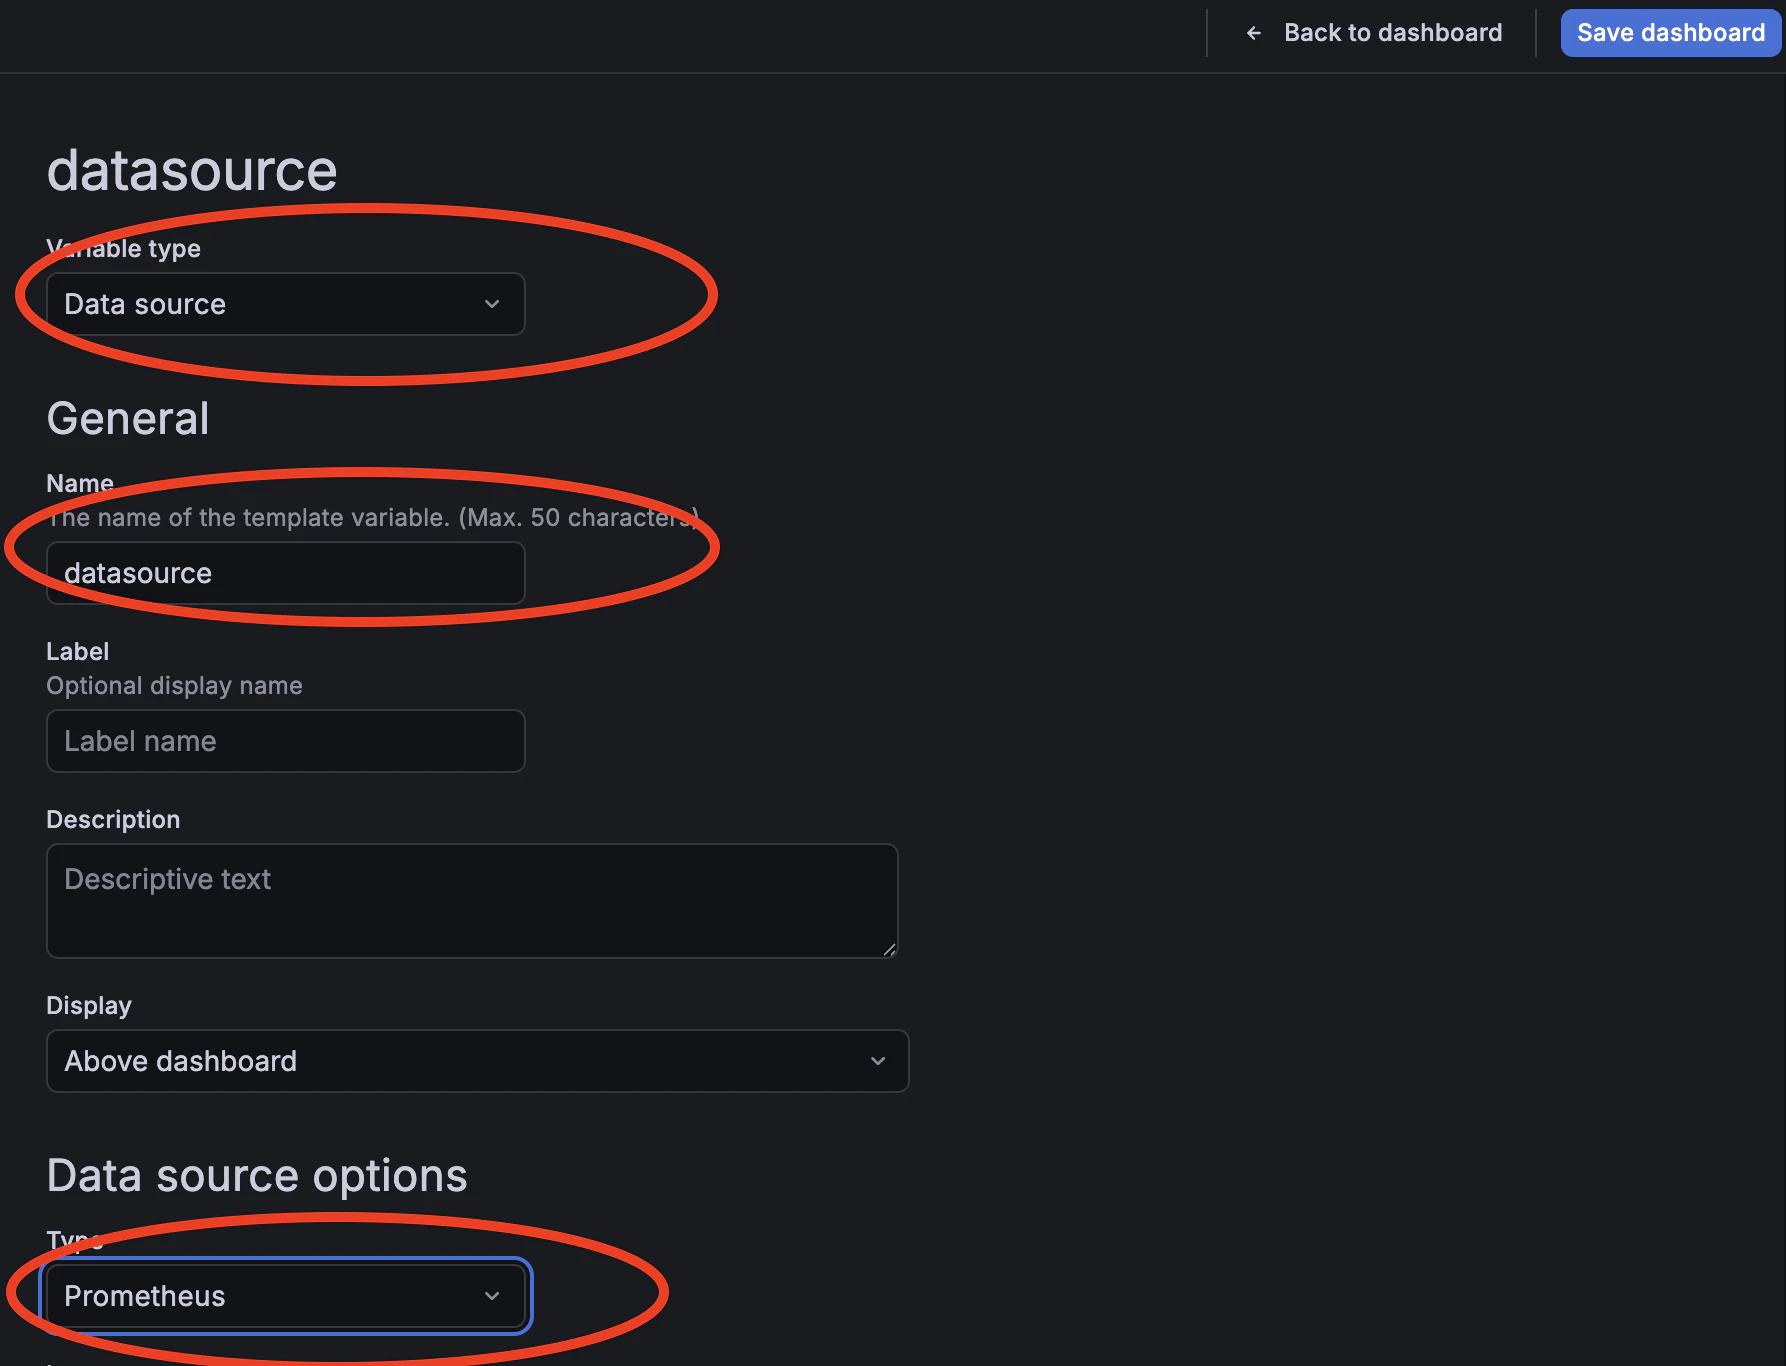
 4. Set the following fields and click **Save**:
| Field | Value |
| ----------------- | ------------ |
| **Variable type** | Datasource |
| **Name** | `datasource` |
| **Plugin type** | Prometheus |
4. Set the following fields and click **Save**:
| Field | Value |
| ----------------- | ------------ |
| **Variable type** | Datasource |
| **Name** | `datasource` |
| **Plugin type** | Prometheus |
 ### Step 2: Generate traffic
1. Make a few tool calls through your MCP proxy to populate the metrics.
If you need a quick way to generate traffic, use MCP Inspector with the Mock MCP Server; the full setup is covered in [How to secure an MCP proxy](/nightly/ai-management/mcp-gateway/how-to-proxy-remote-mcp). Once you have traffic flowing, come back here to build the dashboard.
### Step 3: Request rate by method
1. Click **Add → Visualization** and select **Time series**. Set the title to `MCP request rate by method`.
2. Set the PromQL query to:
```promql theme={null}
sum by (mcp_method) (rate(tyk_mcp_requests_total[$__rate_interval]))
```
3. Set the **Legend** to `{{mcp_method}}` and click **Apply**.
`$__rate_interval` is a Grafana built-in variable that automatically selects an appropriate rate interval based on the dashboard time range and scrape interval. It produces more accurate rate calculations than a hardcoded interval such as `[5m]` and is the recommended choice for rate and histogram queries.
### Step 4: Error rate
1. Click **Add → Visualization** and select **Stat**. Set the title to `MCP error rate`.
2. Set the PromQL query to:
```promql theme={null}
sum(rate(tyk_mcp_requests_total{error_code!=""}[$__rate_interval]))
/
sum(rate(tyk_mcp_requests_total[$__rate_interval]))
* 100
```
3. Set the **Unit** to `Percent (0-100)`.
4. Configure thresholds and click **Apply**:
| Value | Color |
| ----- | ------ |
| 0 | Green |
| 1 | Orange |
| 5 | Red |
### Step 5: Top tools by call volume
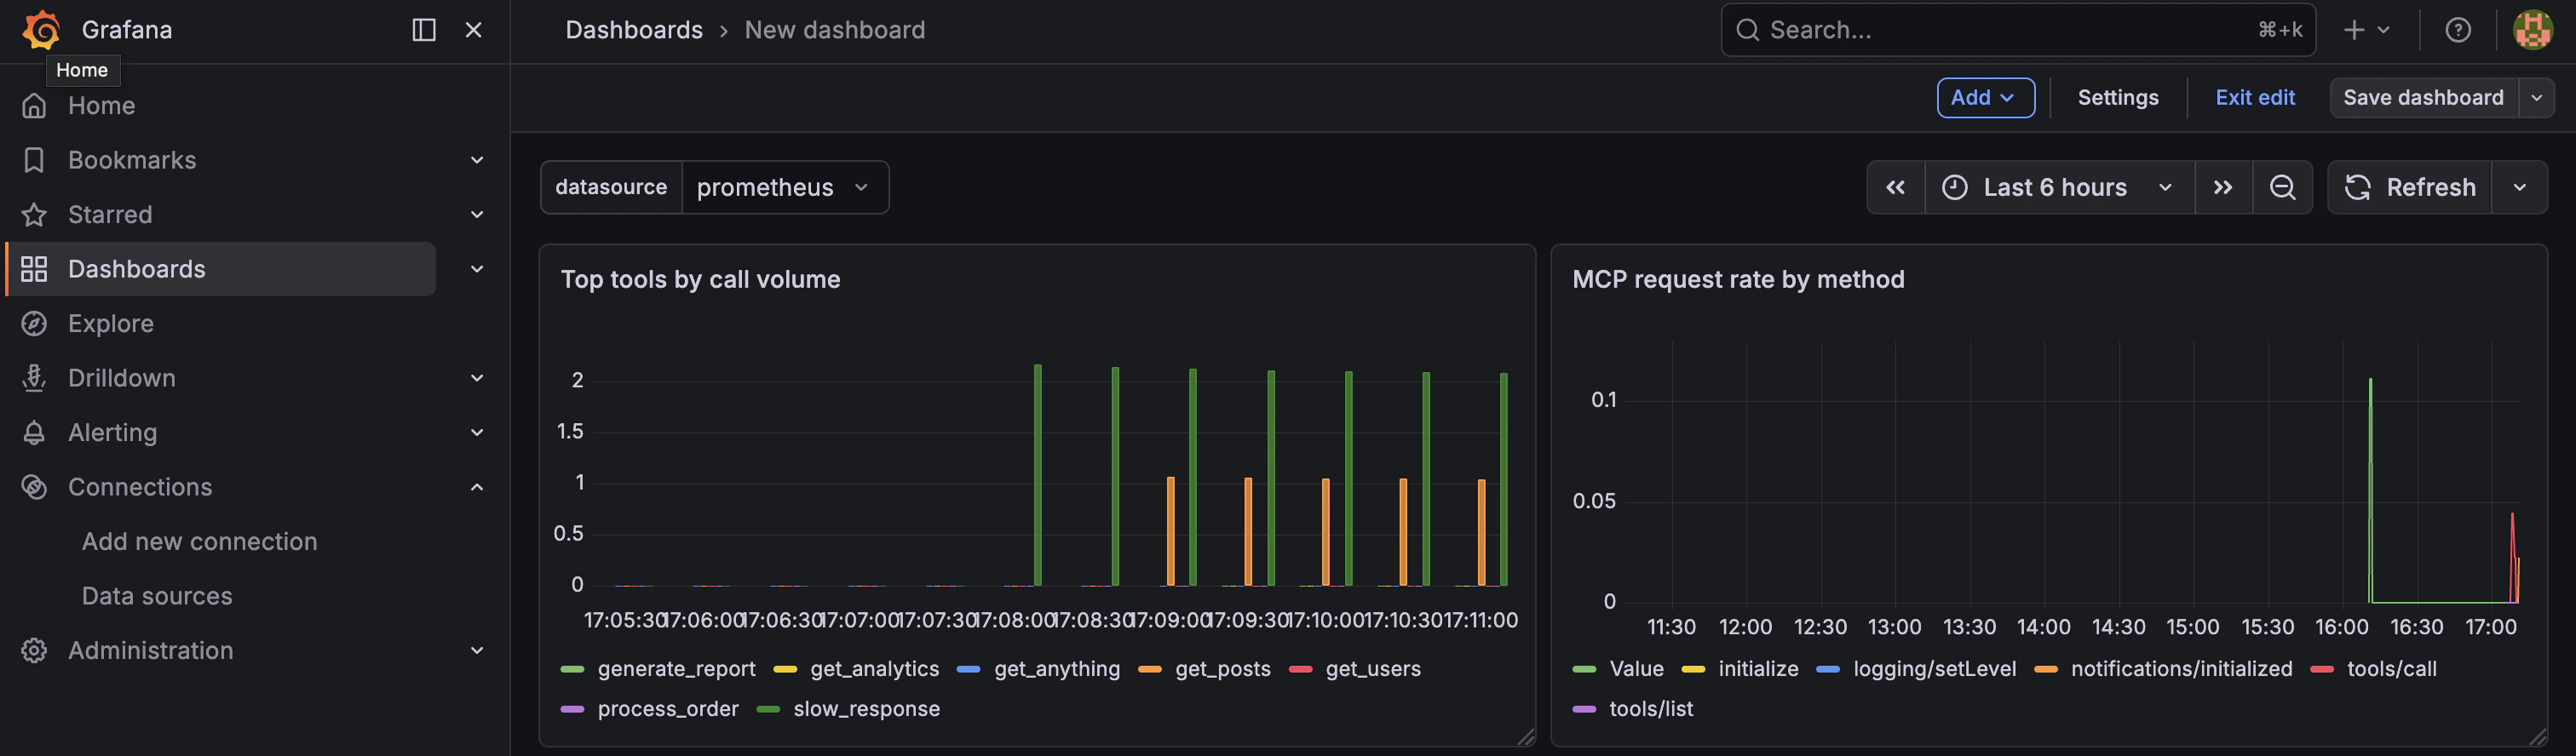
1. Click **Add → Visualization** and select **Bar chart**. Set the title to `Top tools by call volume`.
2. Set the PromQL query to:
```promql theme={null}
topk(10, sum by (tool_name) (increase(tyk_mcp_requests_total{mcp_method="tools/call"}[$__range])))
```
3. Set the **Legend** to `{{tool_name}}` and click **Apply**.
If the panel shows tool names but all counts are zero immediately after generating traffic, this is normal. The `increase()` function requires at least two Prometheus scrapes to return a non-zero result. Wait for the second OTel export cycle (up to two minutes) and refresh the dashboard.
### Step 2: Generate traffic
1. Make a few tool calls through your MCP proxy to populate the metrics.
If you need a quick way to generate traffic, use MCP Inspector with the Mock MCP Server; the full setup is covered in [How to secure an MCP proxy](/nightly/ai-management/mcp-gateway/how-to-proxy-remote-mcp). Once you have traffic flowing, come back here to build the dashboard.
### Step 3: Request rate by method
1. Click **Add → Visualization** and select **Time series**. Set the title to `MCP request rate by method`.
2. Set the PromQL query to:
```promql theme={null}
sum by (mcp_method) (rate(tyk_mcp_requests_total[$__rate_interval]))
```
3. Set the **Legend** to `{{mcp_method}}` and click **Apply**.
`$__rate_interval` is a Grafana built-in variable that automatically selects an appropriate rate interval based on the dashboard time range and scrape interval. It produces more accurate rate calculations than a hardcoded interval such as `[5m]` and is the recommended choice for rate and histogram queries.
### Step 4: Error rate
1. Click **Add → Visualization** and select **Stat**. Set the title to `MCP error rate`.
2. Set the PromQL query to:
```promql theme={null}
sum(rate(tyk_mcp_requests_total{error_code!=""}[$__rate_interval]))
/
sum(rate(tyk_mcp_requests_total[$__rate_interval]))
* 100
```
3. Set the **Unit** to `Percent (0-100)`.
4. Configure thresholds and click **Apply**:
| Value | Color |
| ----- | ------ |
| 0 | Green |
| 1 | Orange |
| 5 | Red |
### Step 5: Top tools by call volume
1. Click **Add → Visualization** and select **Bar chart**. Set the title to `Top tools by call volume`.
2. Set the PromQL query to:
```promql theme={null}
topk(10, sum by (tool_name) (increase(tyk_mcp_requests_total{mcp_method="tools/call"}[$__range])))
```
3. Set the **Legend** to `{{tool_name}}` and click **Apply**.
If the panel shows tool names but all counts are zero immediately after generating traffic, this is normal. The `increase()` function requires at least two Prometheus scrapes to return a non-zero result. Wait for the second OTel export cycle (up to two minutes) and refresh the dashboard.
 ## Next steps
The [MCP metrics](/nightly/ai-management/mcp-gateway/mcp-metrics) reference covers additional instruments you can add to this dashboard, including P95 upstream latency per tool, end-to-end latency, error classification by code, and per-session usage.
## Next steps
The [MCP metrics](/nightly/ai-management/mcp-gateway/mcp-metrics) reference covers additional instruments you can add to this dashboard, including P95 upstream latency per tool, end-to-end latency, error classification by code, and per-session usage.