Overview
Tyk has native GraphQL support, so it doesn’t require any external services or middleware. It fully complies with the latest GraphQL specifications, as outlined on the GraphQL Foundation webpage, including:- Queries – Fetching data
- Mutations – Modifying data
- Subscriptions – Real-time updates
- Schema Types - Defining your data structure
What can you do with GraphQL and Tyk?
You can securely expose existing GraphQL APIs using our GraphQL core functionality. In addition to this, you can also use Tyk’s integrated GraphQL engine to build a Universal Data Graph. The Universal Data Graph (UDG) lets you expose existing services as one single combined GraphQL API. See our video on getting started with GraphQL.What is GraphQL?
GraphQL is a query language for APIs and a runtime for fulfilling those queries with your existing data. GraphQL provides a complete and understandable description of the data in your API, gives clients the power to ask for exactly what they need and nothing more, makes it easier to evolve APIs over time, and enables powerful developer tools.source: GraphQL Foundation website
Why would you want to use GraphQL?
Since this is the documentation section, we won’t get into a debate about GraphQL vs REST. The main benefits of using GraphQL are:- Reduced network traffic One of the biggest benefits of GraphQL is that it allows clients to specify exactly what data they need. This means that you can avoid sending unnecessary data over the network, which can help reduce the amount of traffic and improve the performance of your application.
- Flexibility GraphQL is very flexible and can be used with many different programming languages and frameworks. It can also be used to retrieve data from multiple sources, such as databases, APIs, and even third-party services.
- Simplified data fetching With GraphQL, you can fetch all the data you need with a single request. This is because GraphQL allows you to specify exactly what data you need and how it should be structured, which can simplify the process of fetching data and reduce the amount of code you need to write.
- Easy maintenance Because GraphQL allows you to define a schema for your data, it can be easier to maintain and evolve your API over time. This is because changes to the schema can be made without breaking existing clients, as long as the changes are backward compatible.
- Strong typing GraphQL has a strong type system that allows you to define the shape of your data and ensure that the data you receive is of the correct type. This can help catch errors early on and make your code more reliable.
- Better developer experience for certain use cases Examples of those use cases mostly mentioned by developers are: APIs with multiple consumers that have very different requirements, public APIs with large groups of unknown users (like Shopify of Github), rapidly evolving APIs, backends for mobile applications, aggregating data from multiple microservices and development of data-driven products.
- How Airbnb, Shopify, GitHub and more are winning with GraphQL
- Who is Tyk GraphQL functionality for
- GraphQL: Performance is no longer a trade-off
Create a GraphQL API
GraphQL API can be created in Tyk using:- Tyk Dashboard UI
- Tyk Dashboard API
- Tyk Gateway API - for OSS users
Via Tyk Dashboard UI
Prerequisites
In order to complete the next steps, you need to have Tyk Self Managed installed. You can also create a 5-week trial account in Tyk Cloud.Steps for Configuration
-
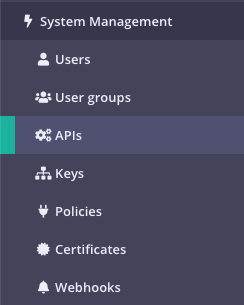
Select “APIs” from the “System Management” section
-
Click “ADD NEW API”

-
Set up the Base Configuration for your API
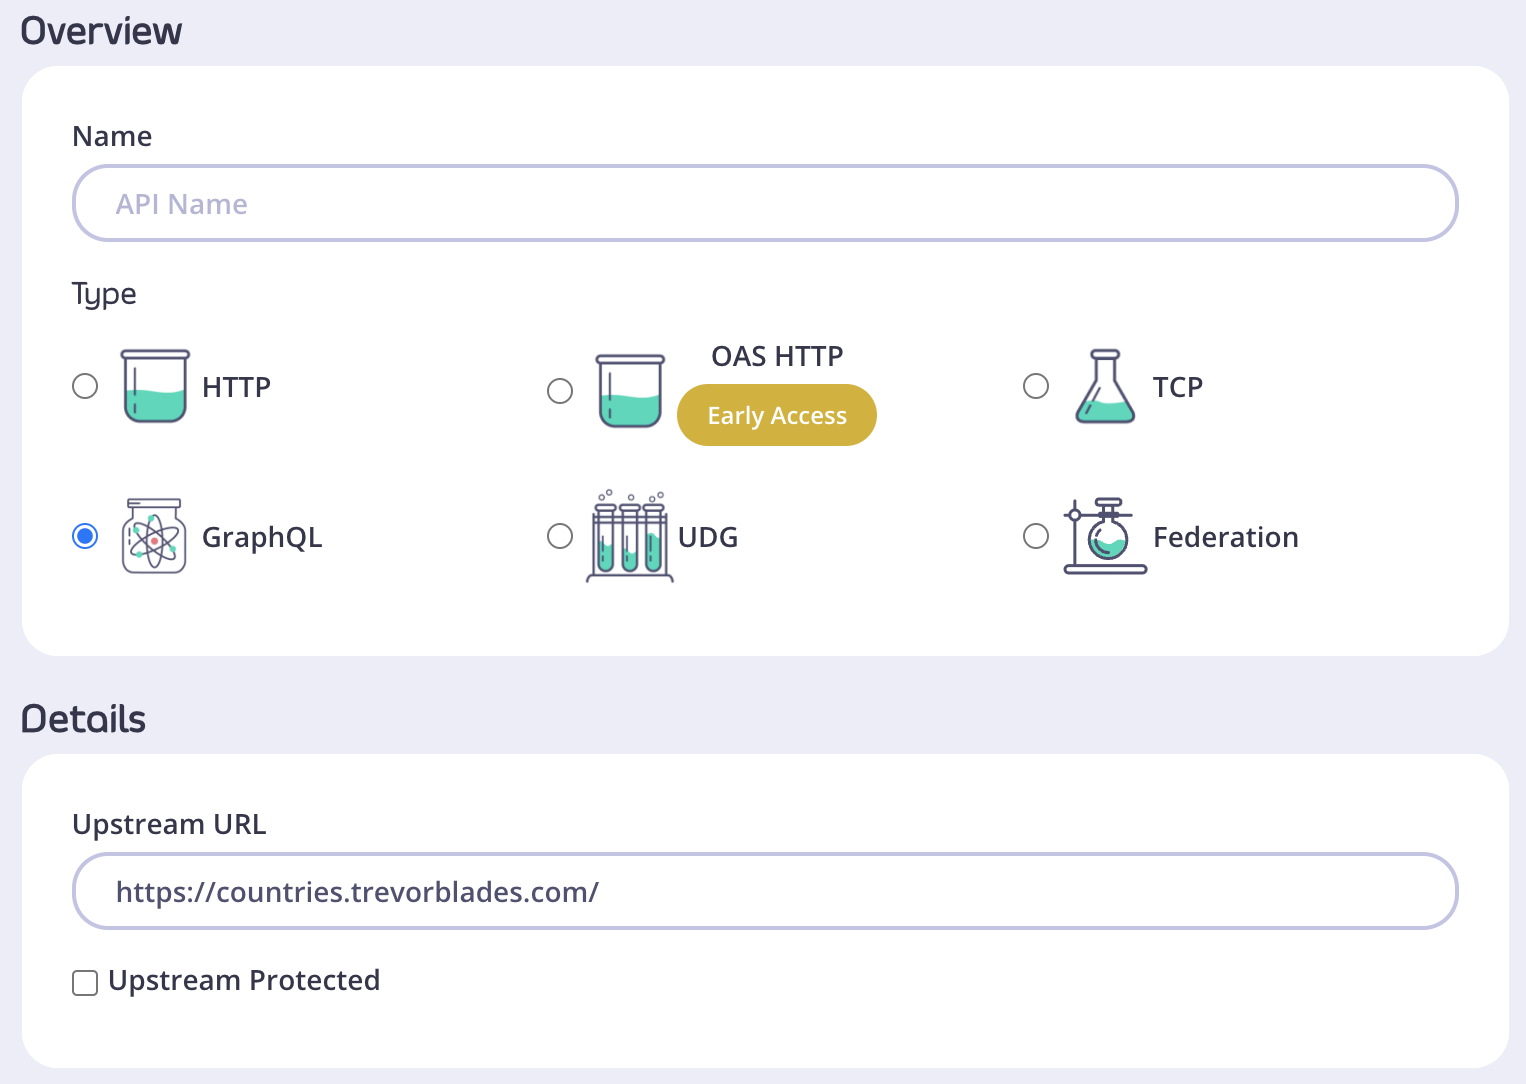
- From the Overview section, add your API Name and your API Type (In this case it’s GraphQL).
- From the Details section, add your Target URL. This will set the upstream origin that hosts the service you want to proxy to. As an example, you can use https://countries.trevorblades.com/.
- In case your upstream GQL service is protected, tick the box next to Upstream Protected and provide authorization details, so that Tyk can introspect the GraphQL service. You can provide authorization details as a set of headers or a certificate. Introspection of your upstream service is important for Tyk to correctly work with your GraphQL.
- If you would like to persist authorization information for future use you can tick the Persist headers for future use box. That way, if the upstream GQL schema changes in the future, you will be able to update it easily in Tyk.
- Click Configure API when you have finished
-
Set up the Authentication for your API
From the Authentication section:
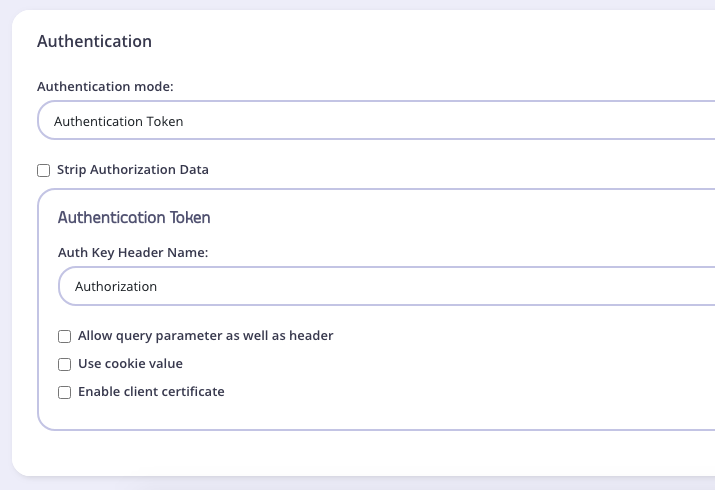
- Authentication mode: This is the security method to use with your API. First, you can set it to
Open(Keyless), but that option is not advised for production APIs. See Client Authentication for more details on securing your API. - Strip Authorization Data: Select this option to strip any authorization data from your API requests.
- Auth Key Header Name: The header name that will hold the token on inbound requests. The default for this is
Authorization. - Allow Query Parameter As Well As Header: Set this option to enable checking the query parameter as well as the header for an auth token. This is a setting that might be important if your GQL includes subscription operations.
- Use Cookie Value: It is possible to use a cookie value as well as the other two token locations.
- Enable client certificate: Select this to use Mutual TLS. See Mutual TLS for details on implementing mutual TLS.
- Authentication mode: This is the security method to use with your API. First, you can set it to
-
Save the API
Click SAVE

Via Tyk Dashboard API
Prerequisites
It is possible to create GQL APIs using Tyk Dashboard APIs. To make things easier you can use our Postman collection. You will need an API key for your organization and one command to create a GQL API and make it live.Steps for Configuration
-
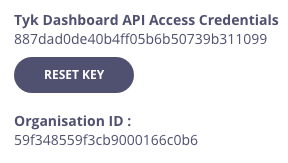
Obtain your Tyk Dashboard API Access Credentials key & Dashboard URL
From the Tyk Dashboard, select “Users” from the “System Management” section.
Click Edit for your user, then scroll to the bottom of the page. Your Tyk Dashboard API Access Credentials key is the first entry:
-
Query the
/api/apisendpoint to see what APIs are loadedFor a fresh install, you will see that no APIs currently exist. -
Create your first GQL API
This example API definition configures the Tyk Gateway to reverse proxy to the https://countries.trevorblades.com/ public GraphQL service.
To view the raw API definition object, you may visit: https://bit.ly/3zmviZ3
Take note of the API ID returned in the meta above - you will need it later.
-
Test your new GQL API
You just sent a request to the gateway on the listen path
/trevorblades. Using this path-based-routing, the gateway was able to identify the API the client intended to target. The gateway stripped the listen path and reverse-proxied the request to https://countries.trevorblades.com/ - Protect your API
api.trevorblades.json file we just created, and modify a couple of fields to enable authentication.
Change use_keyless from true to false.
Change auth_configs.authToken.auth_header_name to apikey.
Then send a PUT request back to Tyk Dashboard to update its configurations.
- Test protected API
Via Tyk Gateway API
Prerequisites
In order to complete the next steps, you need to have the Tyk OSS installed.Creation Methods
With Tyk OSS, it is possible to create GQL APIs using Tyk’s Gateway API or to generate a file with the same object and store it in the/apps folder of the Tyk Gateway installation folder. This is demonstrated in the file-based configuration section.
Steps for Configuration
A generated API ID will be added to the Tyk API definition if it’s not provided while creating a GQL API with Tyk Gateway API.
You can also use our Postman collection to make things easier.
In order to use the Gateway API you will need an API key for your Gateway and one command to create the API and make it live.
-
Make sure you know your API secret
Your Tyk Gateway API secret is stored in your
tyk.conffile, the property is calledsecret, you will need to use this as a header calledx-tyk-authorizationto make calls to the Gateway API. -
Create a GQL API
To create a GQL API, let’s send a definition to the
apisendpoint, which will return the status and version of your Gateway. Change thex-tyk-authorizationvalue andcurldomain name and port to be the correct values for your environment. This example API definition configures the Tyk Gateway to reverse proxy to the https://countries.trevorblades.com/ public GraphQL service. To view the raw API definition object, you may visit: https://bit.ly/3nt8KDaIf the command succeeds, you will see:What did we just do? We just sent an API definition to the Tyk/apisendpoint. API definitions are discussed in detail in the API section of this documentation. These objects encapsulate all of the settings for an API within Tyk Gateway.
Notice that when creating a GQL API you need to include your GQL service schema in the API definition. Tyk Gateway doesn’t have the capacity to introspect your GQL service on its own.Including the correct schema allows Tyk Gateway to validate incoming requests against it. More on validation can be found here
/trevorblades/.
Your GraphQL API is now ready to use. We recommend securing any GraphQL API before publishing it.
Check the following docs for more on GraphQL-specific security options:
GraphQL Proxy Only
What is GraphQL Proxy Only
GraphQL Proxy Only is a GraphQL API with a single data source and a read-only schema. The schema is automatically loaded from the GraphQL upstream, which must support introspection queries. Like other APIs, the GraphQL API supports policies, but with more advanced settings.Creating a GraphQL API via the Dashboard UI
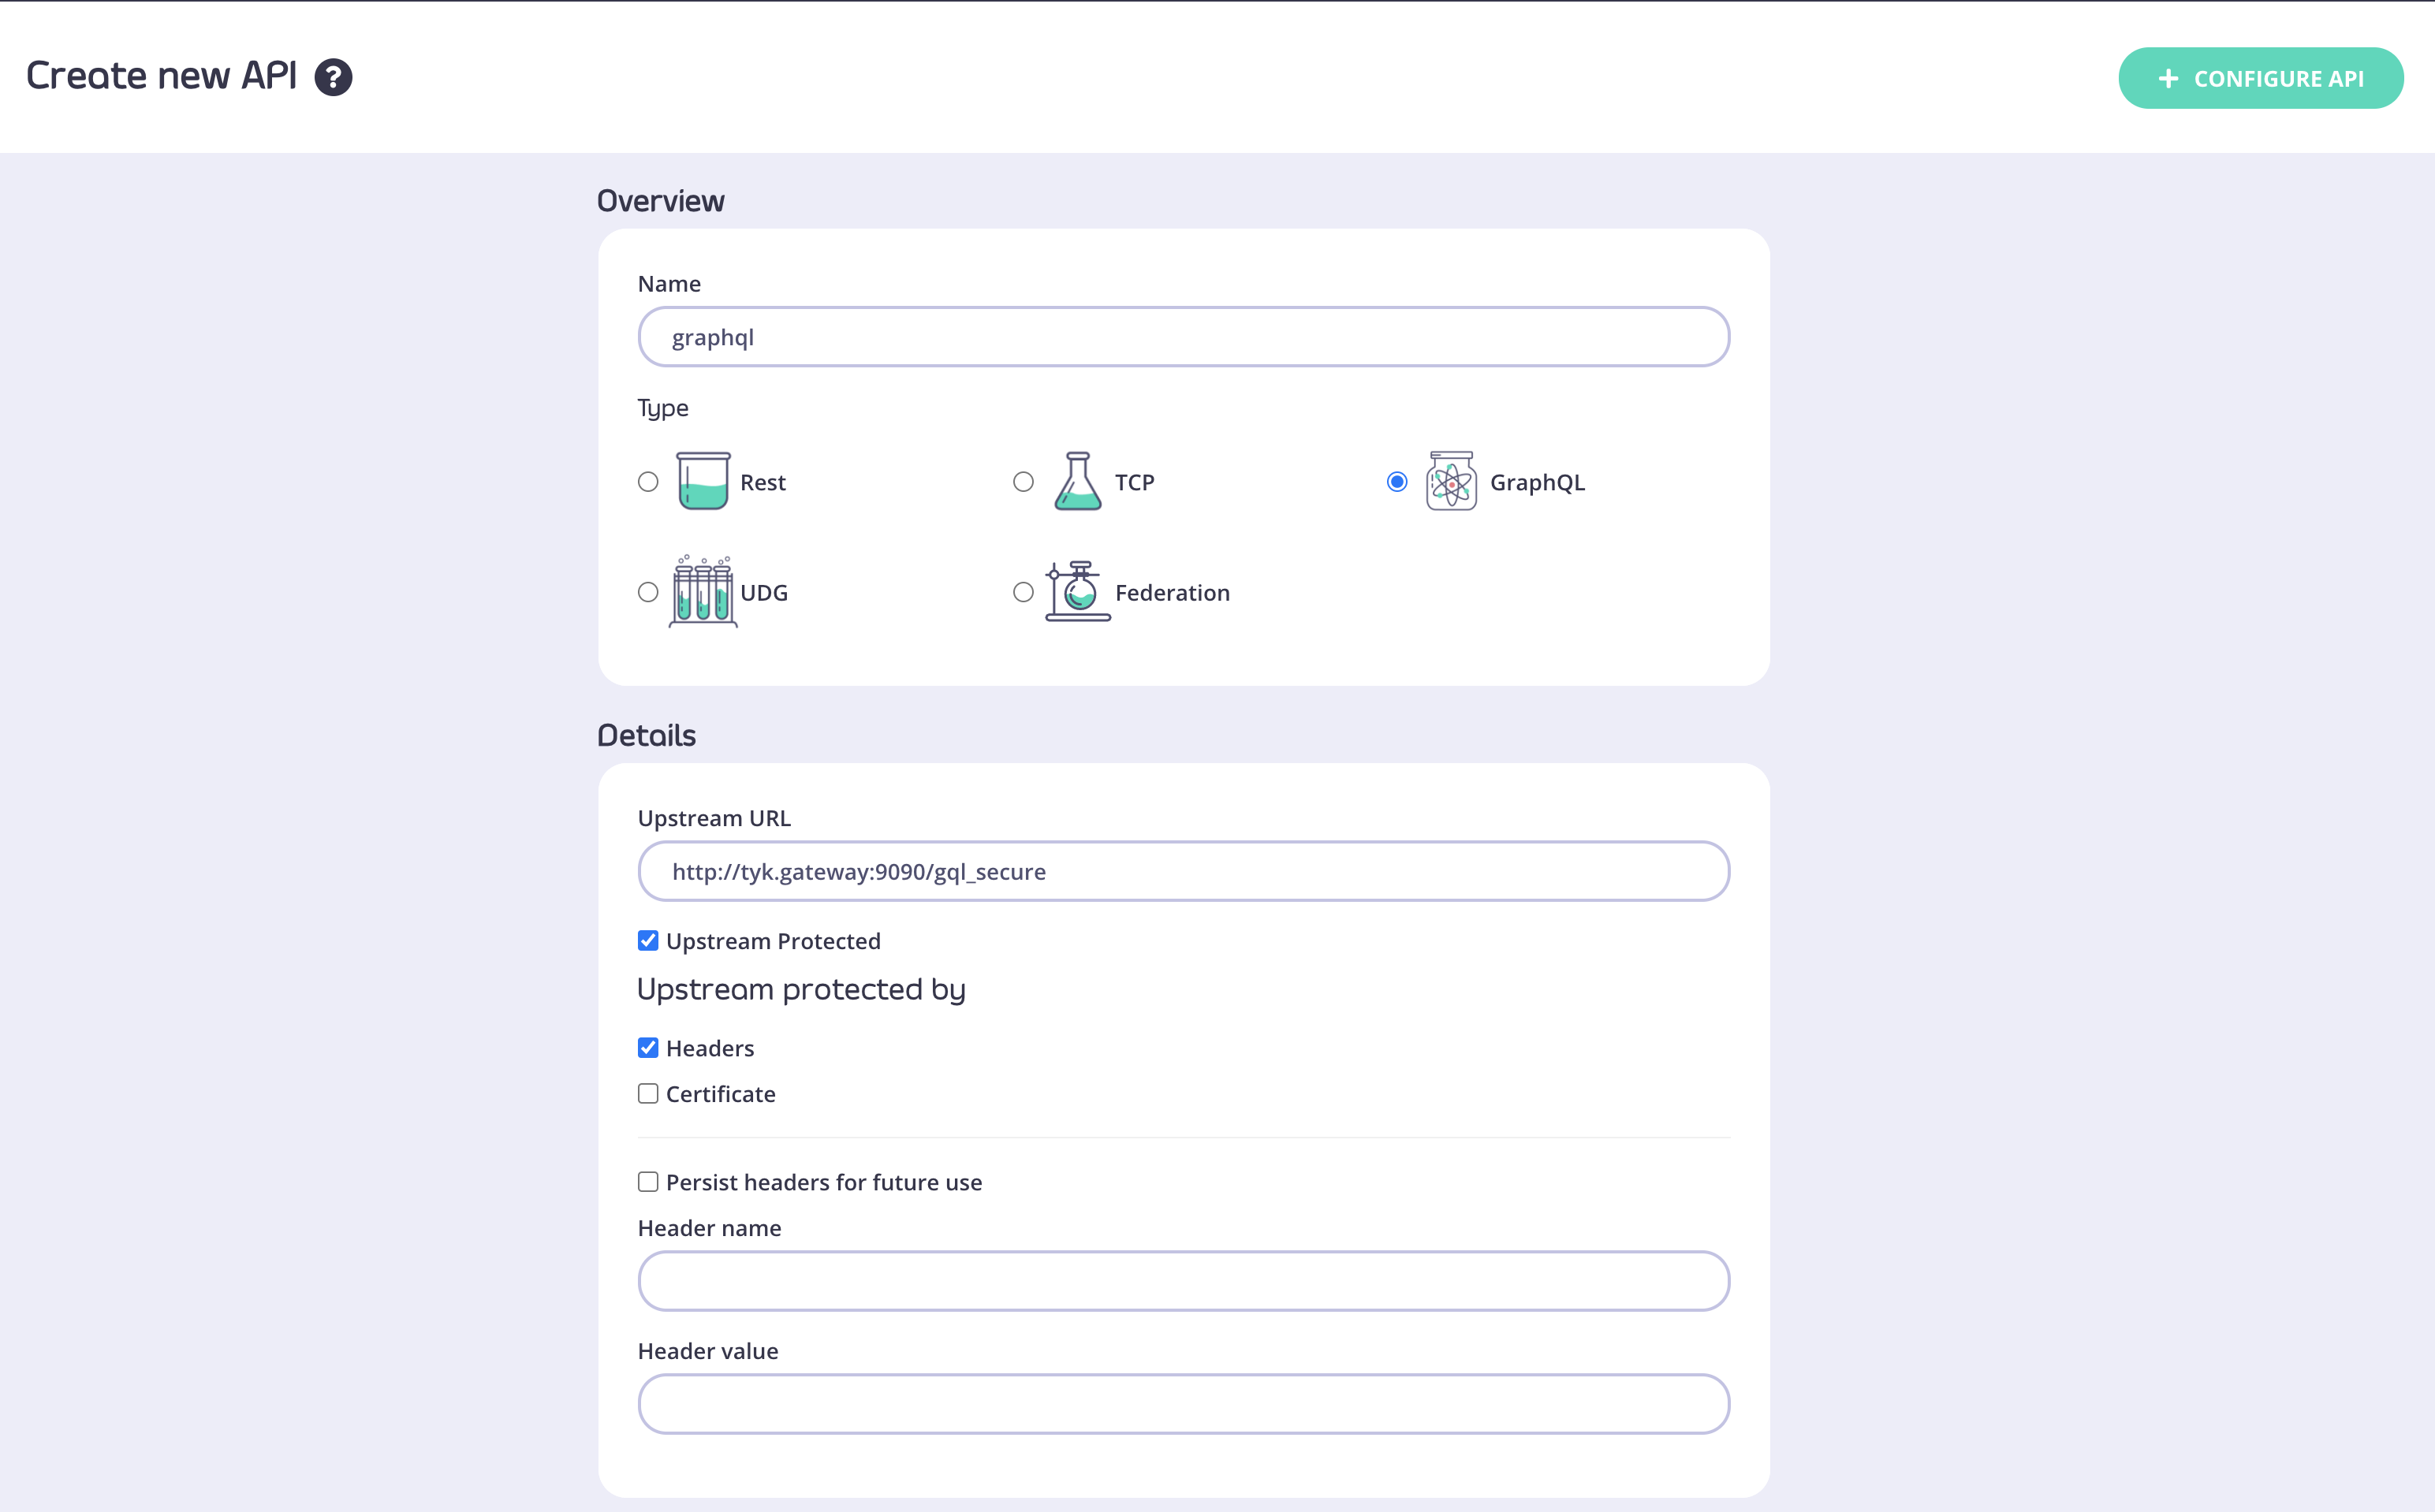
- Log in to the Dashboard and go to APIs > Add New API > GraphQL.
-
Choose a name for your API and provide an upstream URL
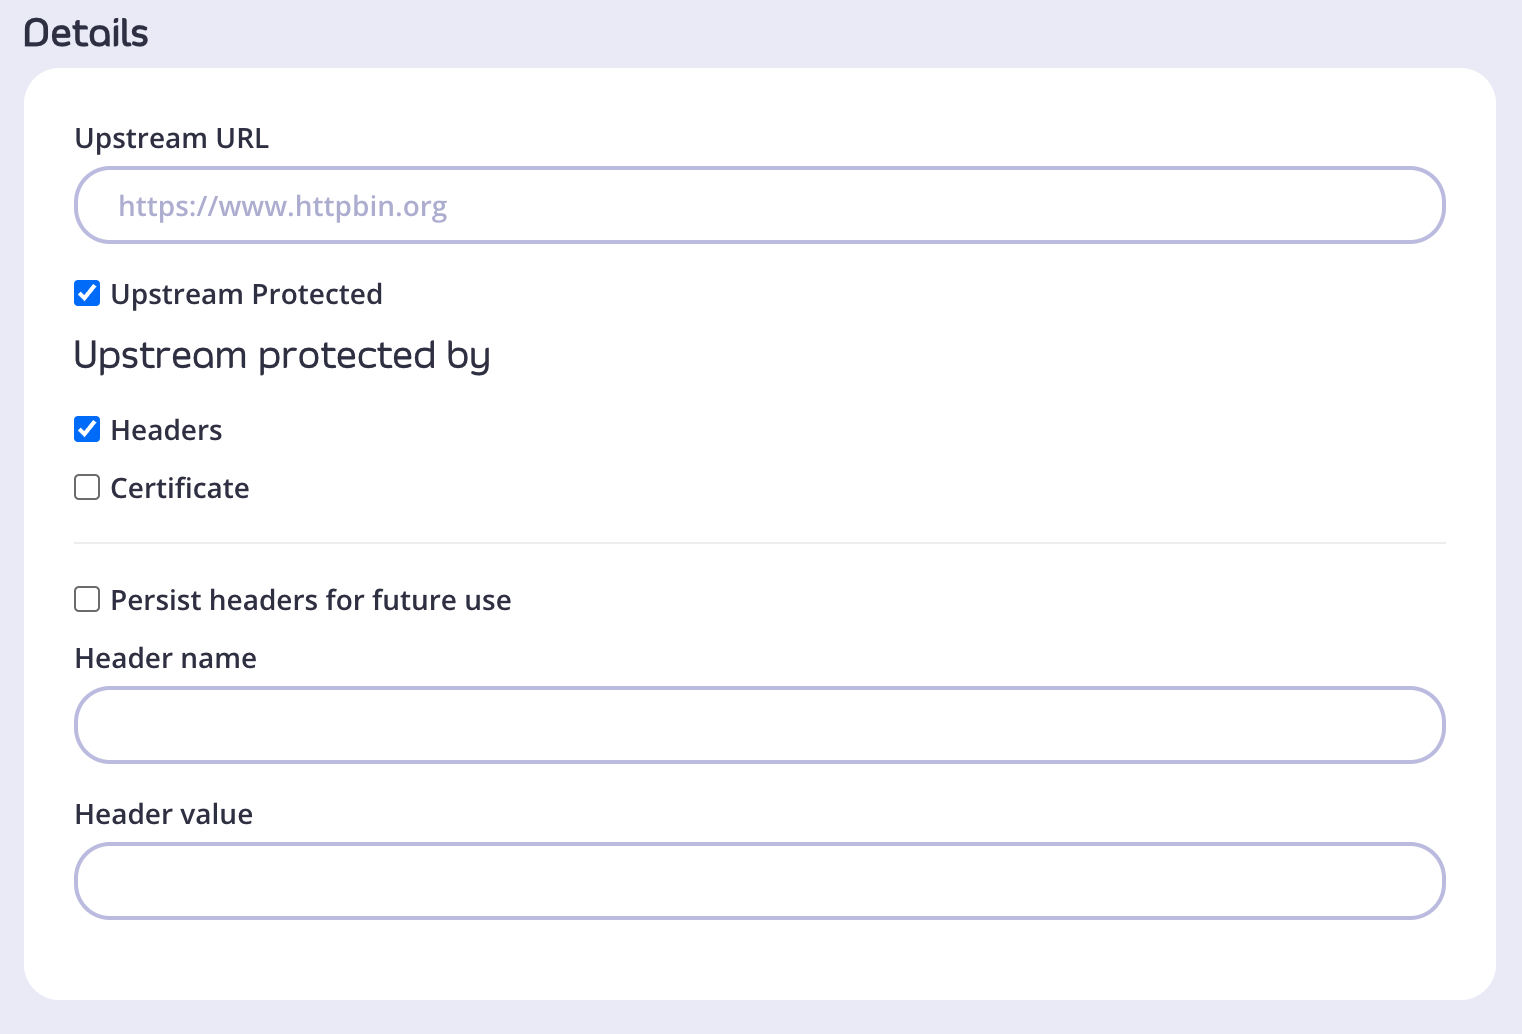
In case your upstream URL is protected, select Upstream Protected and provide authorization details (either Header or Certificate information).
-
In this case, the upstream is protected with Basic Authentication, so we add an Authorization header.
Persist headers for future use checkbox is selected. That way, you will not need to provide the auth headers anymore as they will be persisted in the API definition.
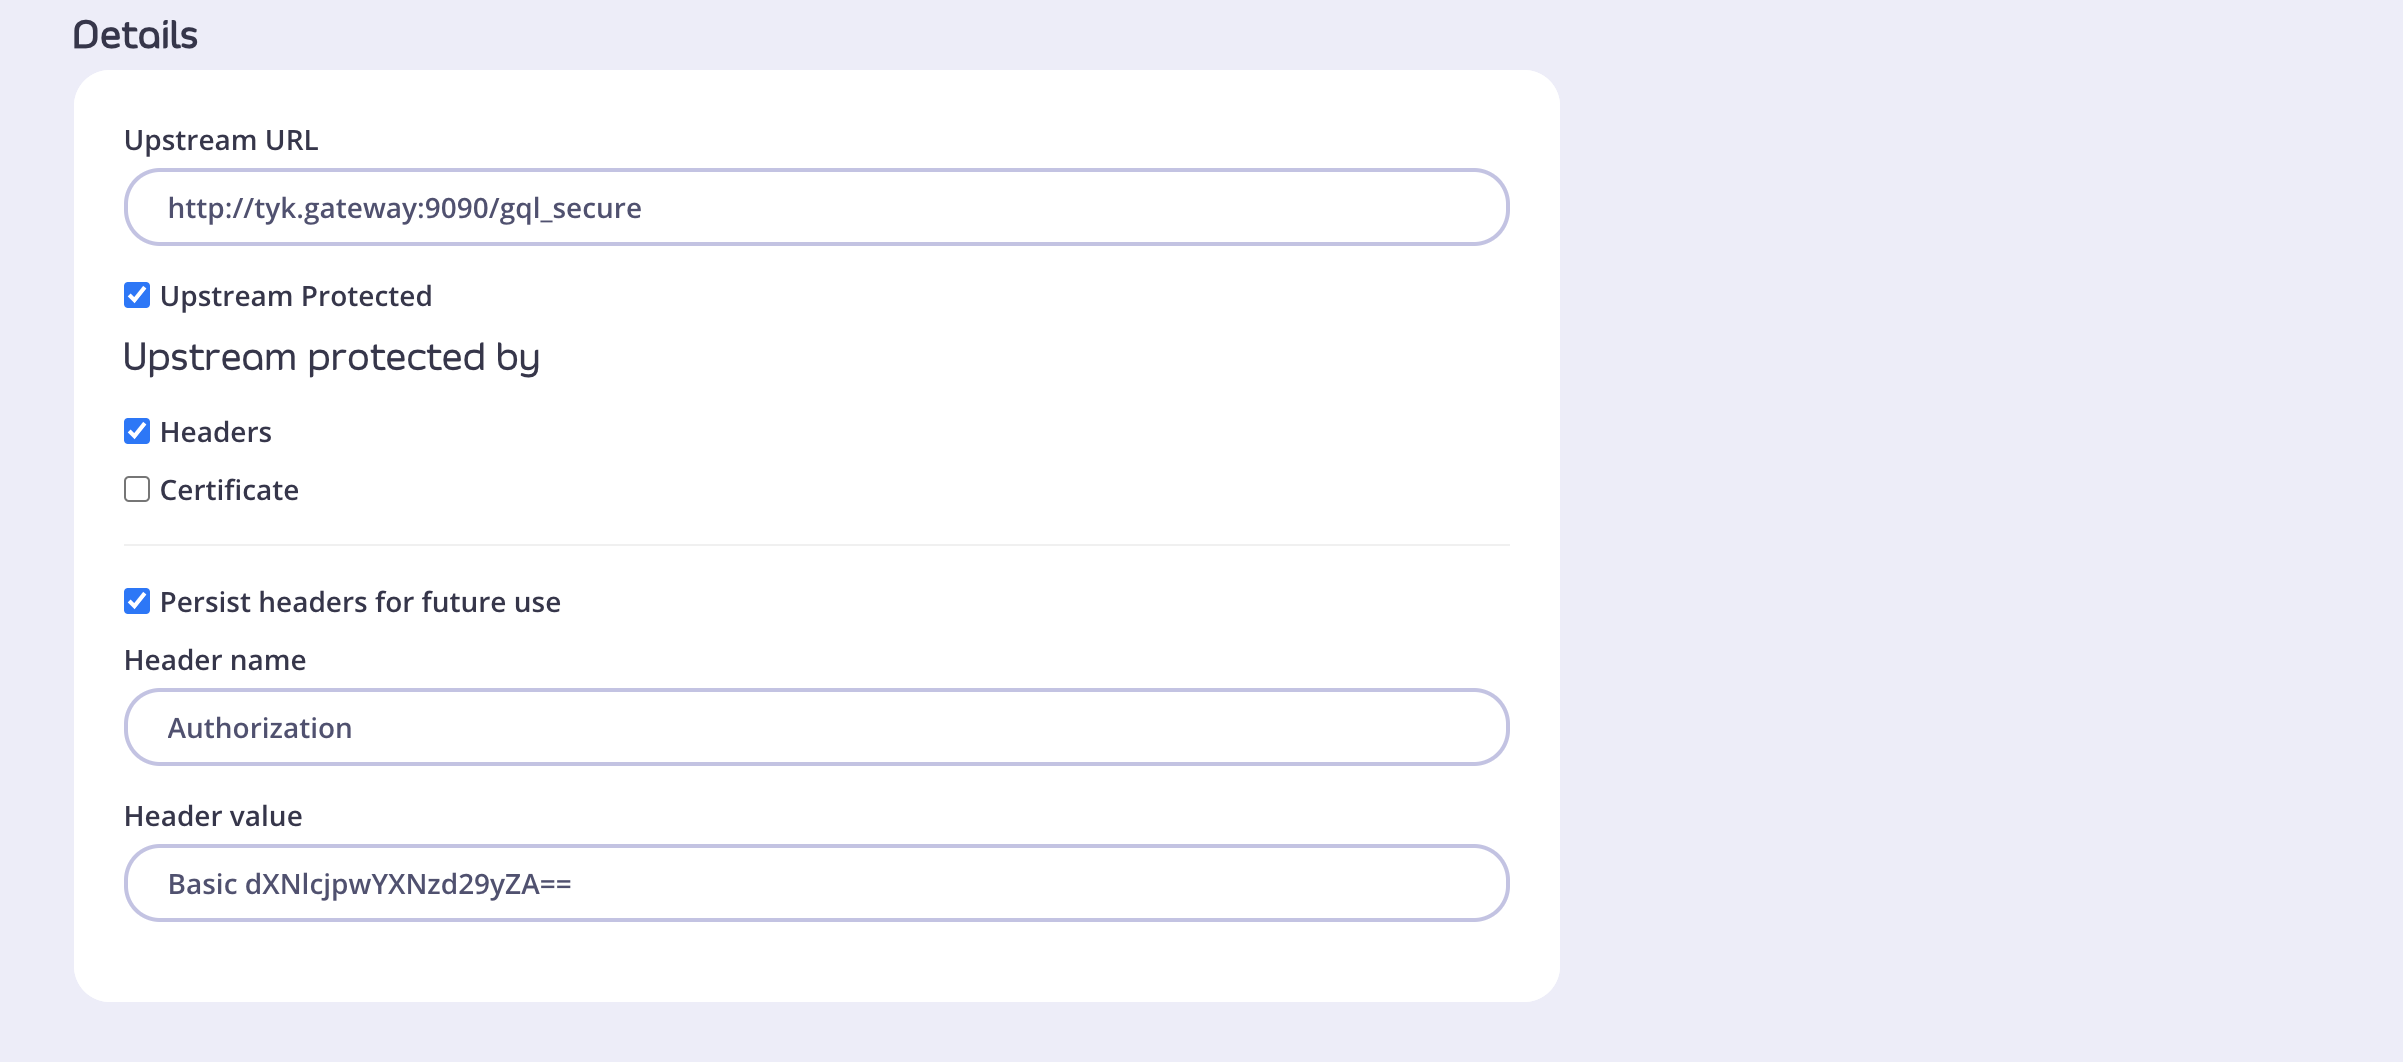
- Once done, click Configure API, and the Dashboard API designer will show up.
- Configure your API and click save, Your API will now be saved.
Managing GQL Schema
There can be a need to update/sync the schema on your GraphQL API, say when the schema on the upstream is updated. The Dashboard UI can show the last time your API schema was synced with the upstream schema.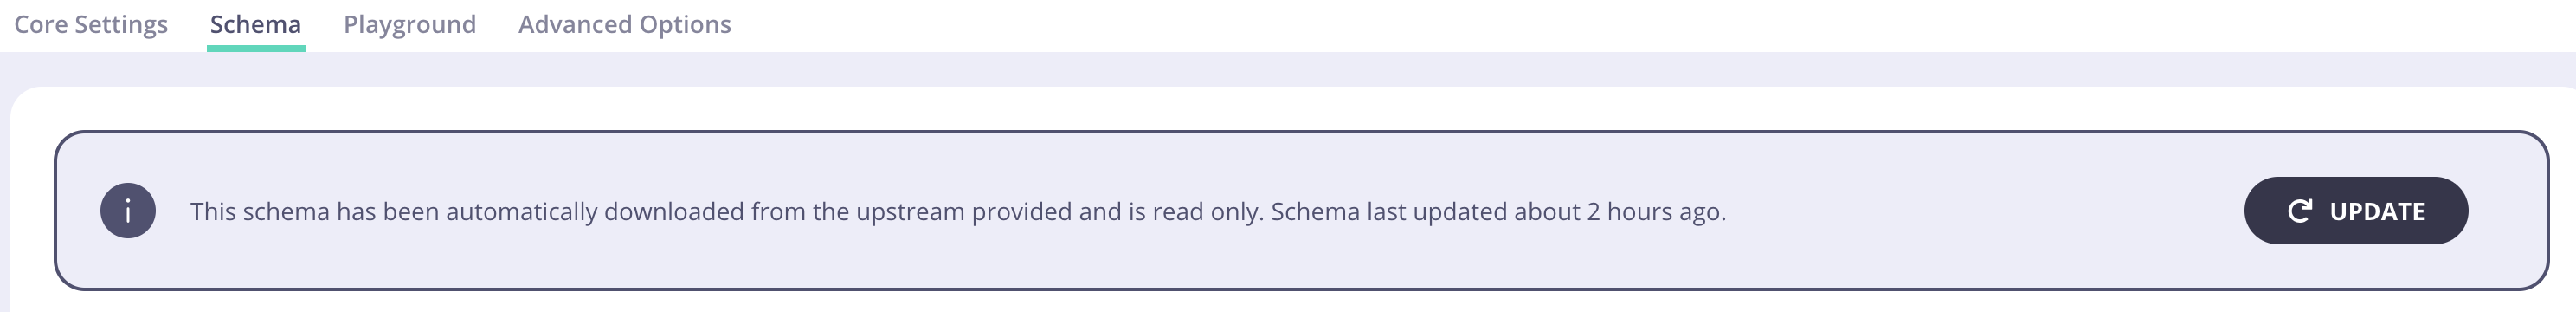
If you upstream is protected, you will need to provide an Authorization Header. In the Dashboard go to your API > Advanced Options > Upstream Auth headers
and fill in your credentials
Policies, Keys, and Developer Portal
Field-based permission
You may want to allow different consumers access to your GraphQL API without exposing all data to them. So for example this could be a schema for a GraphQL API:balance field on type Account, the gateway will respond with:
Complexity Limiting
The complexity of a GraphQL query is about its depth. checkout this query:Developer Portal
As of Tyk v3.0.0, you can now publish GraphQL APIs to the Tyk Developer Portal. This section will show how you can expose a GraphQL API to the developer portal.Introspection
Overview
A GraphQL server can provide information about its schema. This functionality is called introspection and is achievable by sending an introspection query to the GraphQL server. If introspection is a completely new concept for you, browse through the official GraphQL Specification published by the GrapQL Foundation to find out more. When creating a GraphQL proxy in Tyk Dashboard an introspection query is used to fetch the schema from the GraphQL upstream and display it in the schema tab.When using a GraphQL proxy the introspection query is always sent to the GraphQL upstream. This means that changes in the Tyk schema won’t be reflected in the introspection response. You should keep the schemas synchronised to avoid confusion.
Introspection for protected upstreams
When you are creating a GQL API using Tyk Dashboard and your target GQL API is protected, you need to provide authorization details, so that Tyk Gateway can obtain your schema. In the Create new API screen you have to tick the Upstream Protected option under your Upstream URL.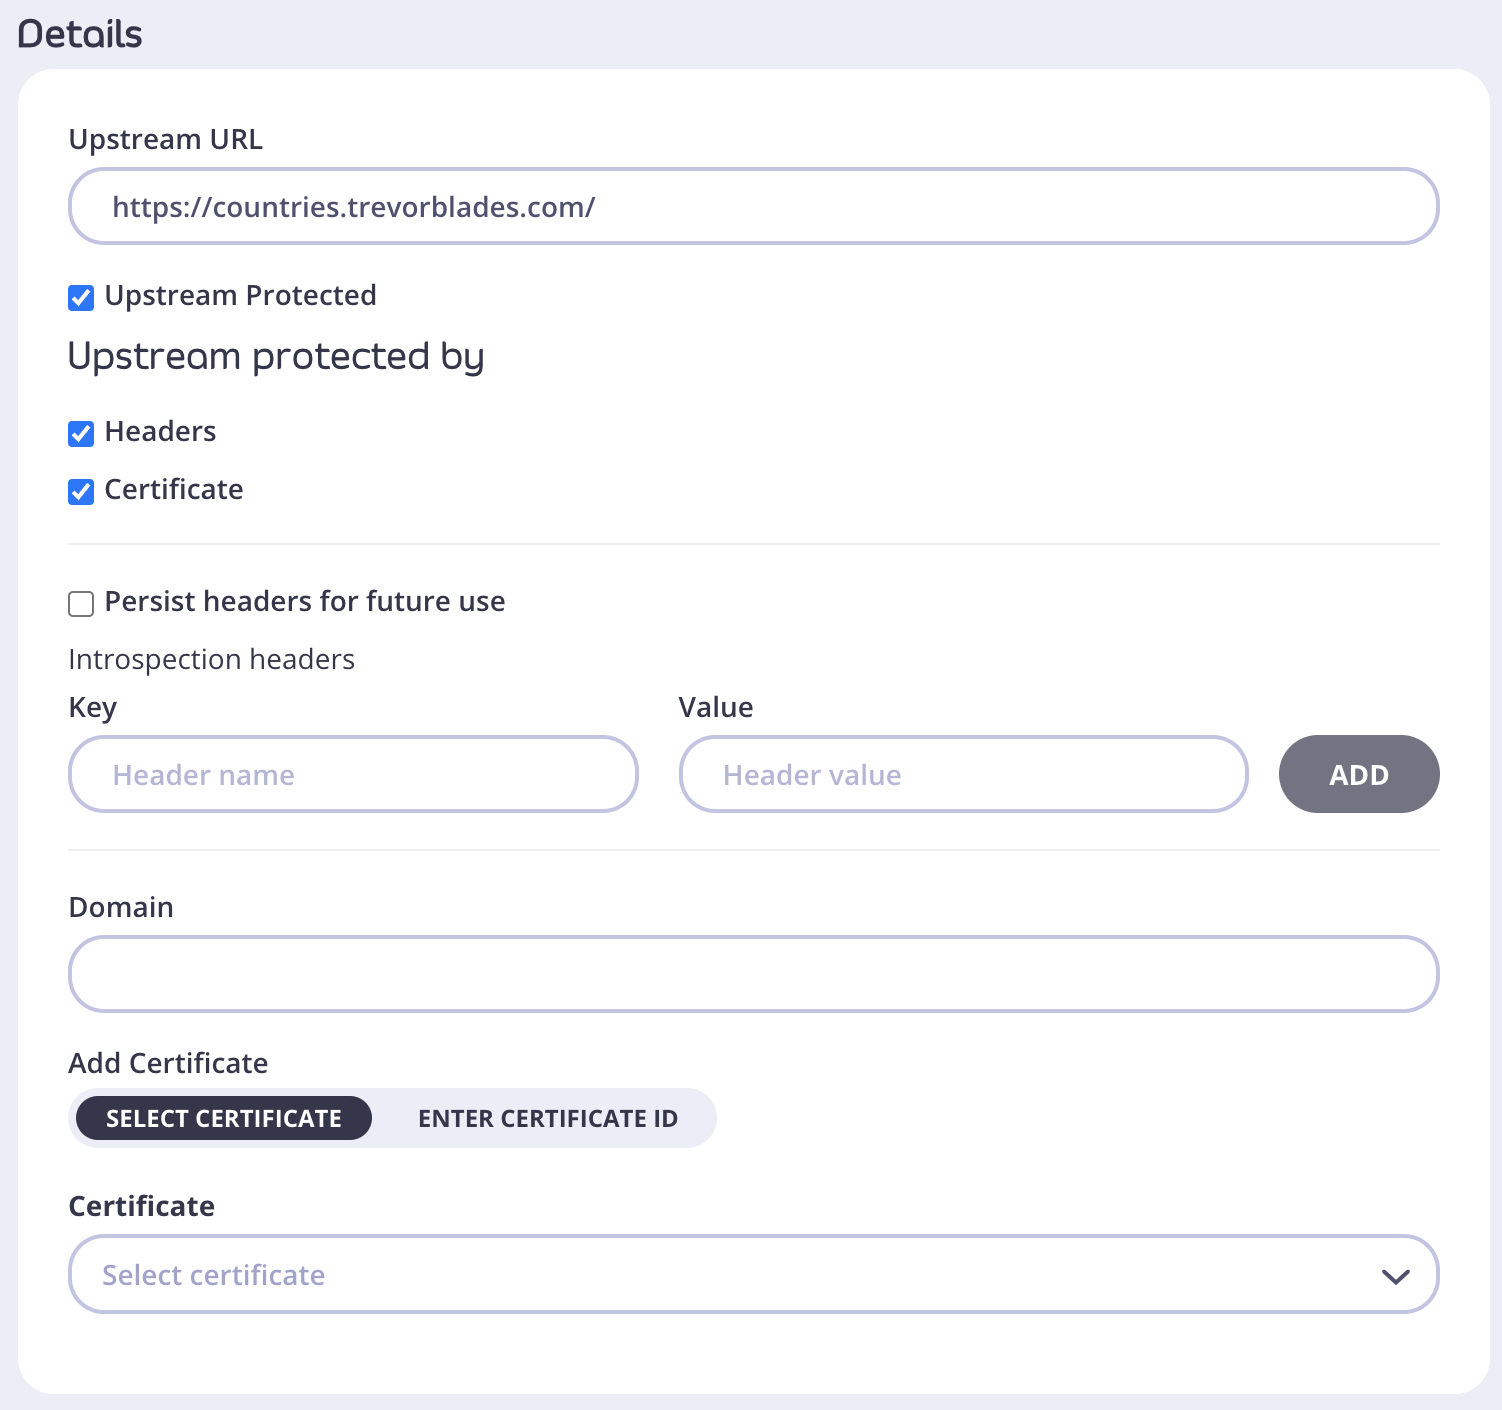
- From the Upstream protected by section choose the right option for your case: Headers or Certificate.
- Choosing Headers will allow you to add multiple key/value pairs in Introsopection headers section.
- You can also Persist headers for future use by ticking that option. This will save information you provided in case in the future your schema changes and you need to sync it again. To understand better where this information will be saved, go to GQL Headers. To read more about schema syncing go here.
- Choosing Certificate will allow you to provide Domain details and either Select certificate or Enter certificate ID.
Turning off introspection
The introspection feature should primarily be used as a discovery and diagnostic tool for development purposes. Problems with introspection in production:- It may reveal sensitive information about the GraphQL API and its implementation details.
- An attacker can discover potentially malicious operations.
- Tyk Dashboard
- Tyk Dashboard and Gateway API
- Tyk Dashboard
- Tyk APIs
First, check the general information on how to create a security policy with TykFor GraphQL APIs the API ACCESS section will show additional, GQL-specific options that can be enabled.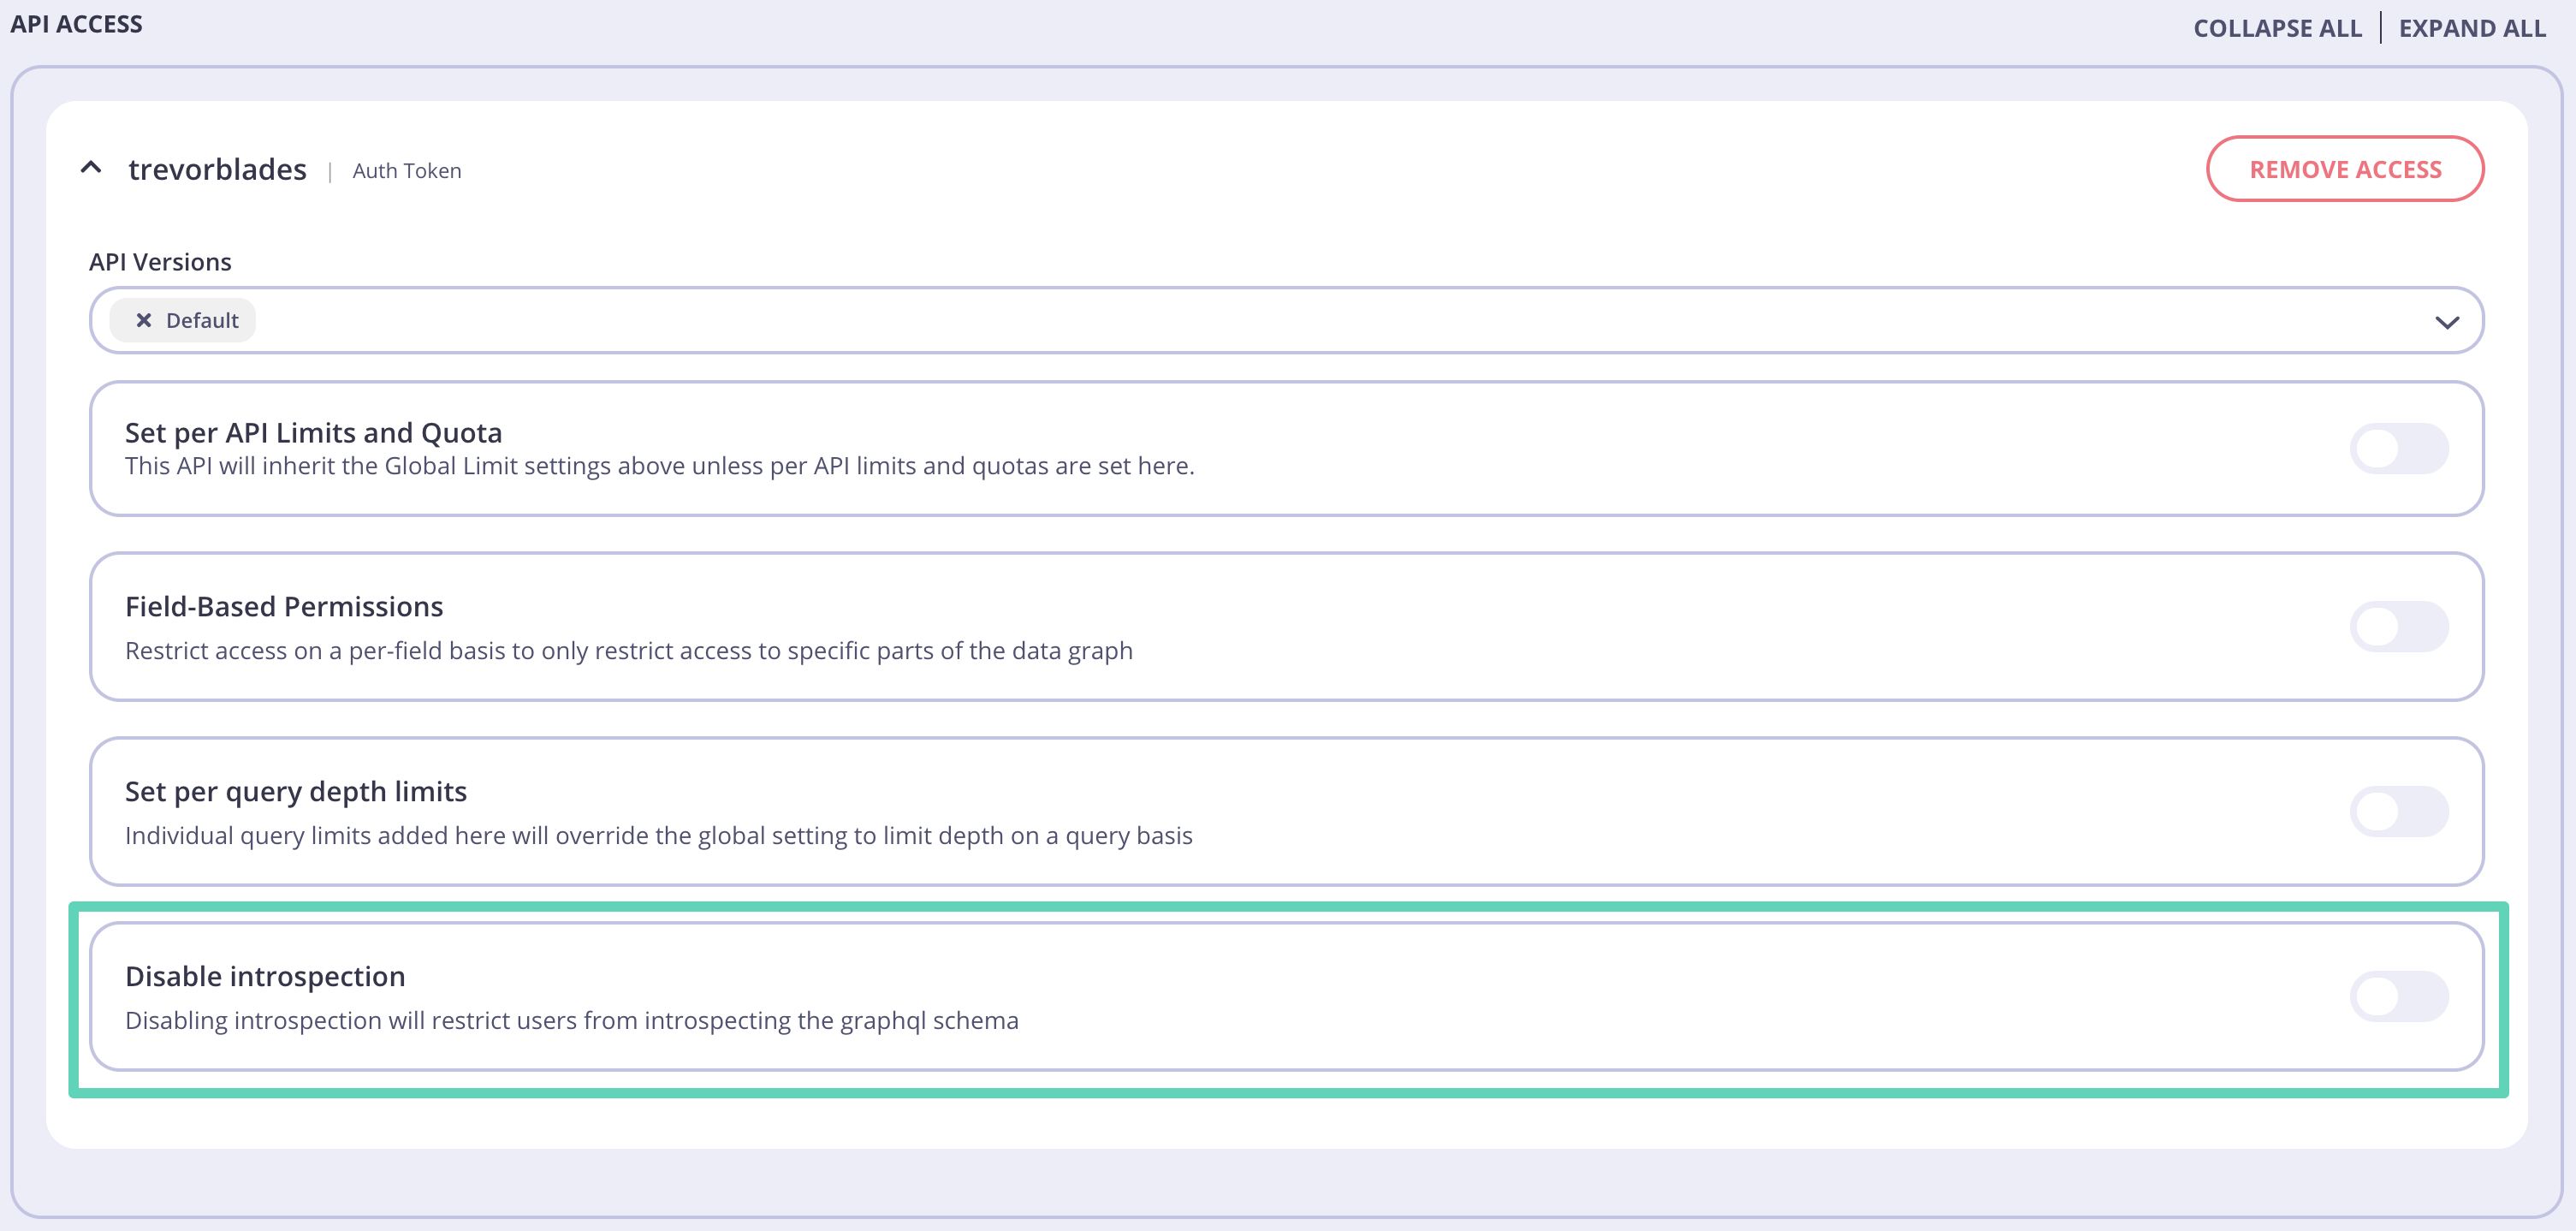
Introspection Queries
Any GraphQL API can be introspected with the right introspection query. Here’s some examples on what introspection queries can look like and what information you can learn about the GraphQL service using them.Introspecting all types
This query will respond with information about all types and queries defined in the schema. Additional information like name, description and kind will also be provided.Introspecting single type details
If you want to know more about a certain type in the schema, you can use the following query:Introspecting types associated with an interface
The query to introspect a single type can be used for any type, but you might prefer a simpler response for types such asinterface. With this query you can get a list of objects that implements a specific interface.
Introspecting ENUM values
Anenum type defines a set of discrete values. With this query you can get a complete list of those values for a chosen enum.
Introspecting query definitions
GraphQL requires queries to be defined in a special typeQuery in the schema. You can use the below introspection query to find out more about a query operations of the graph.
You might find GQL APIs where the
Query type is called QueryRoot. In those cases the above introspection query needs to be modified in line 2 to: __type(name: "QueryRoot")Introspecting mutation and subscription definitions
You should use the same introsopection query as you would forQuery type, just change the name argument to Mutation or Subscription.
Full introspection
If you prefer to introspect GraphQL all at once, you can do that by sending this query:Validation
In order to prevent errors happening during request processing or sending invalid queries to the upstream Tyk supports the validation of GraphQL queries and schemas.Query Validation
Tyk’s native GraphQL engine supports validating GraphQL queries based on the GraphQL Specification. Both the GraphQL engine in front of your existing GraphQL API as well as any Universal Data Graph you build gets protected with a validation middleware. This means, no invalid request will be forwarded to your upstream. The Gateway will catch the error and return it to the client.Schema Validation
A broken schema can lead to undesired behaviors of the API including queries not being processed by the GraphQL middleware. As the search for the root cause for such a malfunction can be tedious, Tyk provides schema validation.Schema validation is only available when using the Dashboard or Dashboard API.
- No duplicated operation types (Query, Mutation, Subscription)
- No duplicated type names
- No duplicated field names
- No duplicated enum values
- No usage of unknown types
GraphQL APIs headers
Users can set up two kinds of headers when configuring GraphQL APIs:- Introspection headers
- Request headers
Introspection headers
Tyk Dashboard can introspect any upstream GraphQL API and download a copy of the GQL schema. That schema will be displayed in the Schema tab. For protected upstreams that require authorization for introspection, Tyk allows you to persist authorization headers within the GraphQL API configuration using Introspection headers.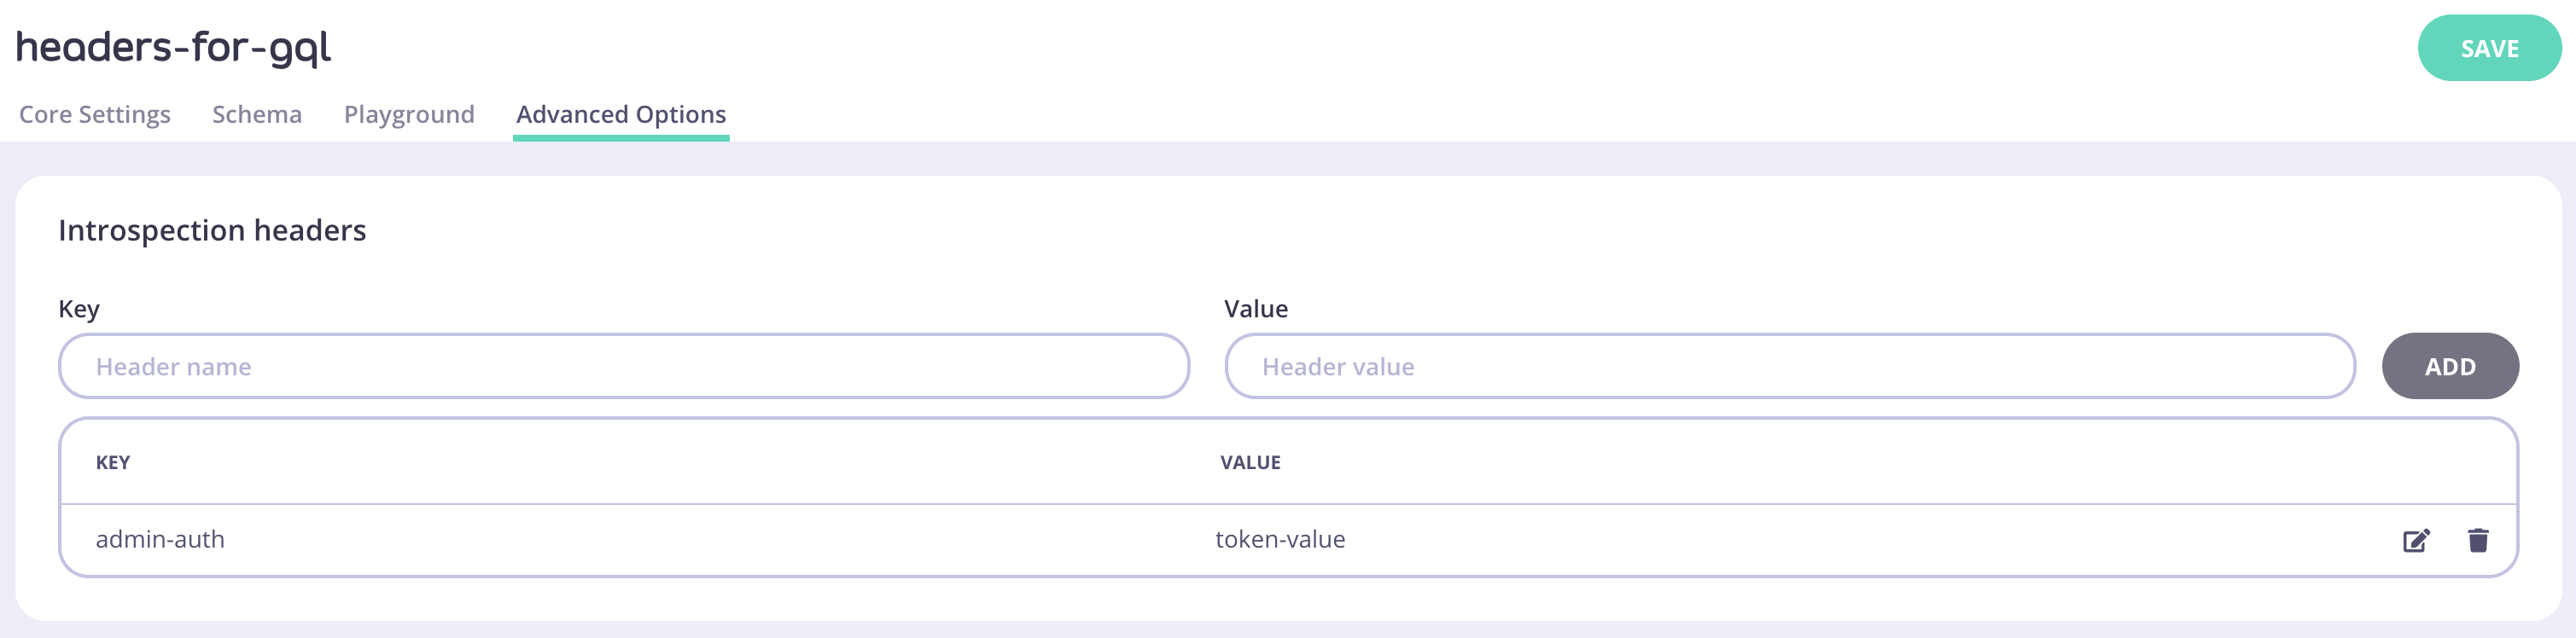
Request headers
You can enrich any GraphQL request proxied through Tyk Gateway with additional information in the headers by configuring Request headers in the Tyk Dashboard.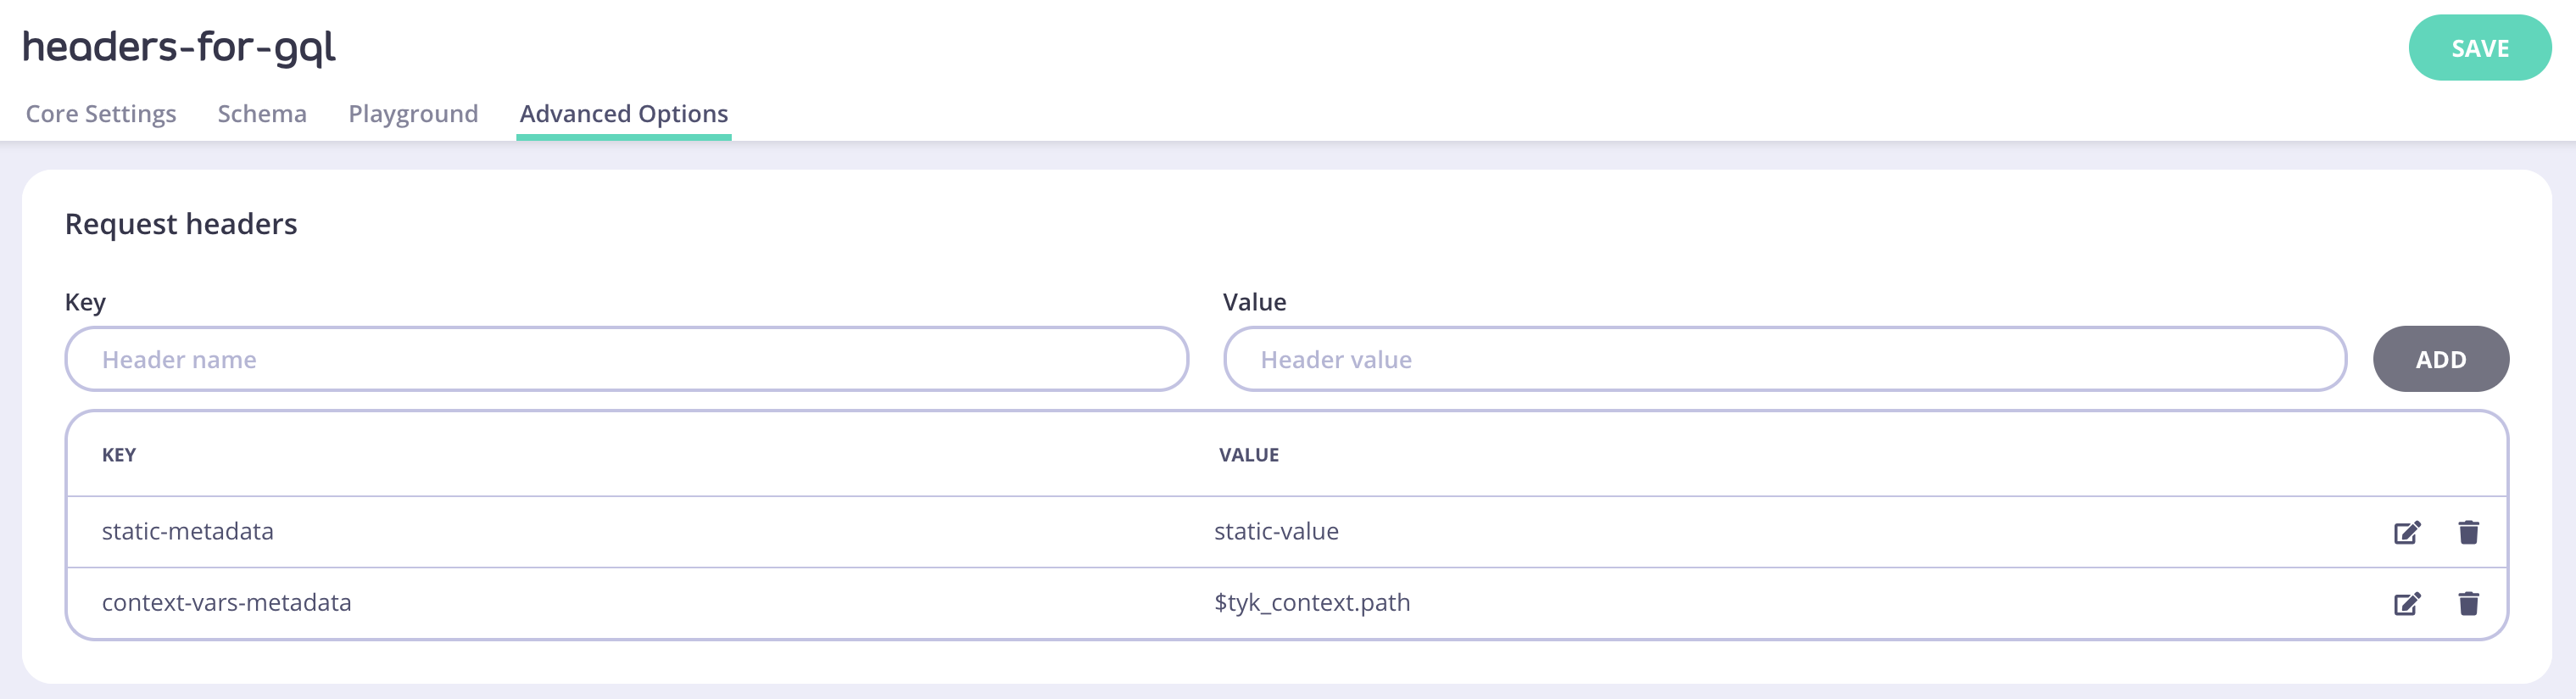
Syncing GQL Schema
A GraphQL Proxy API maintains a copy of the upstream GraphQL schema. When the upstream schema changes, these updates need to be reflected in the proxy schema. To manage this, Tyk Dashboard stores the timestamp of the last schema change each time a GraphQL API is updated. This timestamp helps identify whether the schema is outdated and needs to be synced with the upstream version. You can find this information above the schema editor. To sync the schema, click the Resync button.Syncing schemas is only available for proxy-only GraphQL APIs and not for UDG.
Persisting GraphQL queries
Tyk Gateway4.3.0 release includes a way to expose GraphQL queries as REST endpoints. For now, this can only be configured via the raw API definition, Tyk Dashboard support is coming soon.
How to persist GraphQL query
The ability to expose a GraphQL query as a REST endpoint can be enabled by adding thepersist_graphql section of the extended_paths on an HTTP type in any API version you intend to use to serve as the GraphQL query to REST endpoint proxy.
Here is a sample REST API proxy for the HTTP type API:
Adding versions
On its own, this isn’t particularly remarkable. To enable GraphQL to REST middleware, modify the Default version like so:extended_paths.persist_graphql field. The persist_graphql object consists of three fields:
method: The HTTP method used to access that endpoint, in this example, any GET requests to <PROXY ENDPOINT>/getContinentByCode will be handled by the persist graphql middleware
path: The path the middleware listens to
operation: This is the GraphQL operation (query in this case) that is sent to the upstream.
variables: A list of variables that should be included in the upstream request.
If you run a request to your proxy, you should get a response similar to this:
Dynamic variables
We have seen support for passing static variable values via the API definition, but there will be cases where we want to extract variables from the request header or URL. More information about available request context variables in Tyk can be found here Below is an examples of using an incomingcode header value as a variable in persist_graphql middleware configuration:
"code": "UK", should result in a response similar to this:
persist_graphql block to this:
/getCountryByCode/NG you should get a result similar to this:
Complexity Limiting
Depending on the GraphQL schema an operation can cause heavy loads on the upstream by using deeply nested or resource-expensive operations. Tyk offers a solution to this issue by allowing you to control query depth and define its max value in a policy or directly on a key.Deeply nested query
Even if you have a simple GraphQL schema, that looks like this:Query depth limit
Deeply nested queries can be limited by setting a query depth limitation. The depth of a query is defined by the highest amount of nested selection sets in a query. Example for a query depth of2:
3:
Enable depth limits from the Dashboard
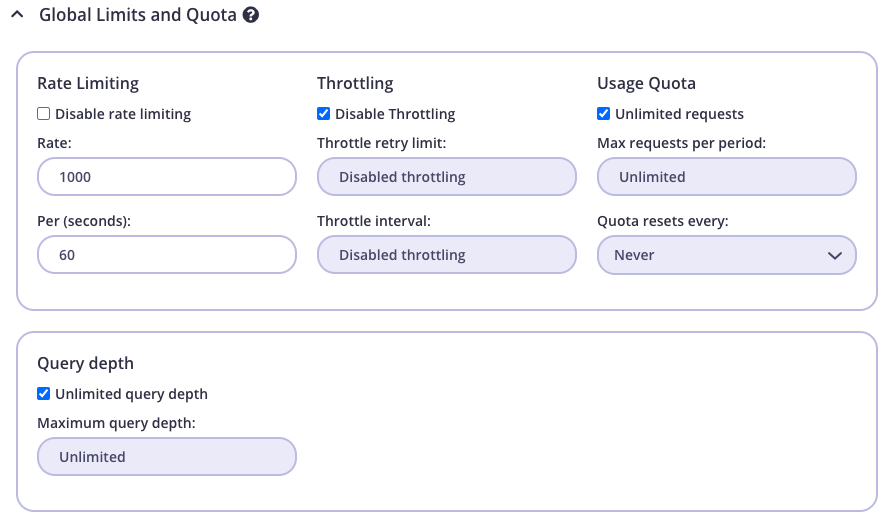
Query depth limitation can be applied on three different levels:- Key/Policy global limits and quota section. (
Global Limits and Quota) The query depth value will be applied on all APIs attached on a Key/Policy.- Optional: Configure a Policy from System Management > Policies > Add Policy.
- From System Management > Keys > Add Key select a policy or configure directly for the key.
- Select your GraphQL API (marked as GraphQL). (if Policy is not applied on Key)
- Change the value for Query depth, from
Global Limits and Quotaby unchecking the Unlimited query depth checkmark and insert the maximum allowed query depth.
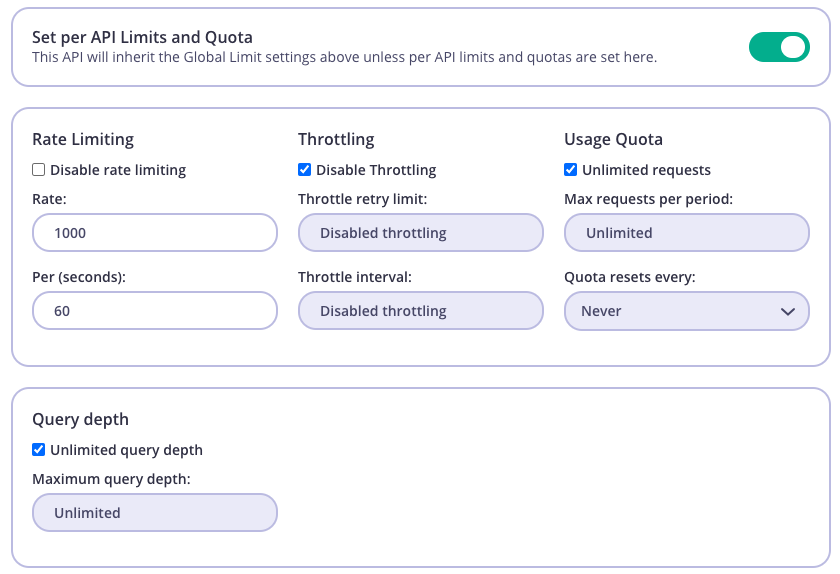
- API limits and quota. (
Set per API Limits and Quota) This value will overwrite any value registered for query depth limitation on global Key/Policy level, and will be applied on all fields for Query and Mutation types defined within the API schema.- Optional: Configure a Policy from System Management > Policies > Add Policy.
- From System Management > Keys > Add Key select a policy or configure directly for the key.
- Select your GraphQL API (marked as GraphQL). (if Policy is not applied on Key)
- Enable
Set per API Limits and Quotasection. - Change the value for Query depth, from API level, by unchecking the Unlimited query depth checkmark and insert the maximum allowed query depth
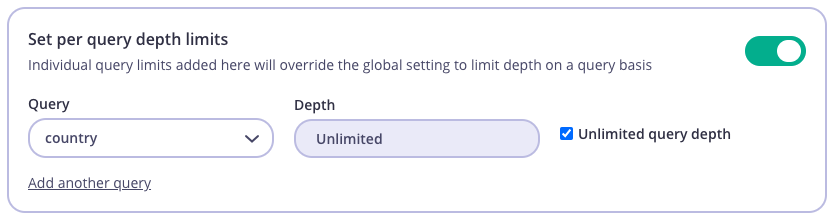
- API per query depth limit. (
Set per query depth limits) By setting a query depth limit value on a specific Query/Mutation type field, will take highest priority and all values set on first 2 steps will be overwritten.- Optional: Configure a Policy from System Management > Policies > Add Policy.
- From System Management > Keys > Add Key select a policy or configure directly for the key.
- Select your GraphQL API (marked as GraphQL). (if Policy is not applied on Key)
- Enable
Set per query depth limitssection. - Add as many queries you want to apply depth limitation on.
Enable depth limits using Tyk APIs
You can set the same query depth limits using the Tyk Gateway API (for open-source users) or Tyk Dashboard API. To make it easier we have Postman collections you can use. Global query depth limit for Key/Policy In the key/policy json you need to make sure this section has your desiredmax_query_depth set:
field_access_rights per API are set correctly:
Setting the depth limit to
-1 in any of the above examples will allow Unlimited query depth for your consumers.Field Based Permissions
You may want to allow different consumers access to your GraphQL API without exposing all data to them. So for example this could be a schema for a GraphQL API:balance for example.
Field access can be restricted by setting up field based permissions in a policy or directly on a key.
When a field is restricted and used in a GraphQL operation, the consumer will receive an error response (400 Bad Request):
Field based permissions with the list of allowed types
Field access can be restricted by setting up an allowed types list in a policy or directly on a key. If new fields are added to the GraphQL schema, you don’t need to update the field-based permissions. This is because the fields that are not in the list of allowed types are automatically access-restricted. First, you need to learn how to create a security policy with the API or how to create an API Key with the API. Once you learn how to utilize the API to create a security policy or key, you can use the following snippet:owner. When any other fields are used in a GraphQL operation, the consumer will receive an error response (400 Bad Request):
Allow or restrict all fields with the asterisk operator
You can allow or restrict all fields of a type by using an asterisk (*) operator. Any new fields of that type will be allowed or blocked by default. For example:Query and Account types. Please note that the asterisk operator does not work recursively. For example, in the example below, the asterisk operator only allows access to fields of the Query type. Fields of the Account type remain restricted.
Account type.
Please note that the list of allowed types overrides the list of restricted types.
Setup field based permissions in Dashboard
Restricted and allowed types and fields can also be set up via Tyk Dashboard.- Optional: Configure a Policy from System Management > Policies > Add Policy.
- From System Management > Keys > Add Key select a policy or configure directly for the key.
- Select your GraphQL API (marked as GraphQL).
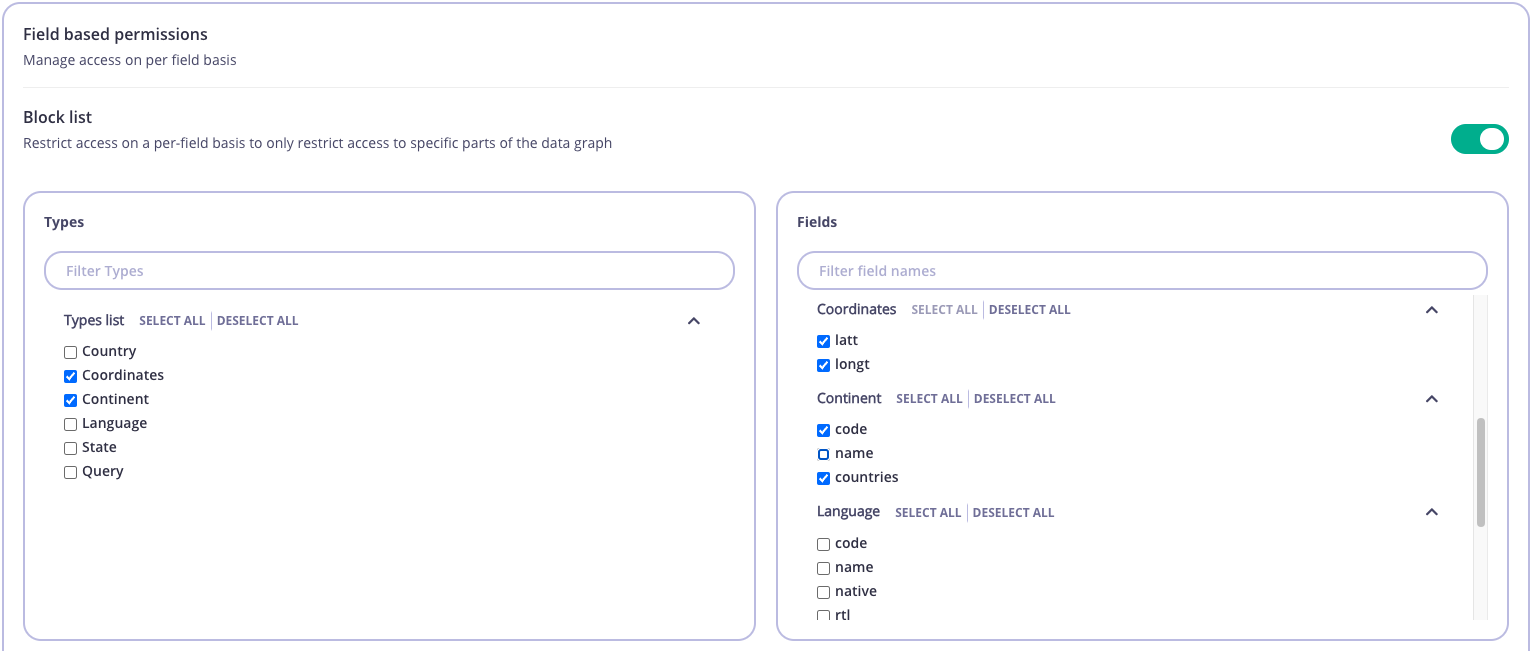
- Enable either Block list or Allow list. By default, both are disabled. It’s not possible to have both enabled at the same time - enabling one switch automatically disables the other.
Block list
By default all Types and Fields will be unchecked. By checking a Type or Field you will disallow to use it for any GraphQL operation associated with the key. For example, the settings illustrated below would block the following:codeandcountriesfields inContinenttype.lattandlongtfields inCoordinatestype.
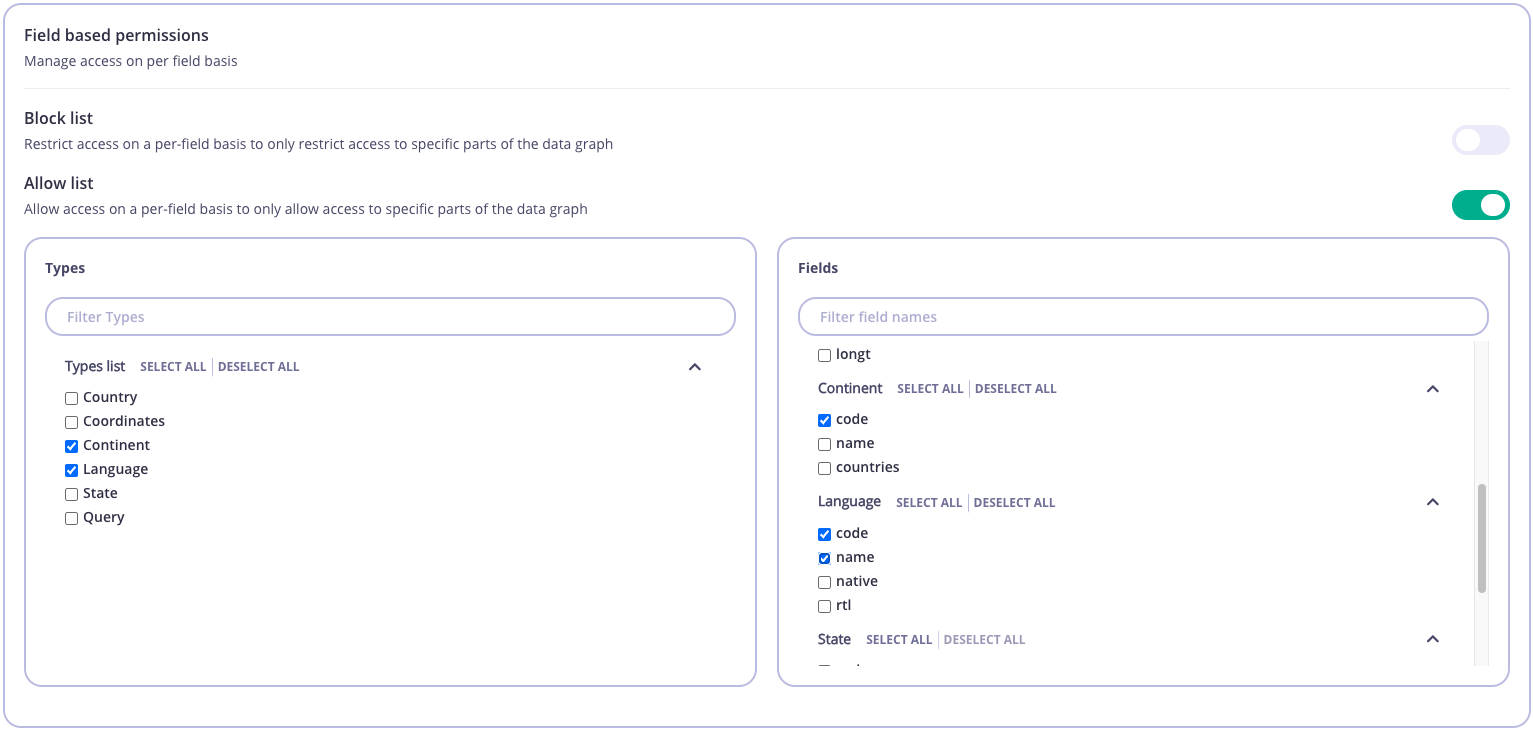
Allow list
By default all Types and Fields will be unchecked. By checking a Type or Field you will allow it to be used for any GraphQL operation associated with the key. For example, the settings illustrated below would only allow the following:codefield inContinenttype.codeandnamefields inLanguagetype.
Query type is unchecked, which indicates that all fields in Query type are unchecked. Subsequently, you will not be able to run any query.
GraphQL Federation
Overview
Federation Version Support
Tyk supports Federation v1What is federation?
Ease-of-use is an important factor when adopting GraphQL either as a provider or a consumer. Modern enterprises have dozens of backend services and need a way to provide a unified interface for querying them. Building a single, monolithic GraphQL service is not the best option. It leads to a lot of dependencies, over-complication and is hard to maintain. To remedy this, Tyk, with release 4.0 offers GraphQL federation that allows you to divide GQL implementation across multiple back-end services, while still exposing them all as a single graph for the consumers.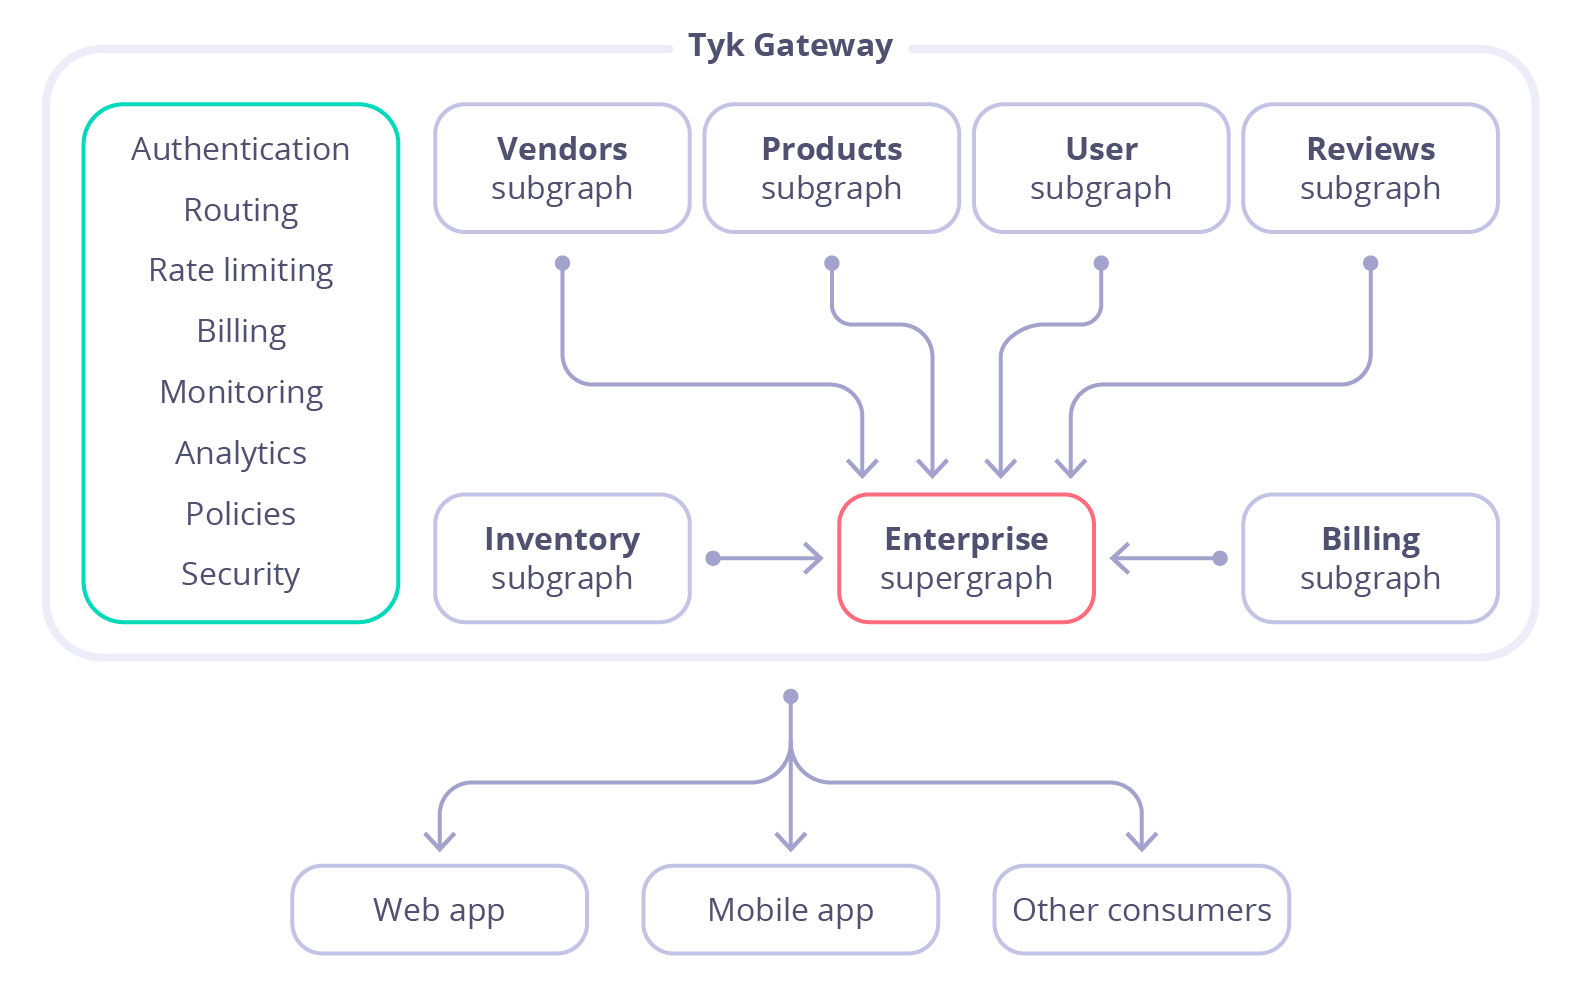
Subgraphs and supergraphs
Subgraph is a representation of a back-end service and defines a distinct GraphQL schema. It can be queried directly as a separate service or it can be federated into a larger schema of a supergraph. Supergraph is a composition of several subgraphs that allows the execution of a query across multiple services in the backend.Subgraphs examples
UsersSubgraph conventions
-
A subgraph can reference a type that is defined by a different subgraph. For example, the Review type defined in the last subgraph includes an
authorfield with typeUser, which is defined in a different subgraph. -
A subgraph can extend a type defined in another subgraph. For example, the Reviews subgraph extends the Product type by adding a
reviewsfield to it. -
A subgraph has to add a
@keydirective to an object’s type definition so that other subgraphs can reference or extend that type. The@keydirective makes an object type an entity.
Supergraph schema
After creating all the above subgraphs in Tyk, they can be federated in your Tyk Gateway into a single supergraph. The schema of that supergraph will look like this:Creating a subgraph via the Dashboard UI
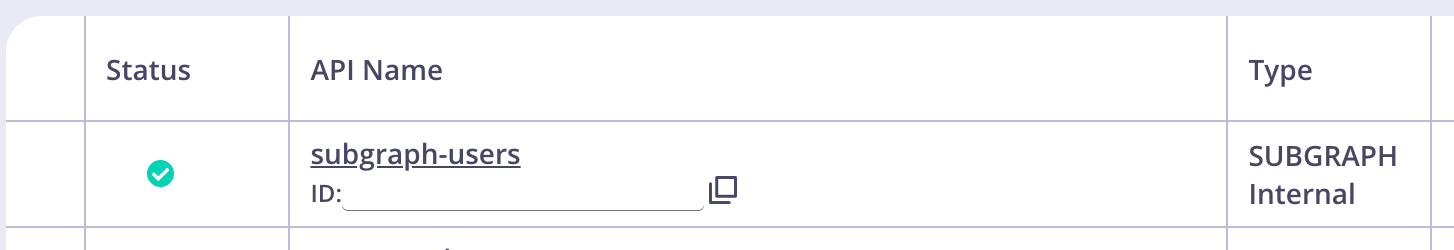
- Log in to the Dashboard and go to APIs > Add New API > Federation > Subgraph.
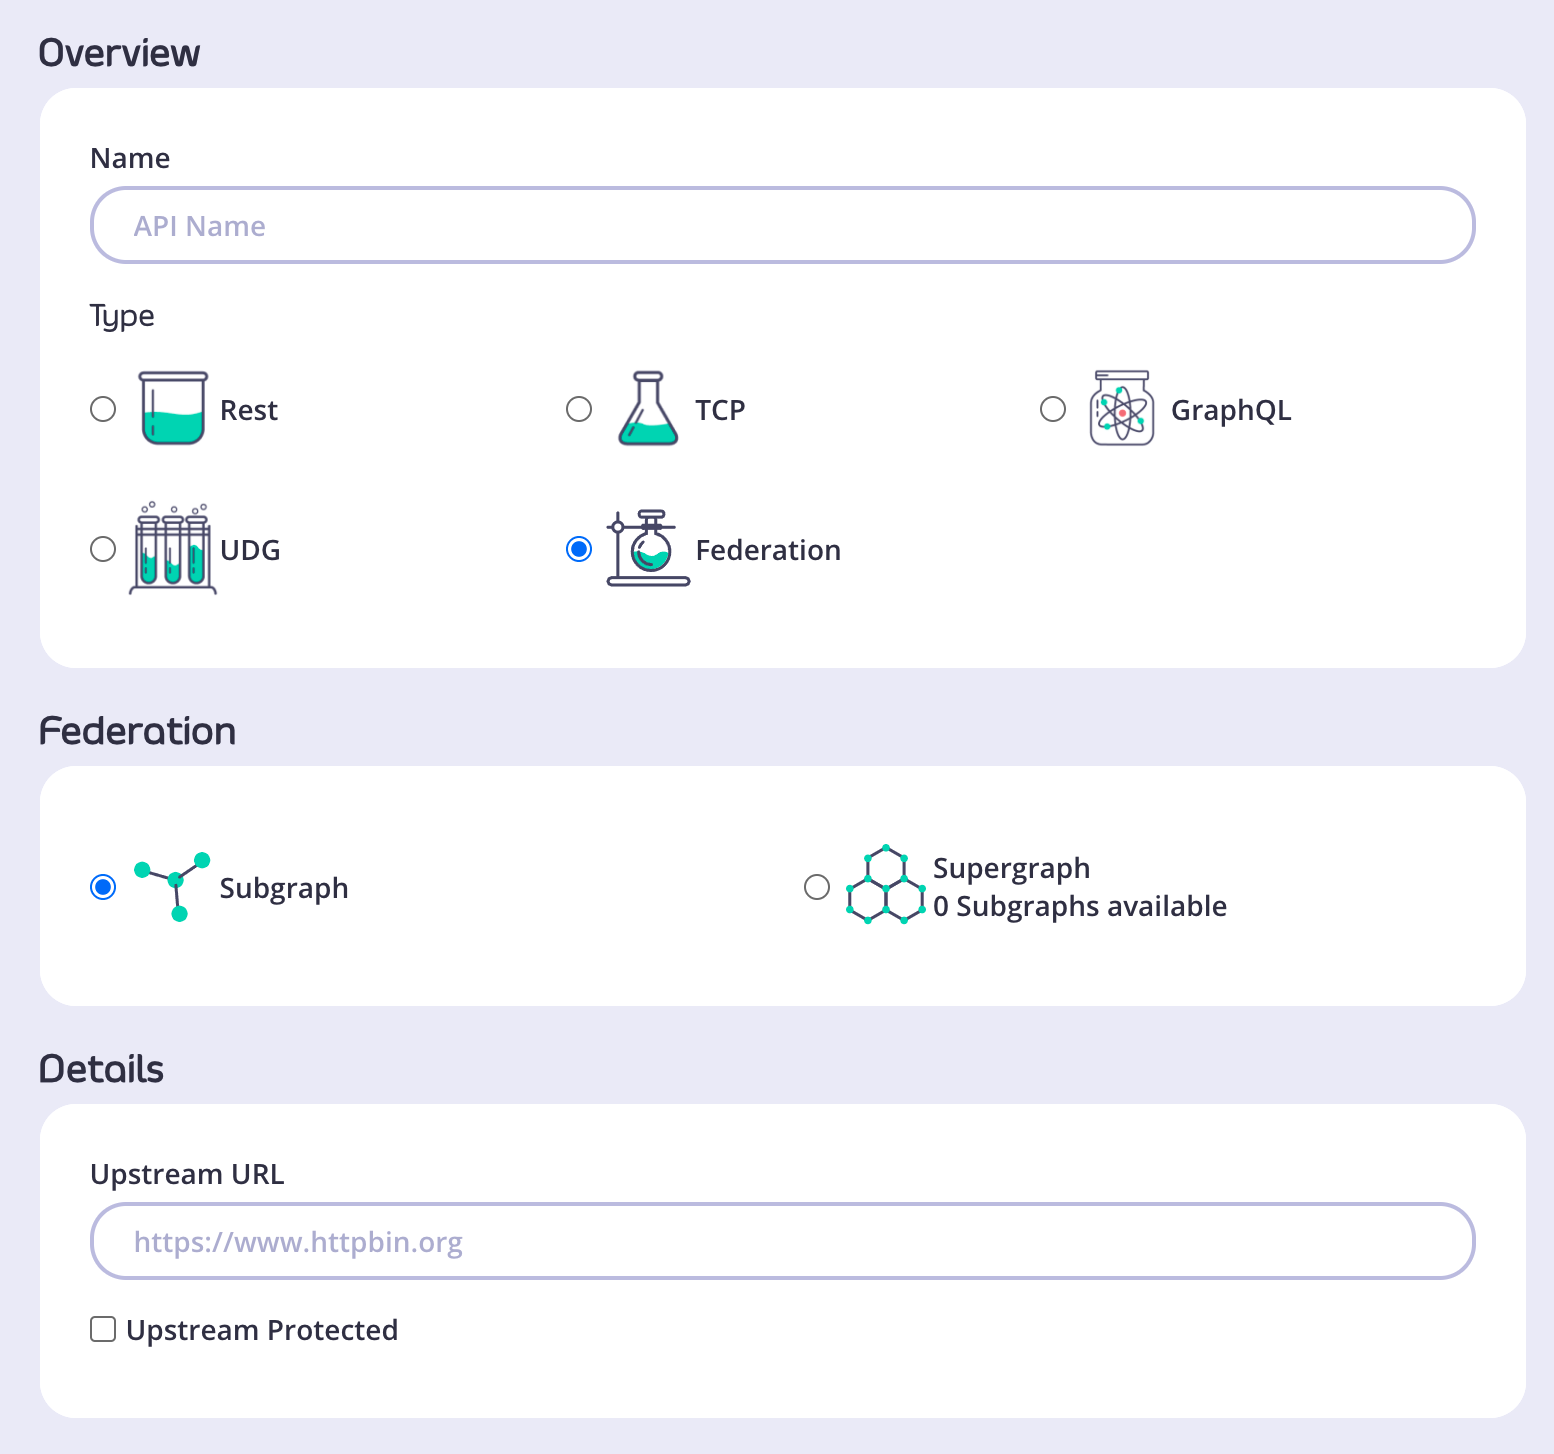
-
Choose a name for the subgraph and provide an upstream URL.
NoteIn case your upstream URL is protected, select Upstream Protected and provide authorization details (either Header or Certificate information).
-
Go to Configure API and configure your subgraph just as you would any other API in Tyk.
NoteIn v4.0, subgraphs will be set to Internal by default.
- Once you have configured all the options, click Save. The subgraph is now visible in the list of APIs.
Creating a supergraph via the Dashboard UI
- Log in to the Dashboard and go to APIs > Add New API > Federation > Supergraph.
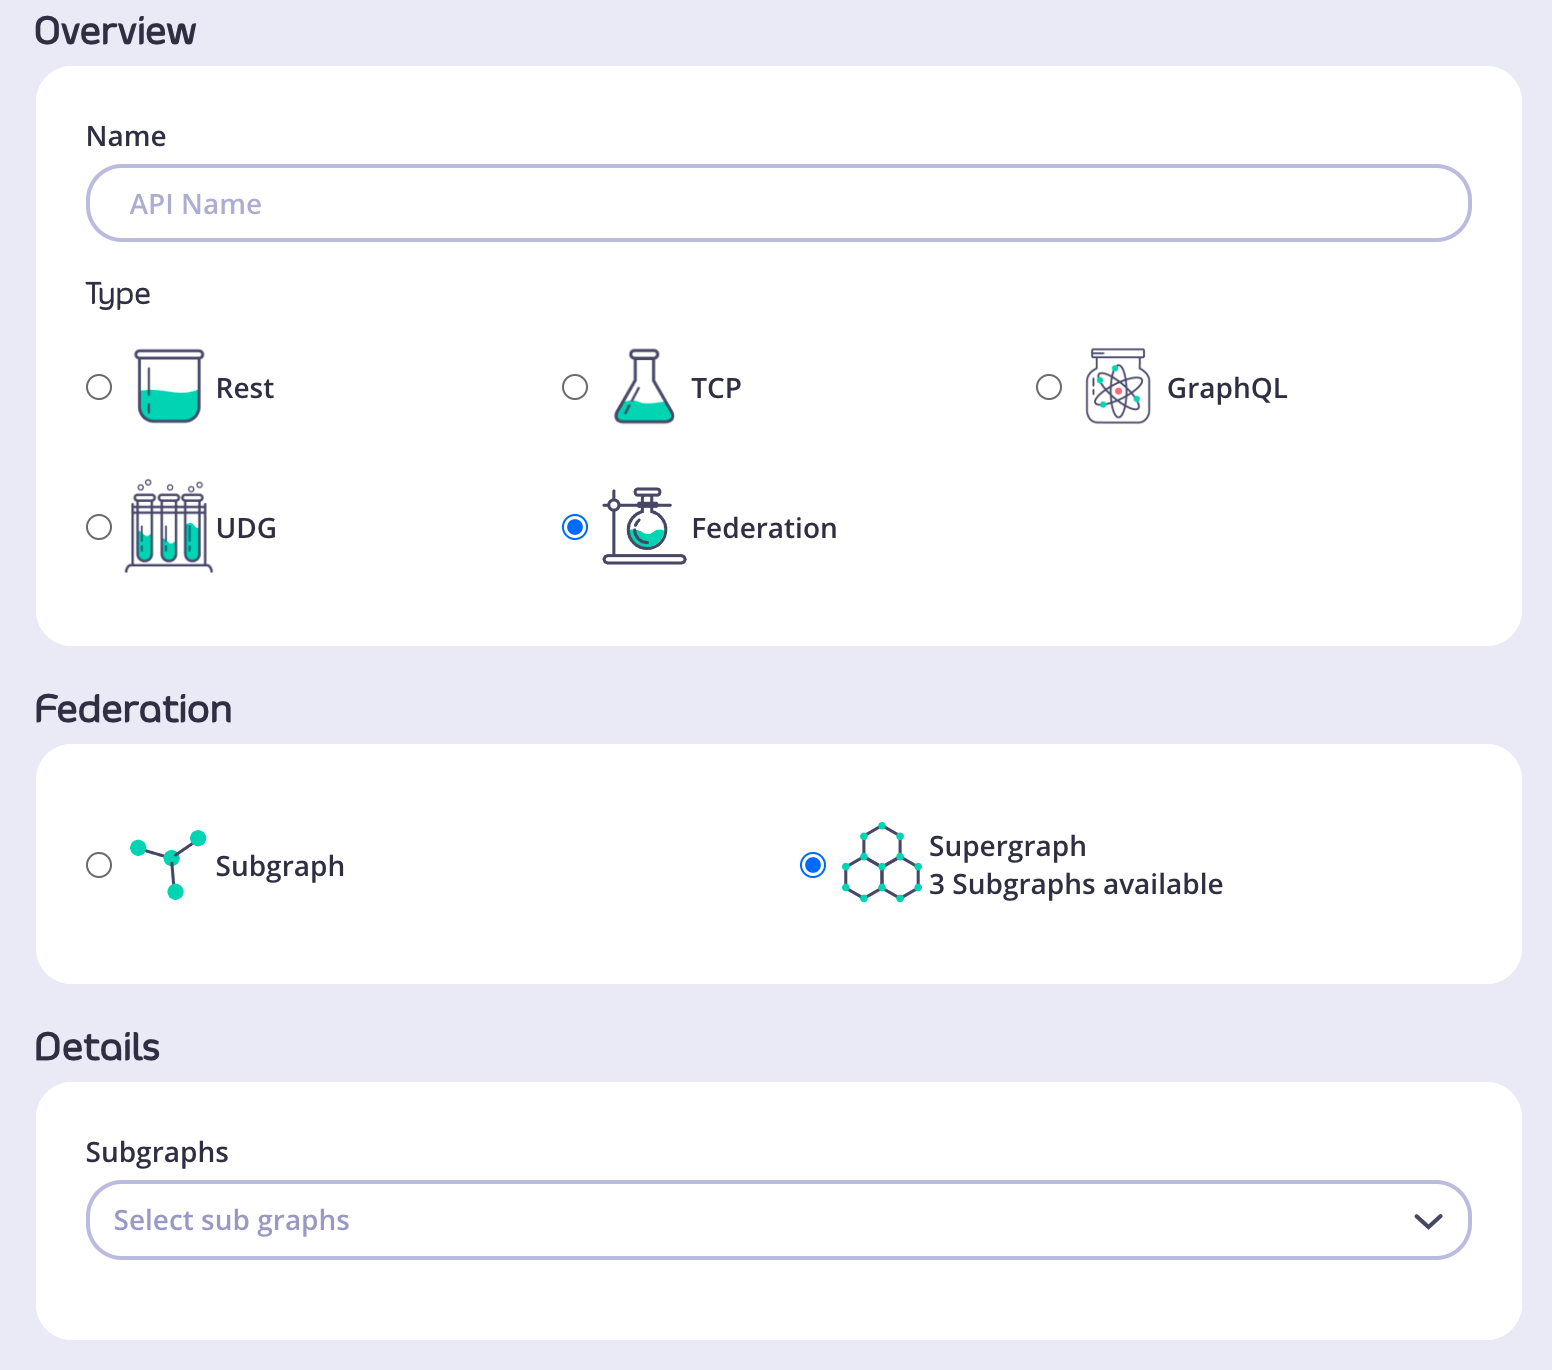
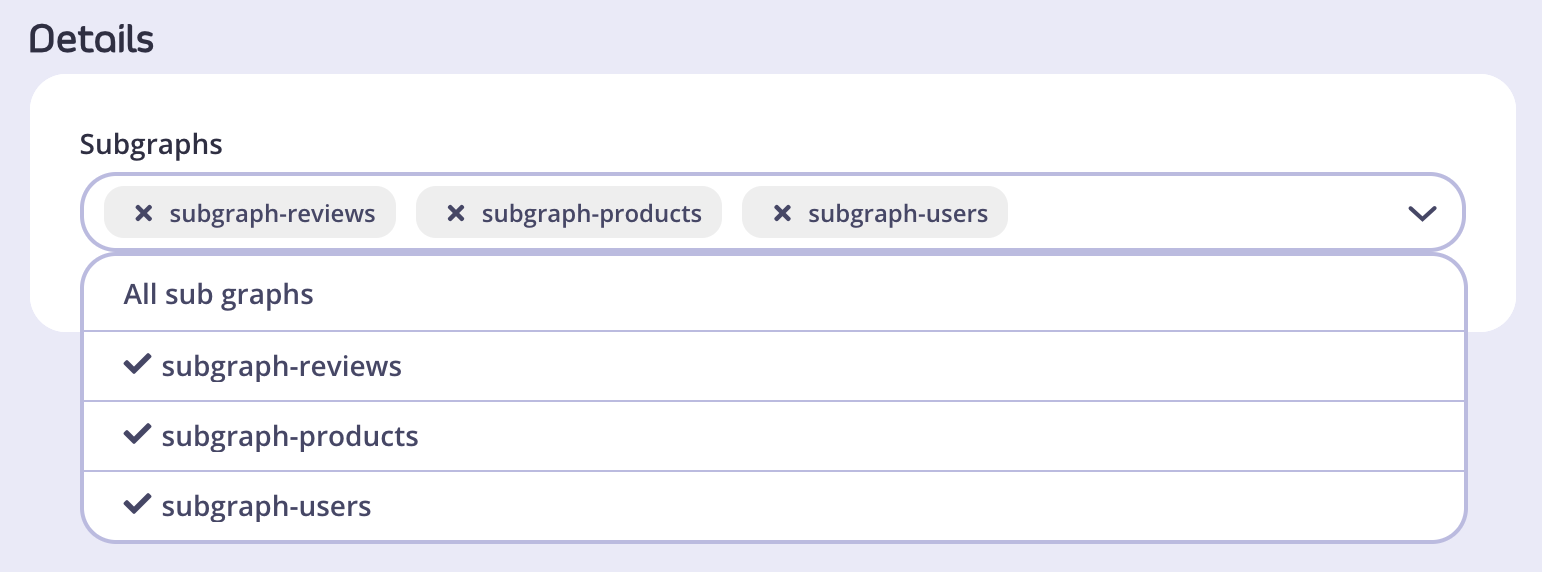
- In the Details section, select all the subgraphs that will be included in your supergraph.
- Go to Configure API and configure your supergraph just as you would any other API in Tyk.
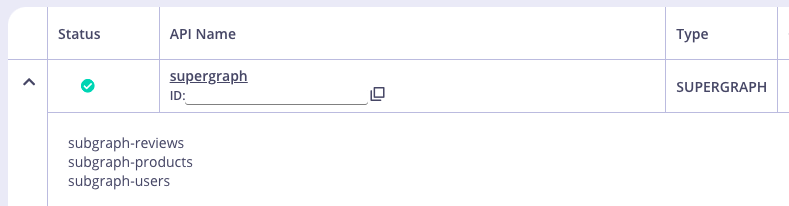
- Once you configure all the options, click Save. The supergraph is now available in your list of APIs.
Defining Headers
In v4.0 you can define global (Supergraph) headers. Global headers are forwarded to all subgraphs that apply to the specific upstream request.Setting a Global Header
- After creating your supergraph, open the API in your Dashboard.
- From the Subgraphs tab, click Global Headers.
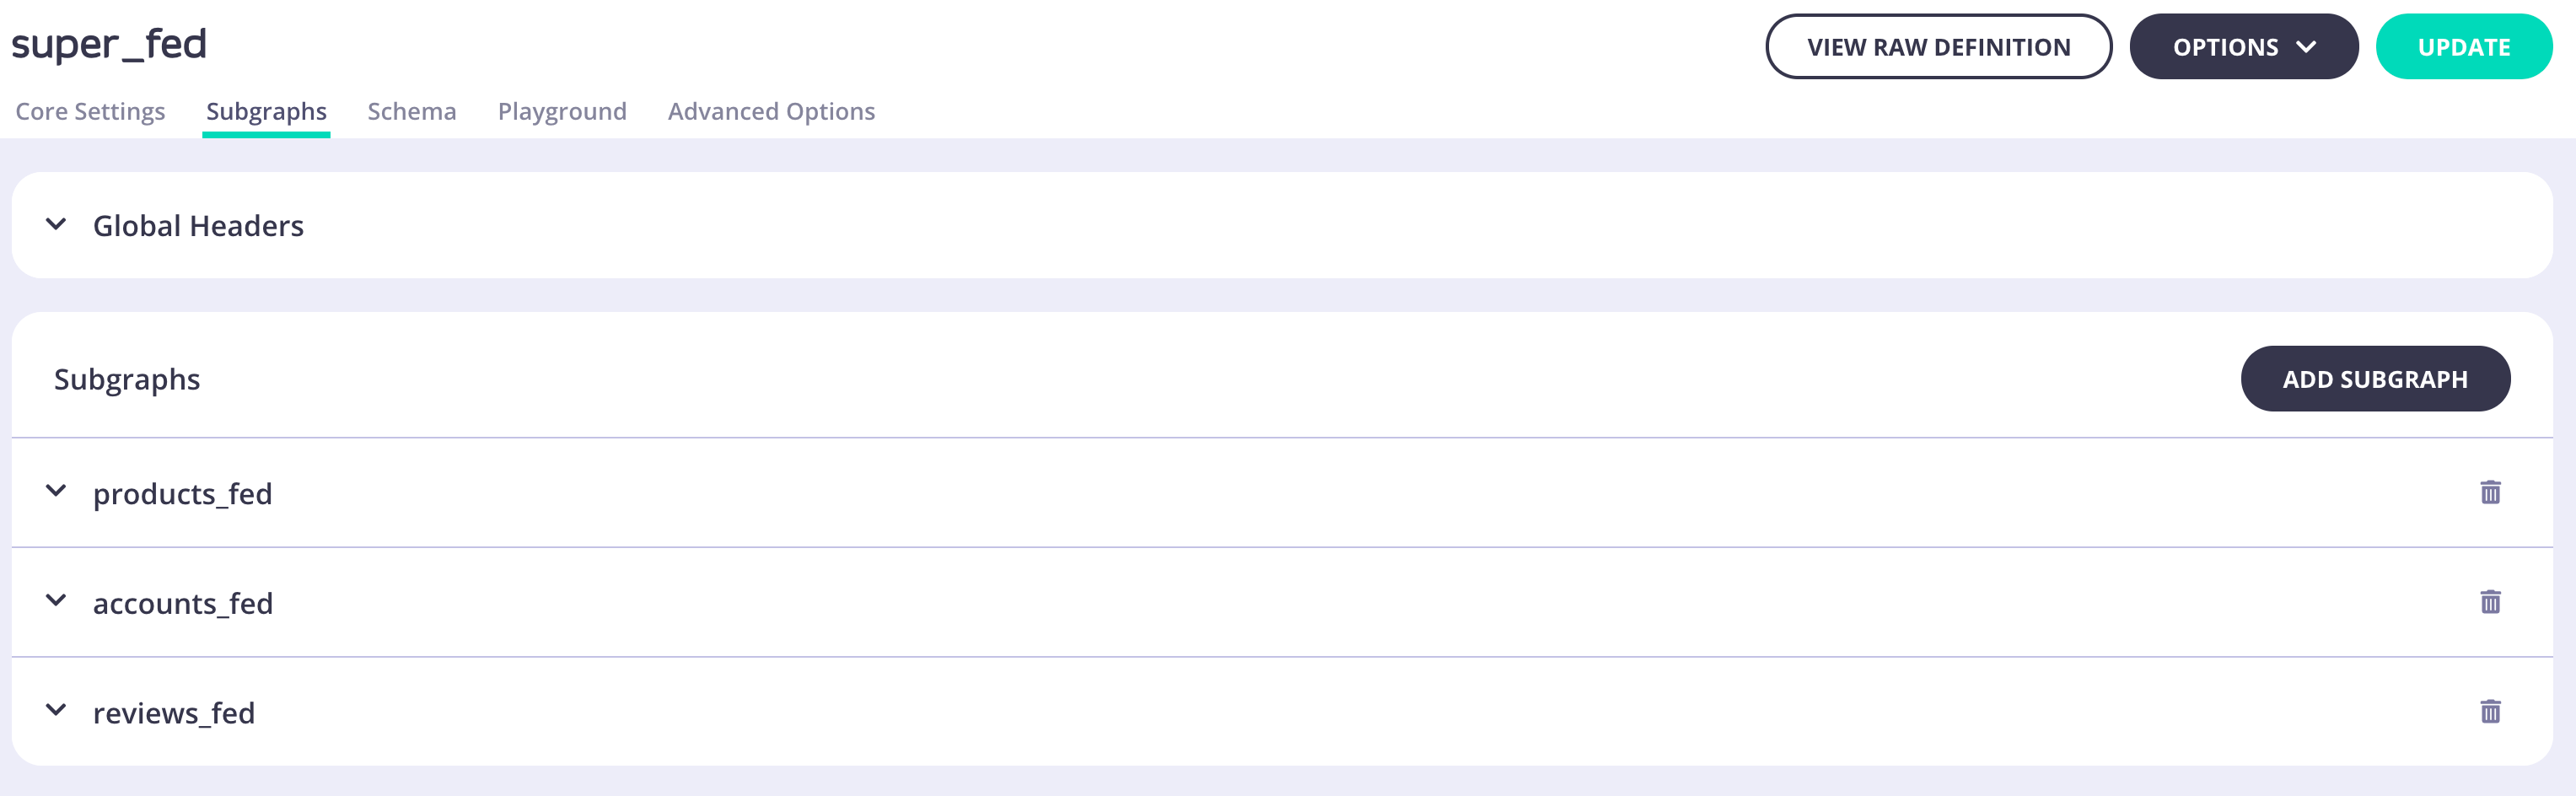
- Enter your header name and value. You can add more headers by clicking Add Headers.
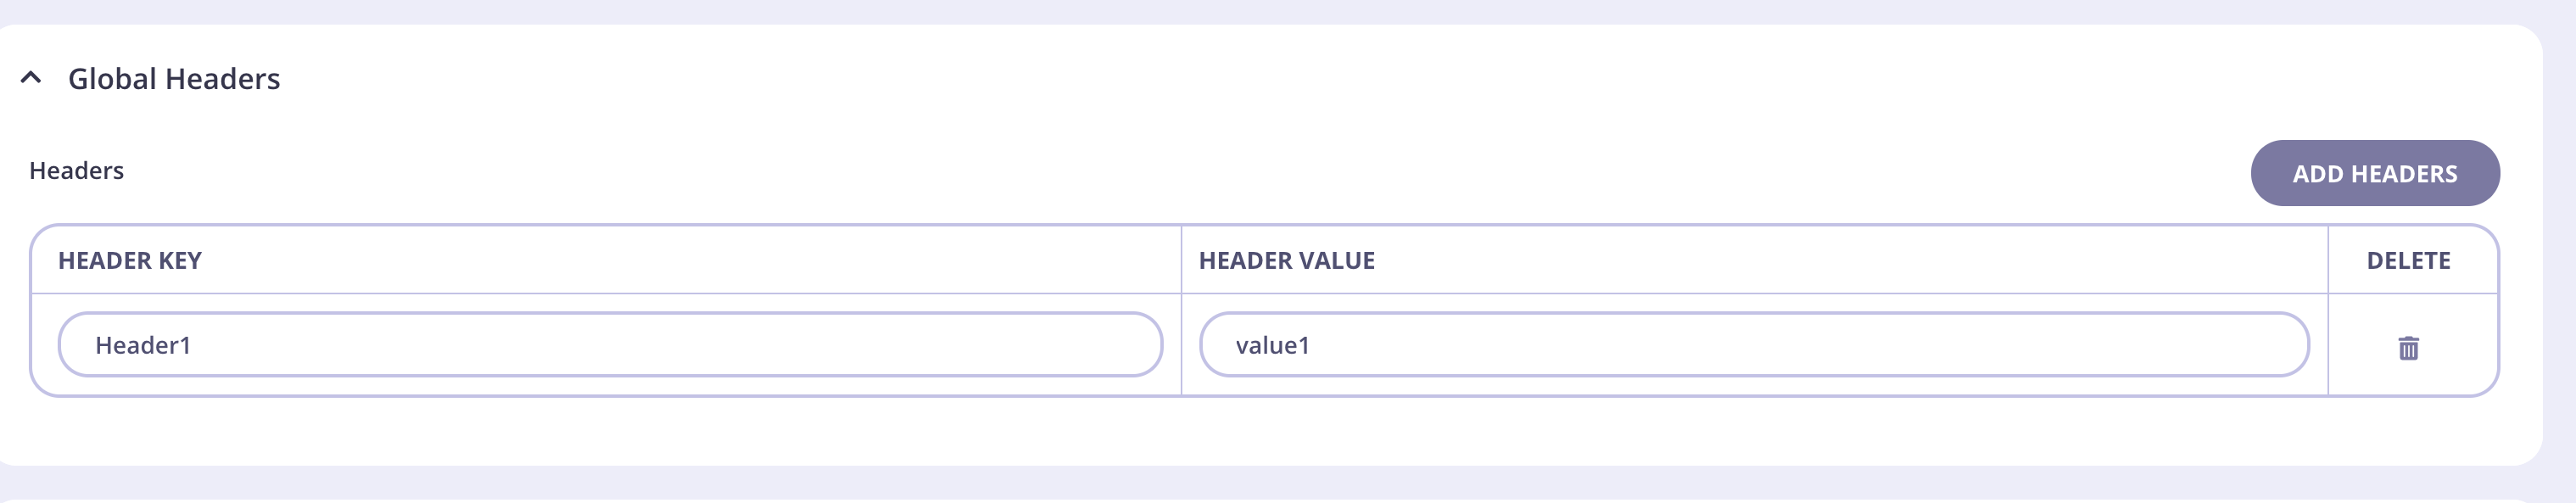
- Click Update to save the header.
- On the pop-up that is displayed, click Update API.
- If you want to delete a global header, click the appropriate bin icon for it.
- You can update your headers by repeating steps 2-5.
Entities
Defining the base entity
- Must be defined with the @key directive.
- The “fields” argument of the @key directive must reference a valid field that can uniquely identify the entity.
- Multiple primary keys are possible.
Extending entities
Entities cannot be shared types (be defined in more than one single subgraph; see Entity stubs below). The base entity remains unaware of fields added through extension; only the extension itself is aware of them. Attempting to extend a non-entity with an extension that includes the @key directive or attempting to extend a base entity with an extension that does not include the @key directive will both result in errors. The primary key reference should be listed as a field with the @external directive. Below is an example extension for MyEntity (which was defined above in Subgraph 1): Subgraph 2 (extension):Entity stubs
If one subgraph references a base entity (an entity defined in another subgraph) without adding new fields, that reference must be declared as a stub. In federation v1, stubs appear similar to extensions but do not add any new fields. An entity stub contains the minimal amount of information necessary to identify the entity (referencing exactly one of the primary keys from the base entity regardless of whether there are multiple primary keys on the base entity). The identifying primary key should feature the @external directive. For example, a stub of MyEntity (which was defined above in Subgraph 1): Subgraph 3 (stub):What is a shared type?
Types that are identical by name and structure and feature in more than one subgraph are shared types.Can I extend a shared type?
Subgraphs are normalized before federation. This means you can extend a type if the resolution of the extension after normalization is exactly identical to the resolution of the type after normalization in other subgraphs. Unless the resolution of the extension in a single subgraph is exactly identical to all other subgraphs, extension is not possible. Here is a valid example where both subgraphs resolve to identical enums after normalization: Subgraph 1:Extension Orphans
What is an extension orphan?
An extension orphan is an unresolved extension of a type after federation has completed. This will cause federation to fail and produce an error.How could an extension orphan occur?
You may extend a type within a subgraph where the base type (the original definition of that type) is in another subgraph. This means that it is only after the creation of the supergraph that it can be determined whether the extension was valid. If the extension was invalid or was otherwise unresolved, an “extension orphan” would remain in the supergraph. For example, the type named Person does not need to be defined in Subgraph 1, but it must be defined in exactly one subgraph (see Shared Types: extension of shared types is not possible, so extending a type that is defined in multiple subgraphs will produce an error). Subgraph 1GraphQL WebSockets
Tyk supports GraphQL via WebSockets using the protocols graphql-transport-ws or graphql-ws between client and Tyk Gateway. Before this feature can be used, WebSockets need to be enabled in the Tyk Gateway configuration. To enable it set http_server_options.enable_websockets totrue in your tyk.conf file.
- graphql-transport-ws
- graphql-ws
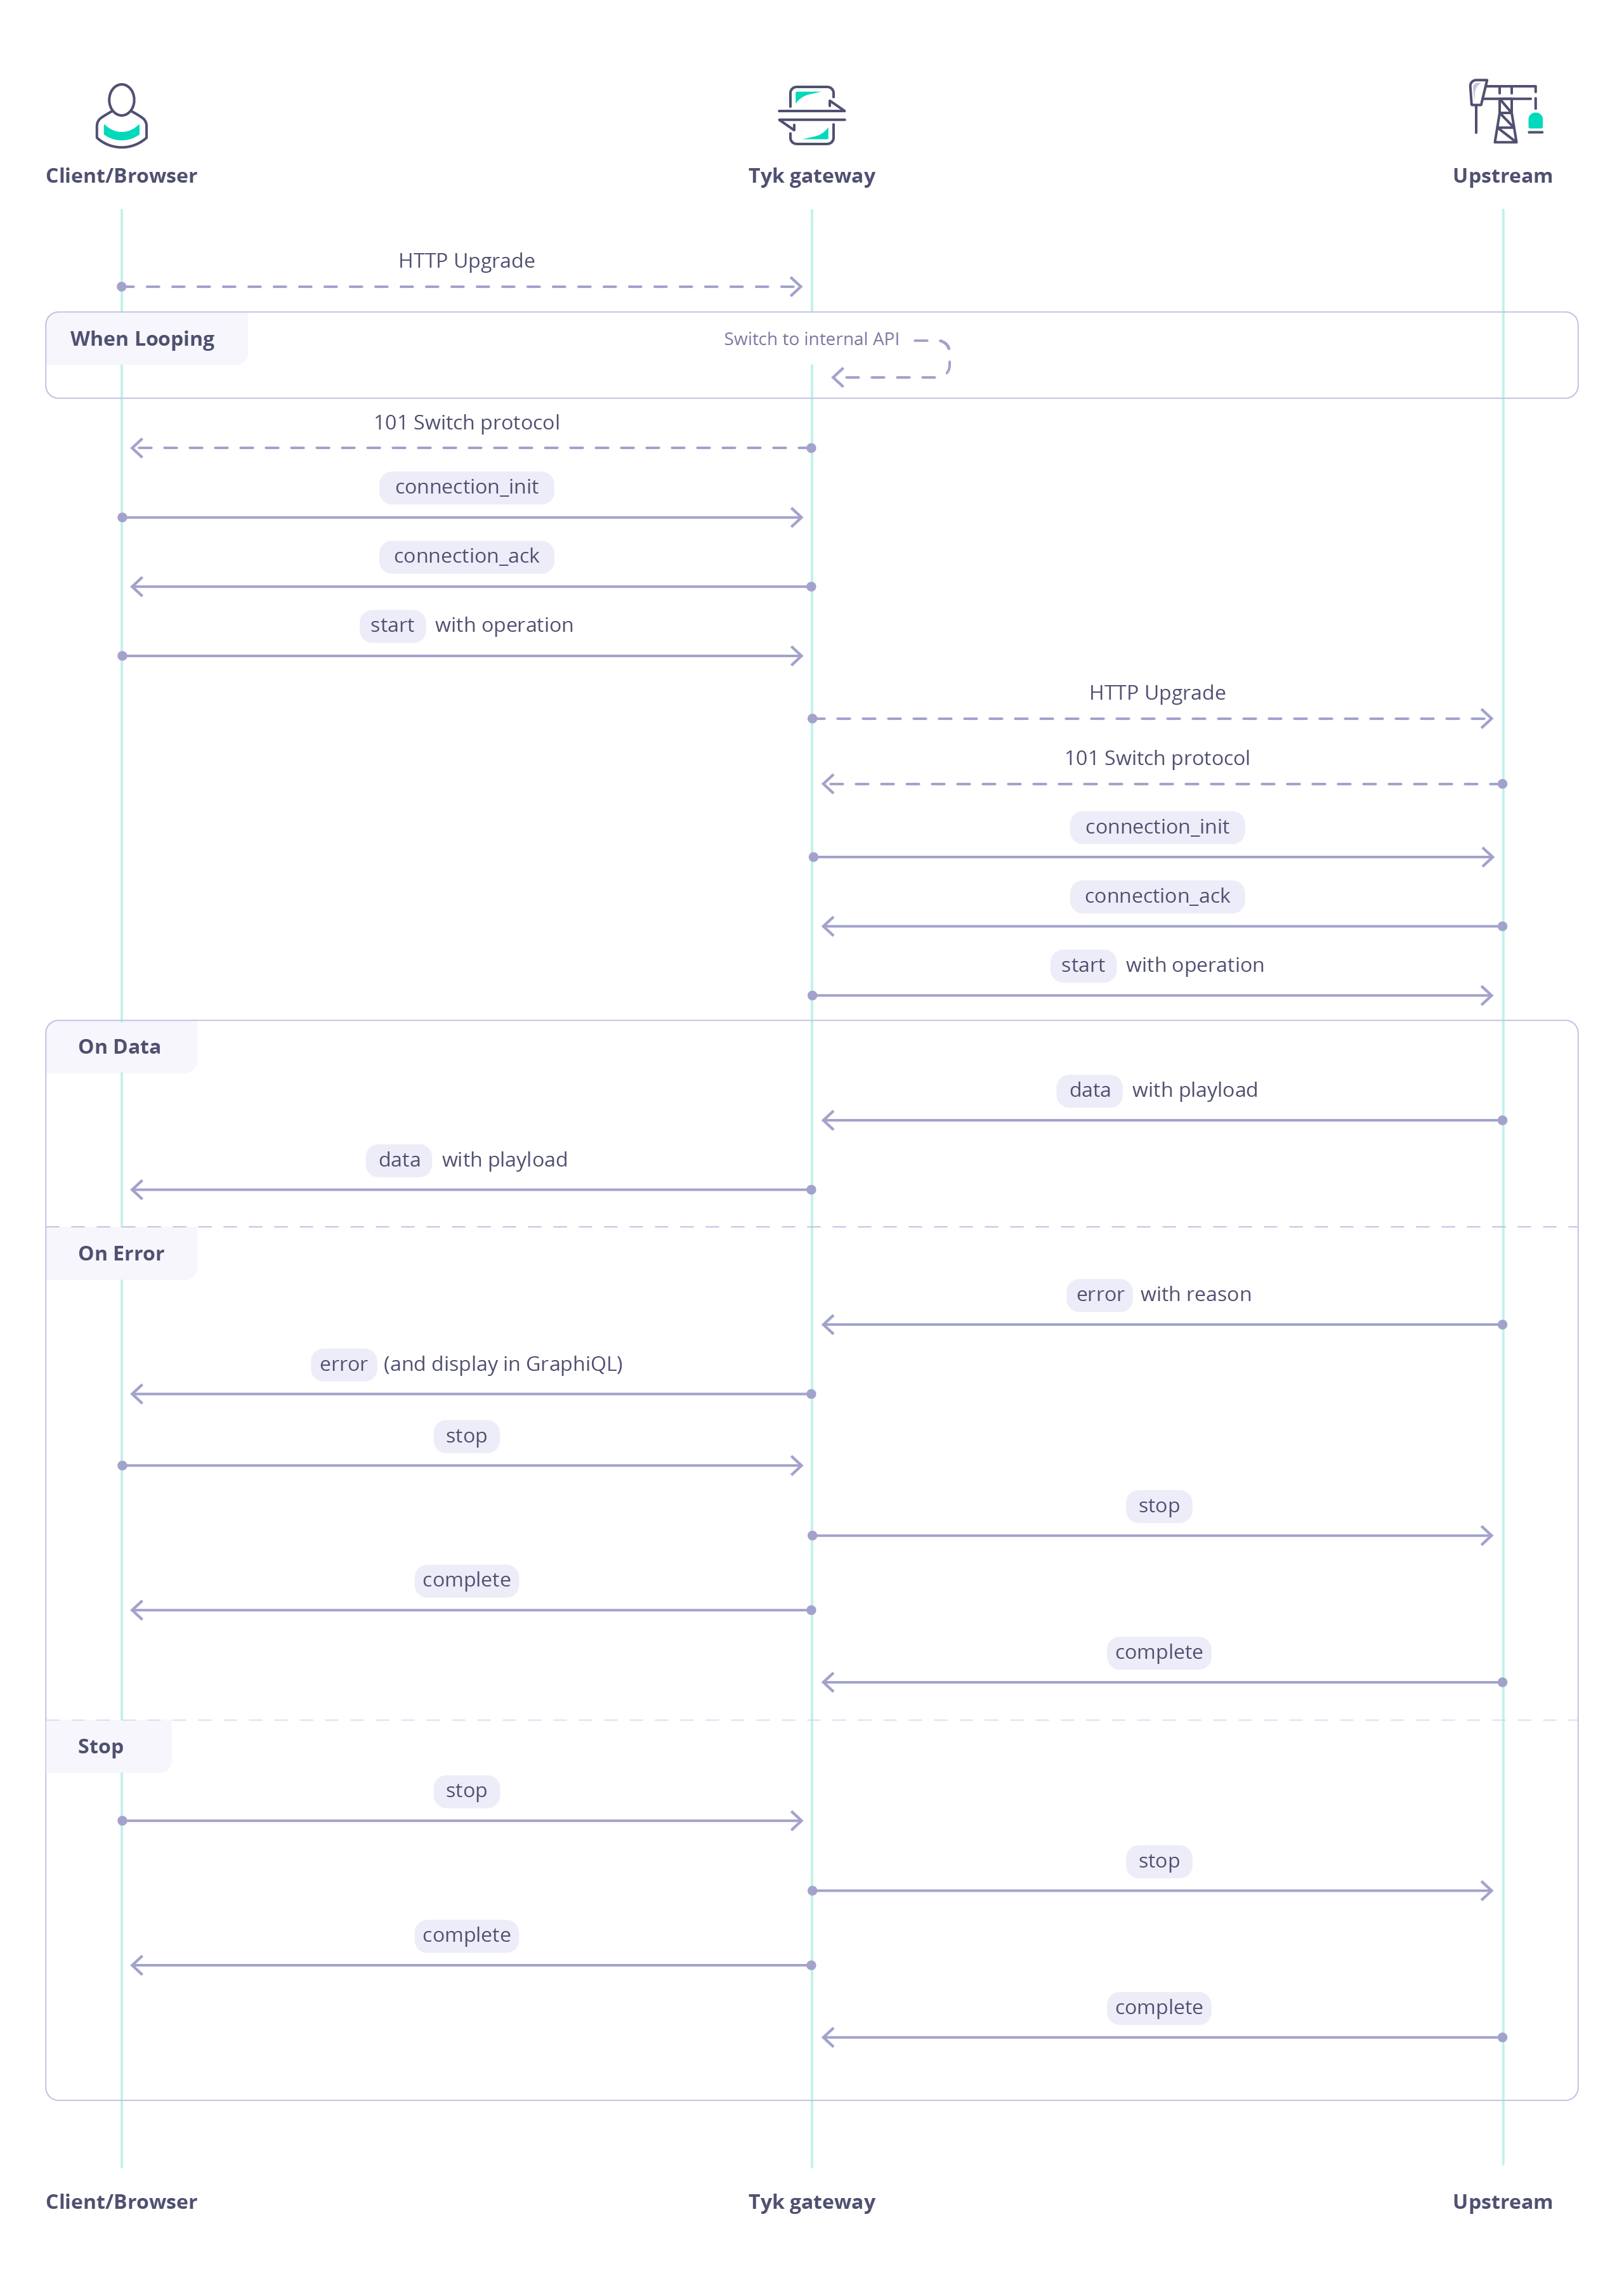
You can find the full documentation of the graphql-transport-ws protocol itself here.In order to upgrade the HTTP connection for a GraphQL API to WebSockets by using the graphql-transport-ws protocol, the request should contain following headers:MessagesThe connection needs to be initialised before sending Queries, Mutations, or Subscriptions via WebSockets:Always send unique IDs for different Queries, Mutations, or Subscriptions.For Queries and Mutations, the Tyk Gateway will respond with a For Subscriptions, the Tyk Gateway will respond with a stream of ExamplesSending queriesSending mutationsStarting and stopping Subscriptions
complete message, including the GraphQL response inside the payload.next messages containing the GraphQL response inside the payload until the data stream ends with a complete message. It can happen infinitely if desired.Be aware of those behaviors:
- If no
connection_initmessage is sent after 15 seconds after opening, then the connection will be closed. - If a duplicated ID is used, the connection will be closed.
- If an invalid message type is sent, the connection will be closed.
Upstream connections
For setting up upstream connections (between Tyk Gateway and Upstream) please refer to the GraphQL Subscriptions Key Concept.GraphQL Subscriptions
Tyk natively supports also GraphQL subscriptions, so you can expose your full range of GQL operations using Tyk Gateway. Subscriptions support was added inv4.0.0 in which graphql-ws protocol support was introduced.
With the release of Tyk v4.3.0 the number of supported subscription protocols has been extended.
In Tyk subscriptions are using the WebSocket transport for connections between the client and Gateway. For connections between Gateway and upstream WebSockets or SSE can be used.
Supported transports and protocols
| Transport | Protocol |
|---|---|
| WebSockets | graphql-ws (default, no longer maintained) |
| WebSockets | graphql-transport-ws |
| HTTP | Server-Sent Events (SSE) |
Setting up subscription types via API definition
Subscription types or subscription transports/protocols are set inside the graphql section of the API definition. Depending on whether you want to configure GraphQL proxy-only, UDG, or GraphQL Federation there are different places for the configuration option. The values for subscription types are the same on all API types:graphql-wsgraphql-transport-wssse(Server-Sent Events)
HTTP method for Server-Sent Event subscription
When usingsubscription_type=sse, Tyk will use the HTTP GET method to subscribe to the upstream service. For some use cases, for example, to support larger subscription payloads or to increase security by keeping the subscription payload out of server logs, the upstream requires HTTP POST. In Tyk 5.9.0, we have added POST support for SSE with the introduction of the boolean use_sse_post option, which is only relevant if subscription_type=sse.
GET then you can omit sse_use_post or set it to false.
GraphQL Proxy
Universal Data Graph
In UDG, the
subscription_type setting only applies to data sources of kind GraphQL. It is not supported for REST kind data sources. REST data sources can only resolve Query and Mutation operations. If your upstream exposes subscriptions via SSE, you must configure it as a GraphQL data source.GraphQL and the subscription_type is set to sse:
kindmust be"GraphQL"— SSE subscriptions are not available for REST data sources.root_fieldsmaps theSubscriptiontype and its fields to this data source.subscription_typeis set to"sse"to use Server-Sent Events for the upstream connection.- Use
"graphql-ws"or"graphql-transport-ws"instead of"sse"if your upstream uses WebSockets.
Federation
If the upstream subscription GraphQL API is protected please enable the authentication via query params to pass the header through.
GraphQL playground
When you are creating or editing your GraphQL API, any change you make can be tested using Tyk Dashboard built-in GraphiQL Playground.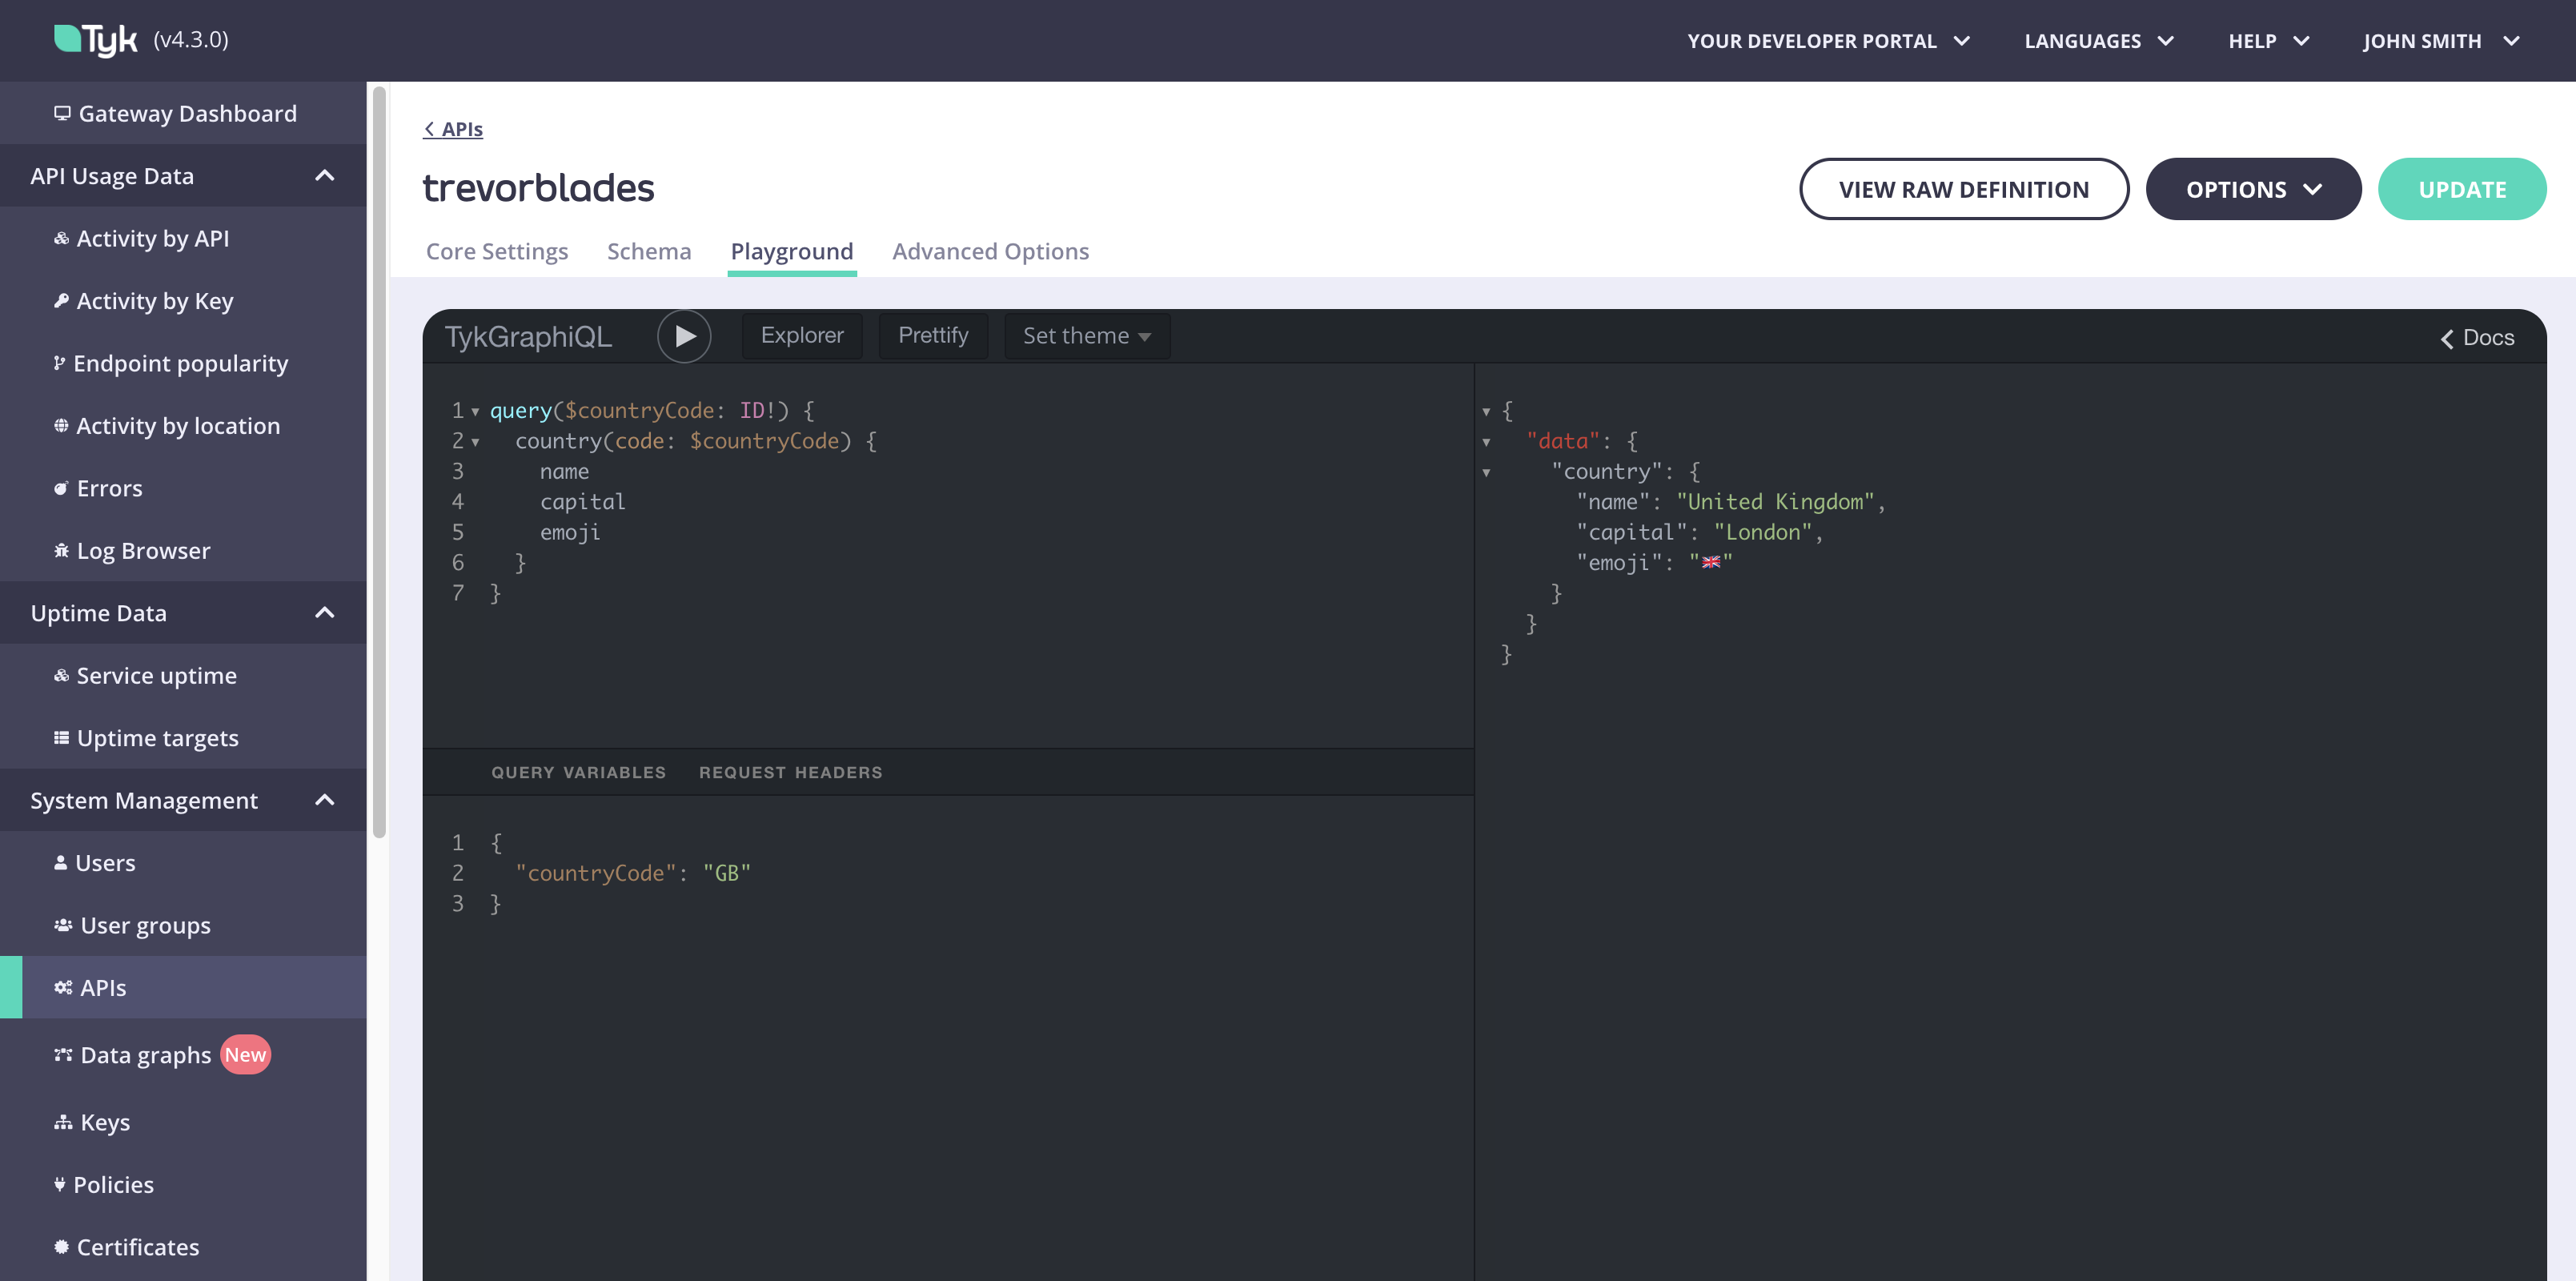
Set theme dropdown.
There’s also a built in Explorer to help with query building and a Prettify button that helps to make the typed out operation easier to read.
The GraphiQL try-out playground comes with a series of features by default, which can be very useful while configuring the API:
- Syntax highlighting.
- Intelligent type ahead of fields, arguments, types, and more.
- Real-time error highlighting and reporting for queries and variables.
- Automatic query and variables completion.
- Automatically adds required fields to queries.
- Documentation explorer, search, with markdown support.
- Query History using local storage
- Run and inspect query results using any promise that resolves JSON results. 9. HTTPS or WSS not required.
- Supports full GraphQL Language Specification: Queries, Mutations, Subscriptions, Fragments, Unions, directives, multiple operations per query, etc
GraphQL Playgrounds in Tyk
Tyk offers you two types of Playgrounds, depending on who should be authorized to use them.-
Playground tab in
API Designer, that’s only accessible via Tyk Dashboard and is always enabled. You need to log into the Tyk Dashboard to be able to use it. -
Public Playground that you can enable for any GraphQL API and that is accessible for any consumer interacting with your GQL API. This playground will follow all security rules you set for your GQL API - authentication, authorization, etc.
The Public Playground relies on assets in the
playgroundfolder under template_path (default:/opt/tyk-gateway/templates). If you change this path, be sure to copy theplaygroundfolder to the new location to preserve functionality.
Enabling Public GraphQL Playground
- Tyk Dashboard
- Tyk API definition
To enable a Public GraphQL Playground for one of your GQL APIs follow these few simple steps: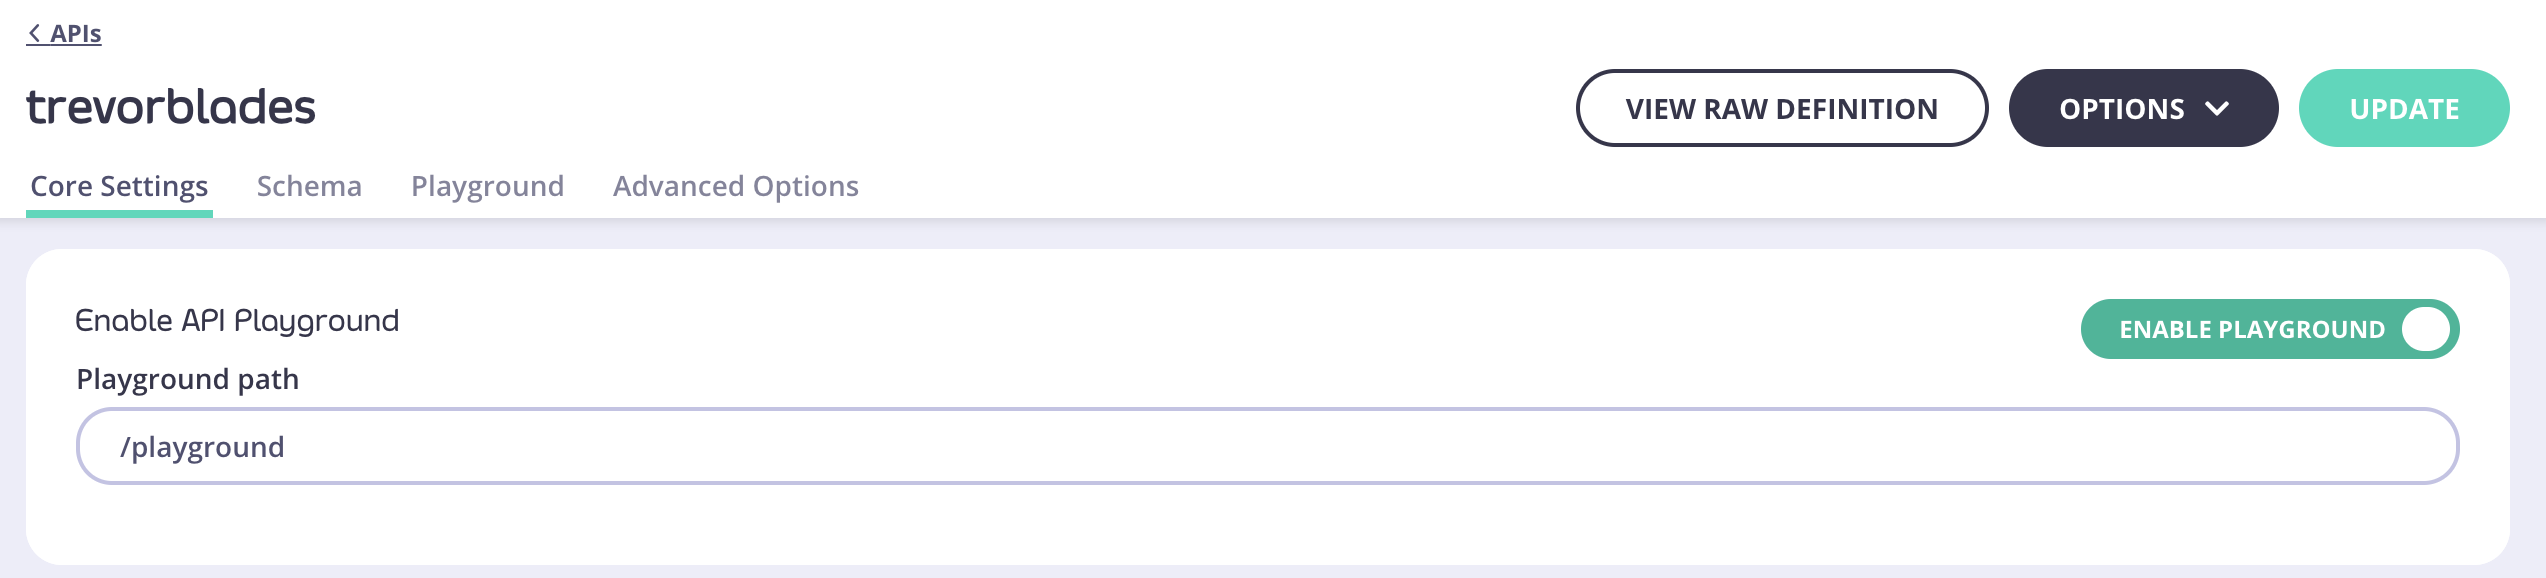
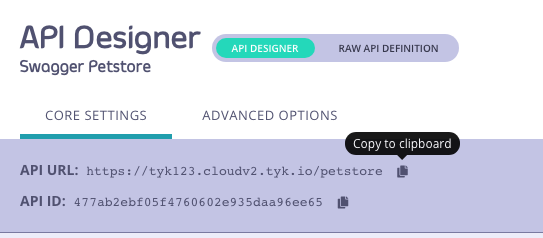
- Navigate to
Core Settingstab inAPI designer - Change the setting in
Enable API Playgroundsection. - Provide
Playground path. By default, this path is set to/playgroundbut you can change it.
Public Playground will be available at http://{API-URL}/playground.Query variables
You can pass query variables in two different ways, both are fully supported in Tyk Dashboard.Using inline arguments in GraphiQL Playground
A query or mutation string in this case, would be written like in the example below and there would be no other requirements for executing an operation like this:Using query variables in GraphiQL Playground
For complex sets of variables, you might want to split the above example into two parts: GQL operation and variables. The operation itself would change to:Query variables section of the Playground like this:
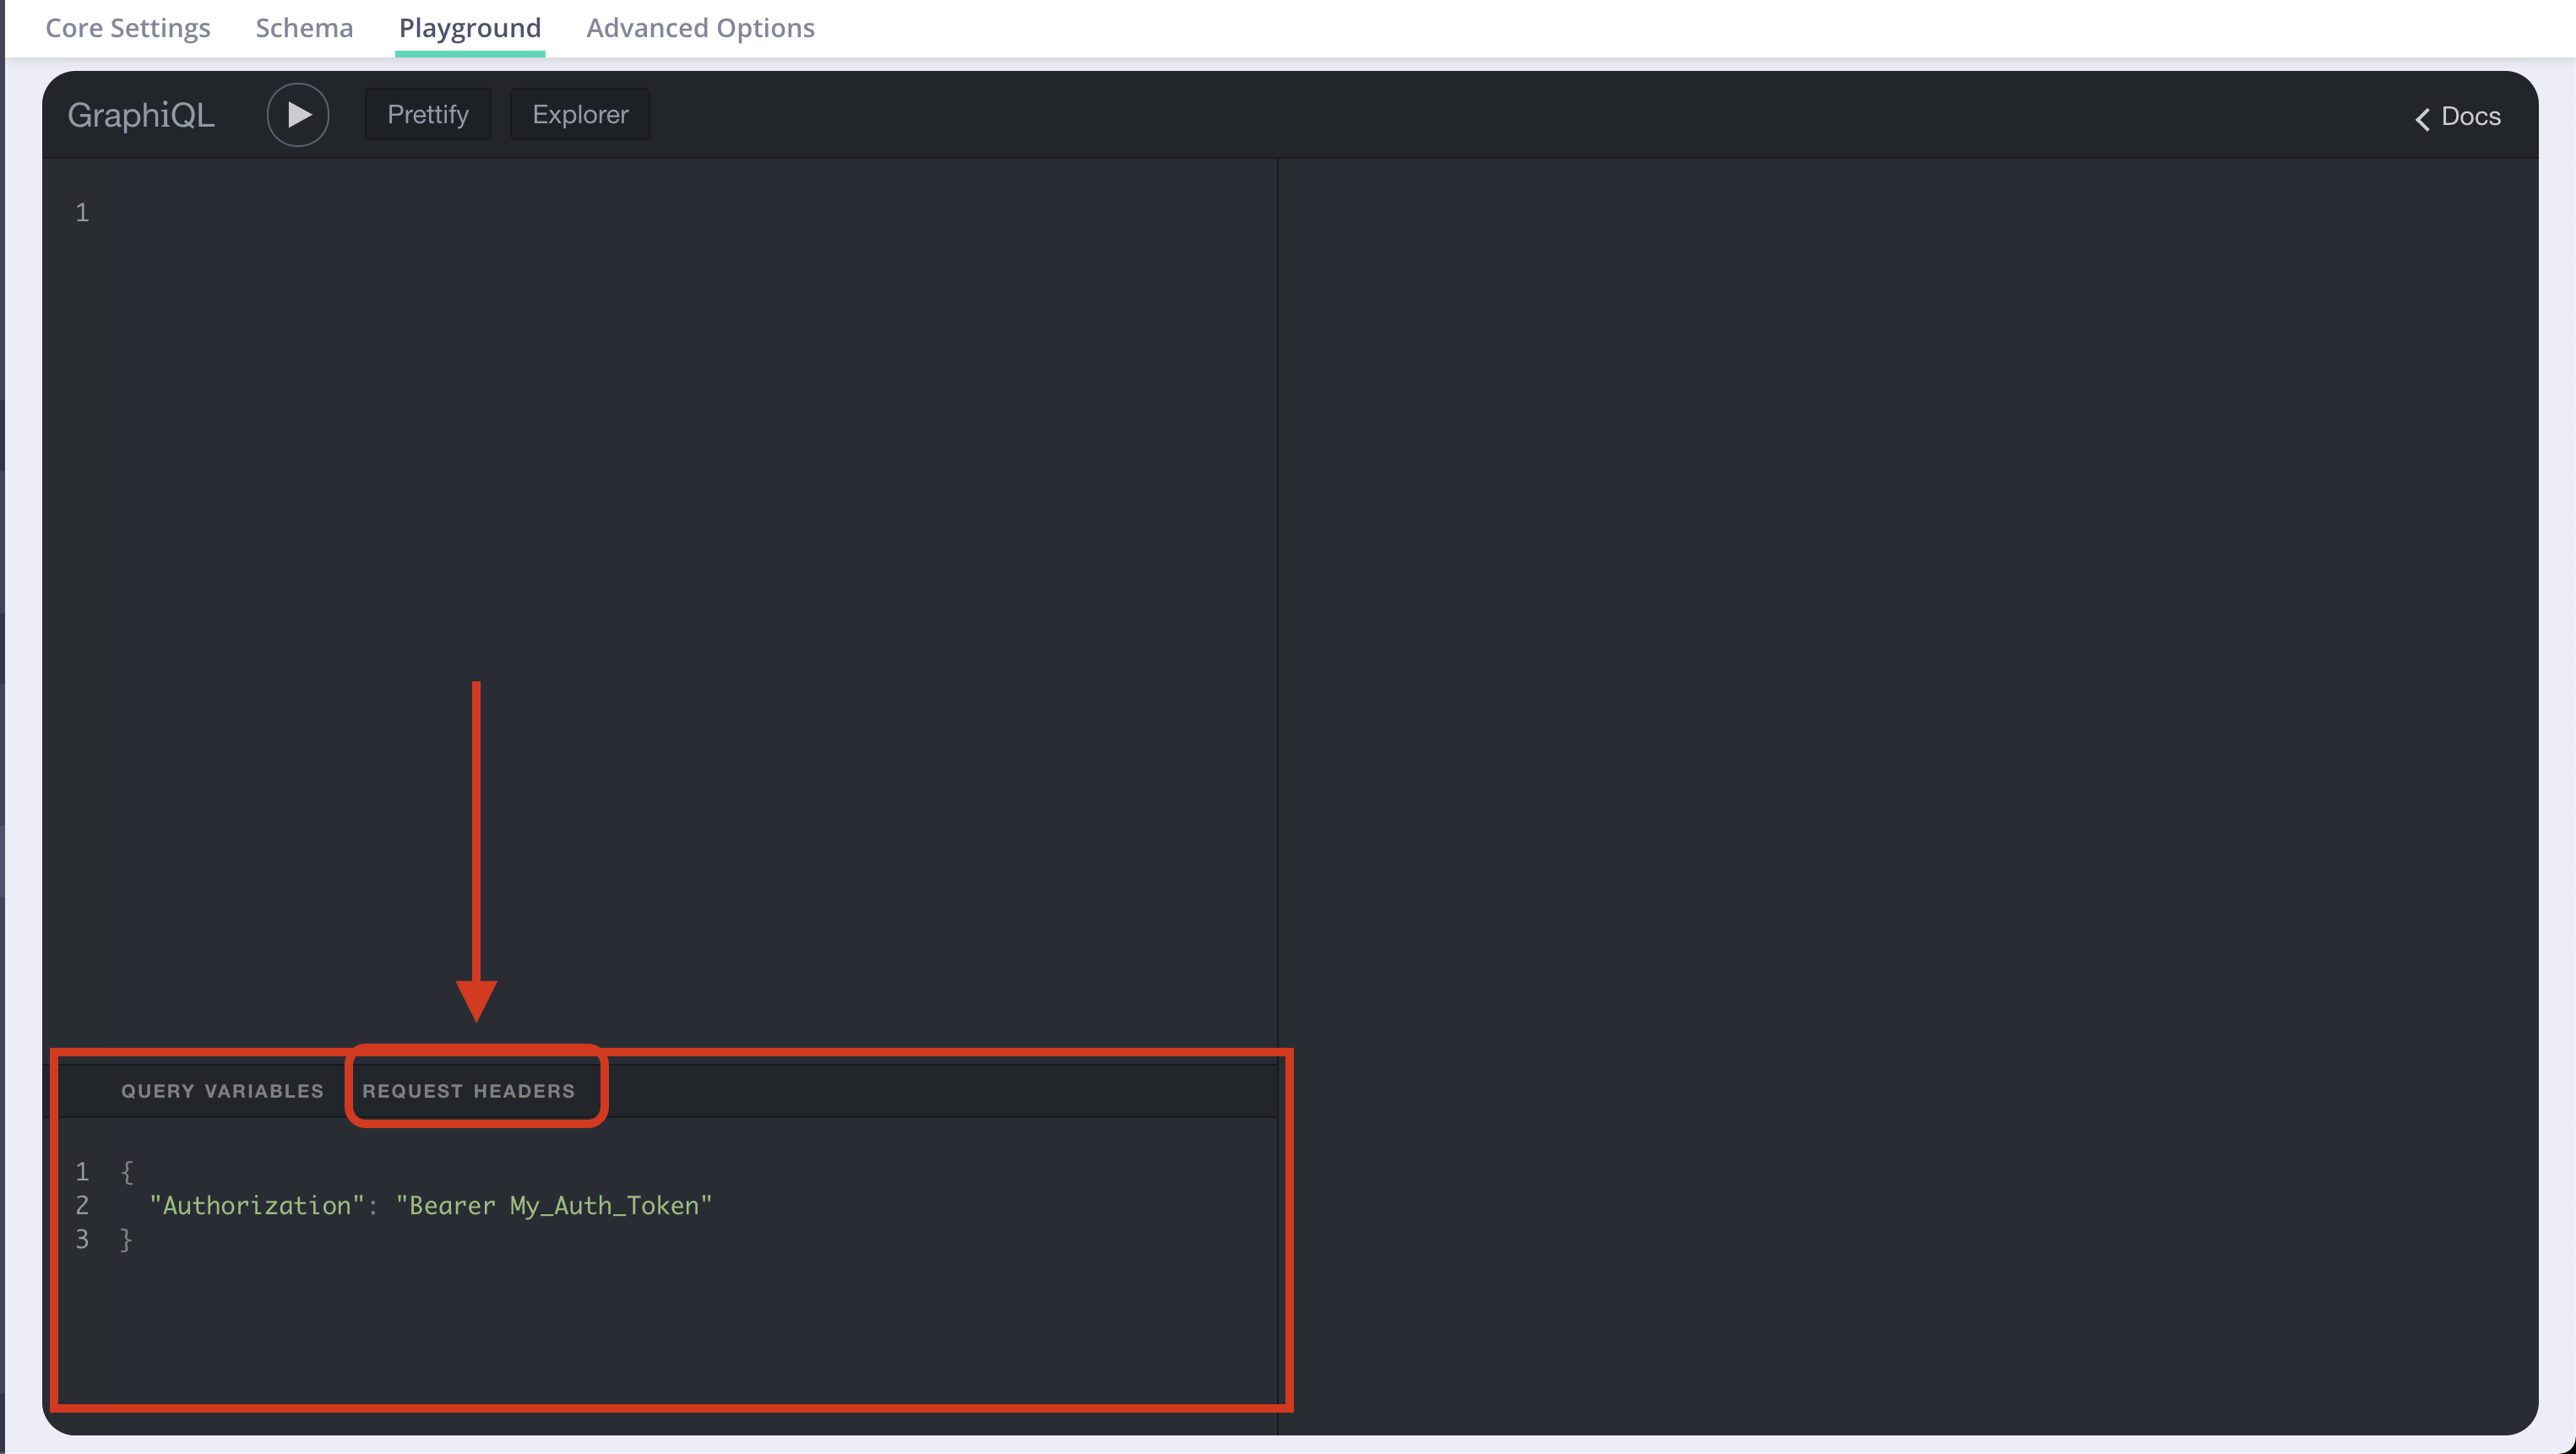
Headers
Debugging a GraphQL API might require additional headers to be passed to the requests while playing with the GraphiQL interface (i.e.Authorization header in case of Authentication Token protection over the API). This can be done using the dedicated headers tab in the Graphiql IDE.
Logs
GraphQL request logs described below are only available in Tyk Dashboard.
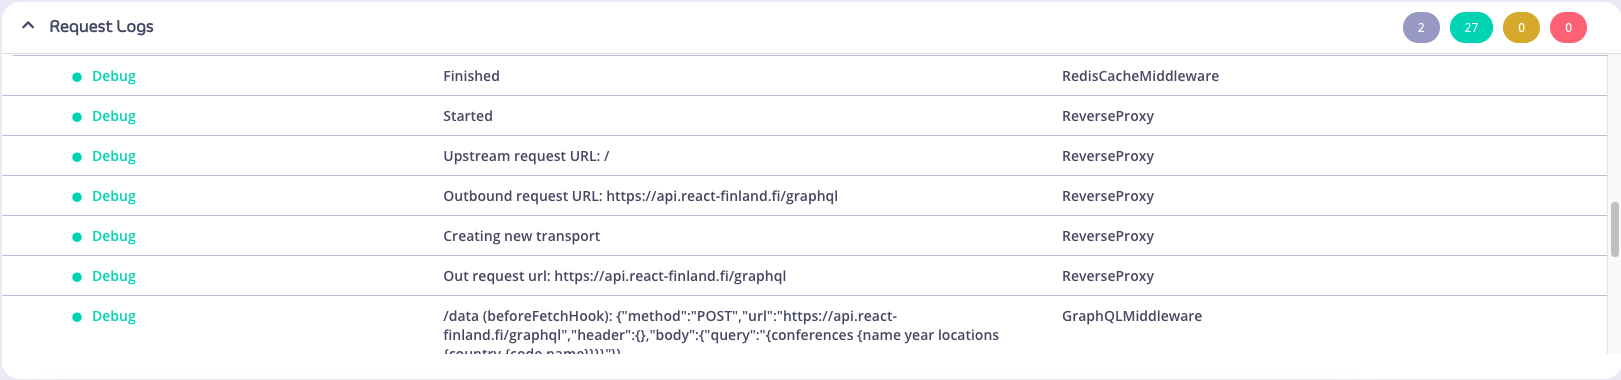

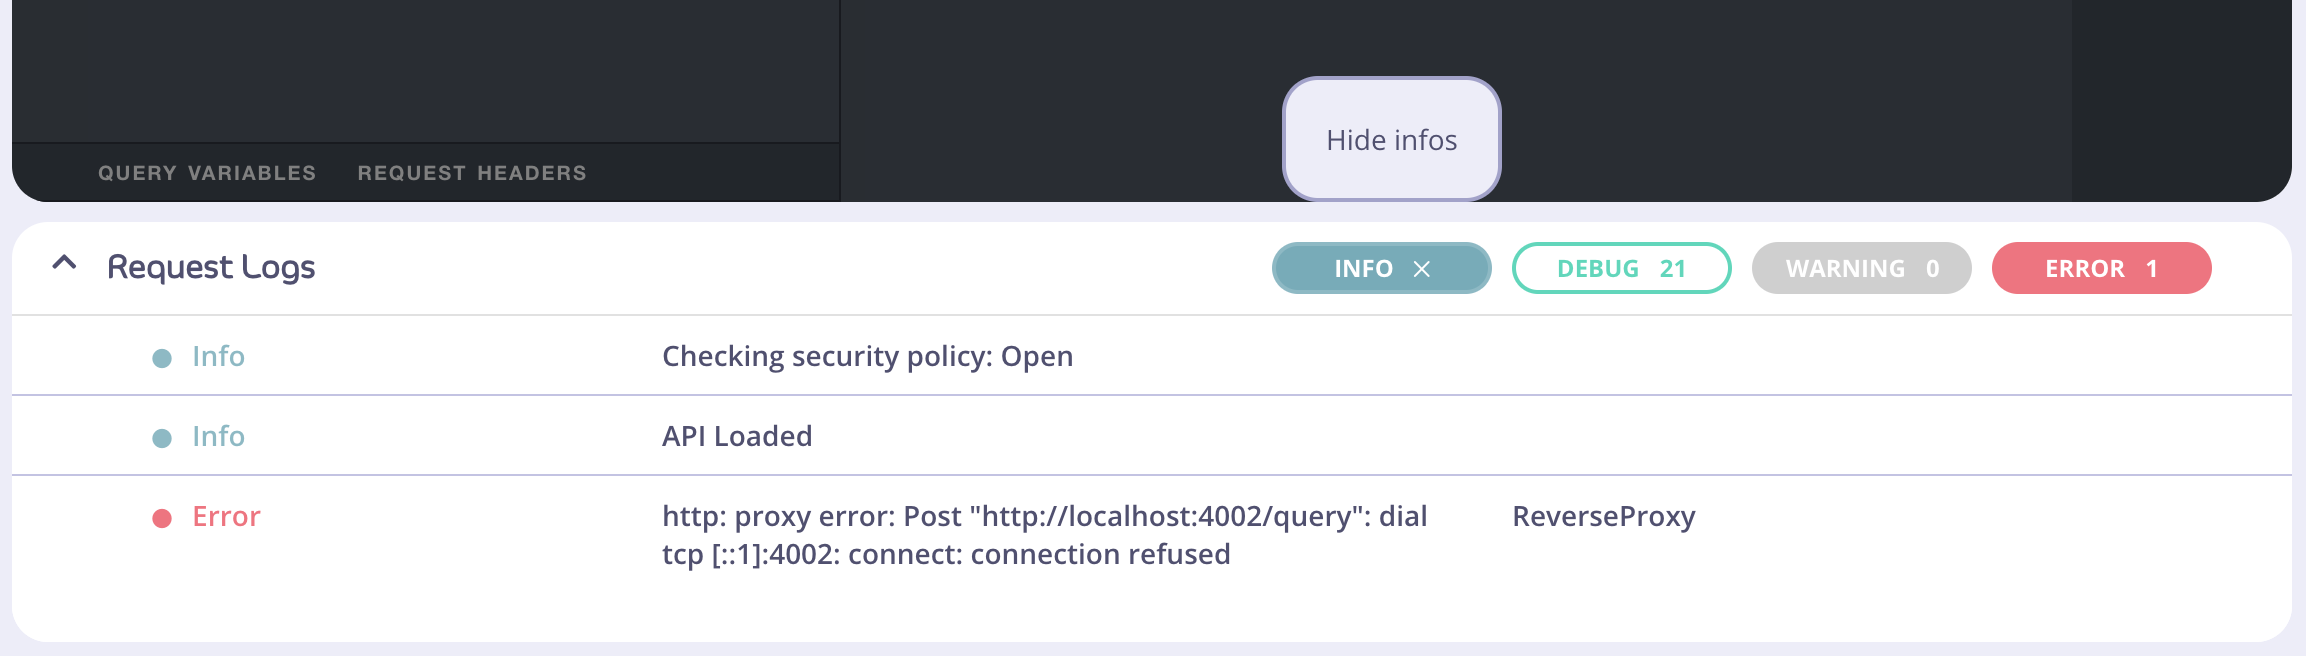
Contents of the logs
There are four levels (categories) of logs:Info, Debug, Warning, and Error, and each log belongs to one of these levels.
The first column of the table displays the color-coded “level” property of the log. A log should never be absent of a level. The second column displays the log “msg” (message) property, if any. The third column displays the “mw” (middleware) property, if any.
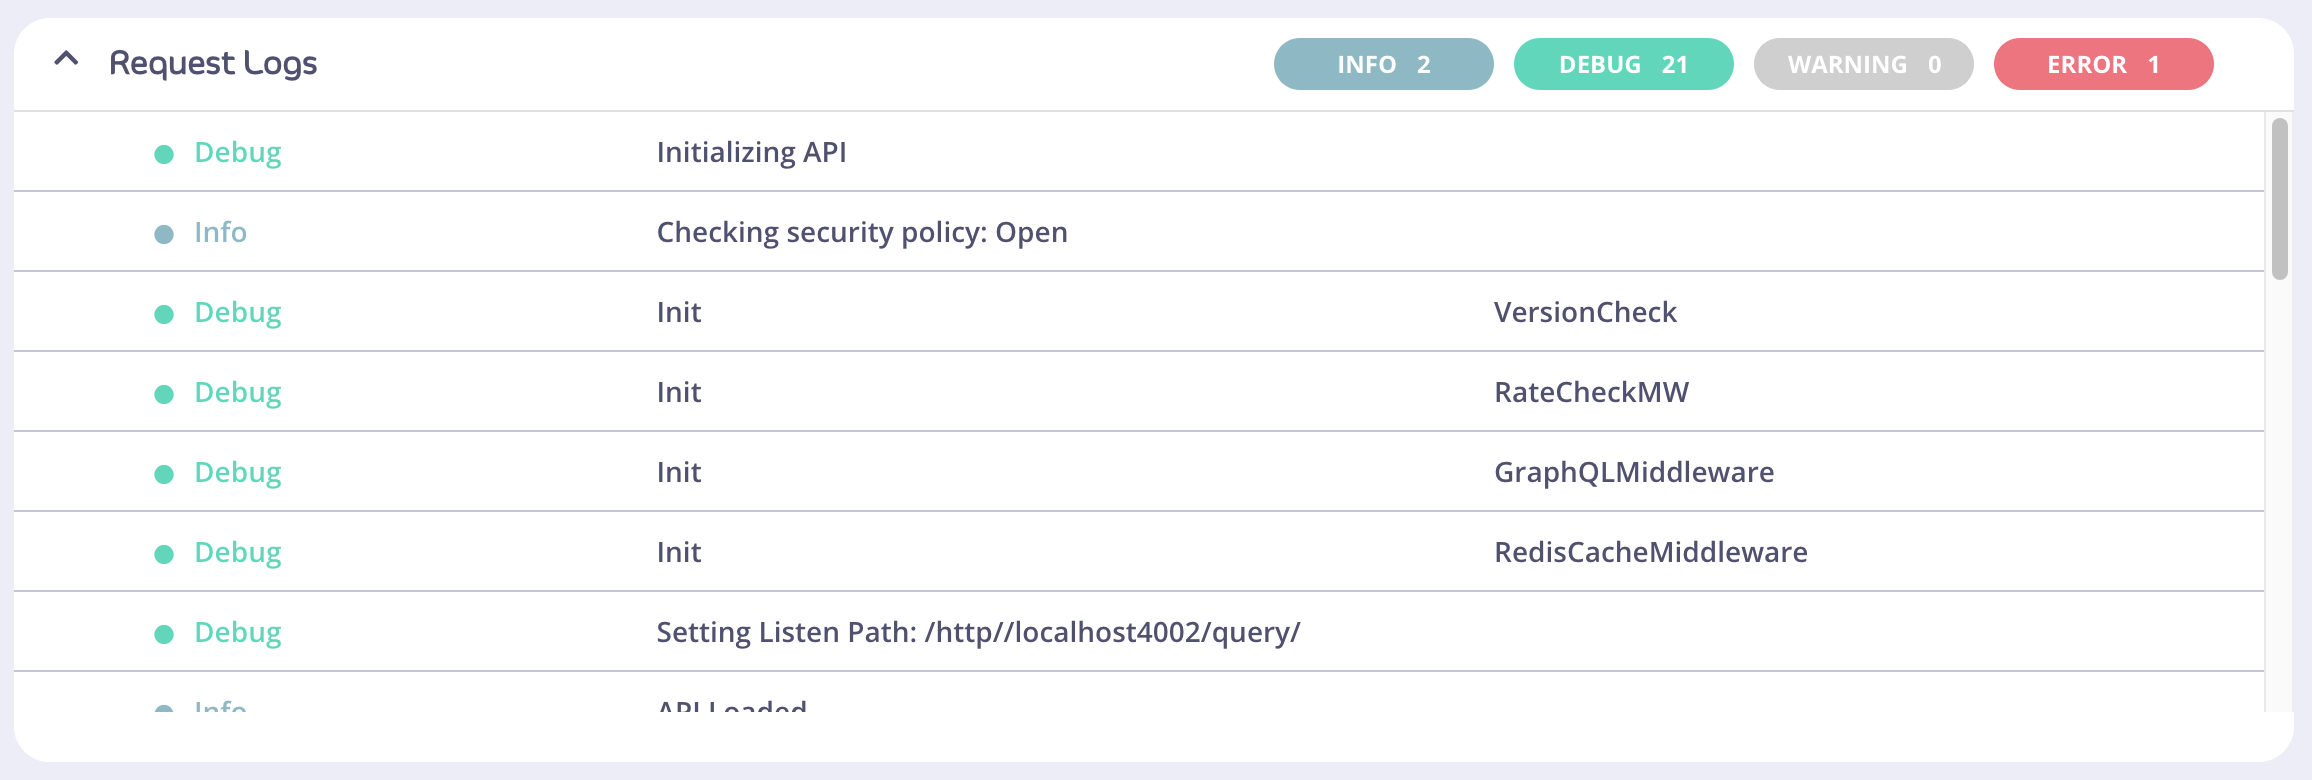
Expansion/collapse of Request Logs
The Request Logs can be expanded or collapsed, using the chevron on the left side to toggle these states.Filter buttons and states
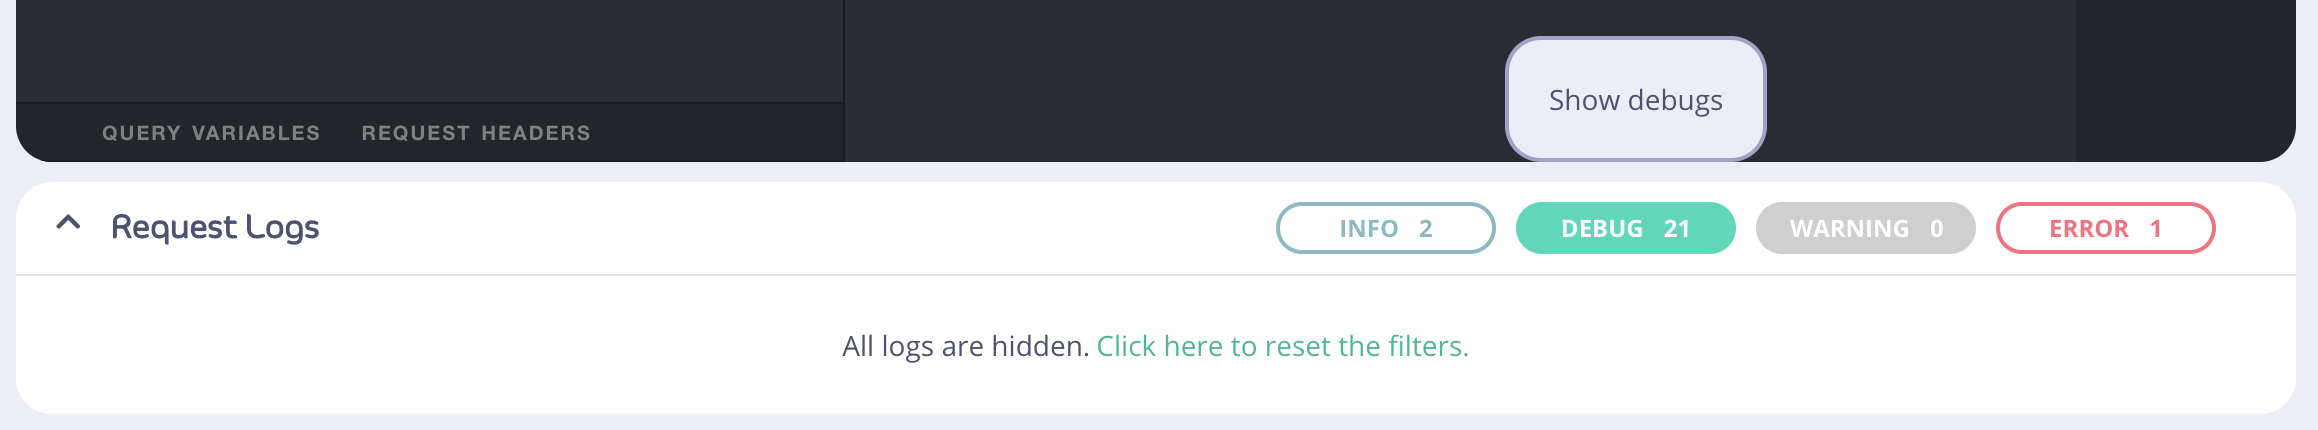
Filter buttons have two states: active and inactive; the default of which is active. A solid background color of the button indicates that a filter is active. In the below picture, theinfo and error filters buttons are both active. If there are no logs for a particular level of log, the button will appear as a gray and disabled, as shown by the Warning filter button.
“Show”.
If all filter buttons are inactive, a message asking whether the user would like to reset all filters will display. Clicking this text will activate all available filters.
Migrating to 3.2
As of 3.2 GraphQL schema for Tyk API definitions (i.eapi_definition.graphql) changed significantly, hence GraphQL API definitions created in previous beta versions are not supported via the UI and need to go through a manual migration.
Before you continue, we strongly advise to simply create a new API and avoid migration of the API definition. You’ll achieve results faster and can avoid typos and errors that happens with the manual migration.
Old API definitions will continue to work for the Tyk Gateway
The changes
-
To improve performance now a single Data Source can be used to link to multiple fields instead of having an independent data source for every field hence
graphql.type_field_configurationsis now obsolete and new data sources can be defined undergraphql.engine.data_sources(see example below). -
Data Source kind are
RESTorGraphQLregardless of your API being internal or not. -
In case of internal APIs that are accessed via
tyk://scheme, thegraphql.engine.data_sources[n].internalproperty is set to true. -
Each dataSources needs to be defined with a unique name
graphql.engine.data_sources[n].name. -
Each field connected to the data source is expected to be configured for mapping under
graphql.engine.field_configsregardless of it requiring mapping or not. -
It is important that all new GraphQL APIs have the version
graphql.versionproperty set to2.