This section lists commonly asked questions or frequently encountered issues and explains how to resolve them.Documentation Index
Fetch the complete documentation index at: https://tyk.io/docs/llms.txt
Use this file to discover all available pages before exploring further.
Tyk Configuration
- If there’s a configuration error or an unwanted change, can I easily revert to a previous API or Policy configuration? What are the options or best practices for effective rollbacks? You can configure Tyk-Sync to synchronise APIs and Policies with any version control system, like GitHub or GitLab and use it to perform roll back. Keys are not synchronised with Tyk Sync.
- How to Backup Configuration Files of Tyk Component’s ? Every Tyk component has a config file, that is used during start-up. They store critical settings and parameters that determine how your application behaves as well as settings for databases, passwords, and connections to other components. To ensure a comprehensive backup strategy, regularly back up configuration files for all relevant components, using a version control system (such as Git).
-
What are the different Config file per Tyk component ?
These are the config files per component:
- Tyk Gateway -
tyk.conf(For any user) - Tyk Pump -
pump.conf(For any user) - Tyk Dashboard -
tyk_analytics.conf(For Tyk Self-Managed clients) - MDCB -
tyk_sink.conf(for MDCB clients) - Hybrid Tyk Gateway -
tyk.hybrid.conf
- Tyk Gateway -
- How to Backup Tyk’s Certificates Directory ? Path to the private keys and certificate are defined in the config files of any of Tyk components. Make sure to back up the certificate and keys used by these config files.
-
How to Backup Middleware Directory for Custom Plugins ?
If you use custom middleware plugins to extend your application’s capabilities, regularly back up the middleware directory to preserve your customizations.
Details on middleware installation for Tyk Self-Managed users (users of the licensed product).
Details on middleware installation for Tyk Open Source users
Note: Tyk’s default name is
/middleware. You might use a different name for it. -
How to Backup Tyk API Definitions Directory - For Tyk Open source users ?
When using Tyk Gateway as an open-source product, it could use a dedicated directory to load your Tyk API definitions and start serving them.
If you use such a directory, ensure these definitions are part of your backup plan.
Note: Tyk’s default name is
/apps. You might use a different name for it based on this config field -
How to Backup Tyk Policies Directory - For Tyk Open source users ?
When using Tyk Gateway as an open-source product, it could use a file to load policies to be used by API keys when consuming the APIs.
If you use a policies file, ensure it is also part of your backup plan.
Note: Tyk’s default name is
/policies. You might use a different name for it based on this config field -
How to Backup Redis ?
Users: Redis is used in any type of deployment and as such used by any type of user (Open Source and paying users).
Backup Redis is important as all of the keys used by Tyk Gateway are stored there.
Redis, being an in-memory data store, is ephemeral and doesn’t have a built-in default backup policy, as such it requires specific considerations for backup. To understand the best practices for Redis backup, please visit the official Redis Backup Documentation. -
How to Backup Databases Used by Tyk Dashboard - a licensed product ?
Users: For Tyk Self-managed and MDCB users who are using our licensed products.
Tyk Dashboard allows you to choose between MongoDB and PostgreSQL as your database solution, depending on your preferences and requirements. Regardless of your choice, it’s crucial to implement a robust backup strategy to ensure the safety and availability of your data. Please check the section that fits your use case:
MongoDB Backup
MongoDB provides various methods for creating backups, and the choice of strategy often depends on your specific use case and environment. To learn more about MongoDB backup strategies, please refer to the MongoDB Backup Documentation.
- For Amazon DocumentDB user, check their backup and restore documentation
- For CosmosDB users check their online backup and on-demand data restore documentation
- For Amazon RDS users, check their backup and restore documentation. To further enhance your PostgreSQL backup process, you can explore services like AWS RDS Automated Backups if you’re hosting your database on AWS.
- For CosmosDB users check their online backup and on-demand data restore documentation
Enterprise Developer Portal
- What happens if the Portal goes down ? In the event of the portal application being down, the other components of the Tyk Stack will remain unaffected. This means your APIs will still be operational, and analytics will continue to be recorded. Developers will also be able to use their credentials for both oAuth2.0 and API Keys APIs. However, since the portal application is down, developers won’t be able to access their credentials or the analytical dashboard, request access to new API Products, or revoke or rotate their access credentials. Additionally, admin users won’t be able to use the portal, whether through its UI or APIs. This means you won’t be able to create, change, or remove any item managed by the portal, such as developers, organizations, content pages, API Products, plans, and more. Despite this, you still have some control over access credentials. If you need to rotate or remove access credentials, you can do so directly in the Tyk Dashboard or in your identity provider.
- What happens if the Dashboard goes down ? If the Tyk Dashboard goes down, developers will still be able to access their access credentials, but they won’t be able to rotate or remove their existing credentials, or request access to API Products. Additionally, the API Analytics dashboard will be compromised. However, API traffic will remain unaffected, meaning that your APIs will continue to be operational, and analytics will continue to be recorded. In terms of admin functionality, the only limitation will be the inability to approve or reject access requests or revoke or rotate access credentials.
-
Does the portal support SQL databases for storing the portal’s CMS assets ?
The Enterprise Developer Portal supports SQL databases (MariaDB, MySQL, and PostgreSQL) for storing the portal’s CMS assets. During the bootstrap process, the portal will create the appropriate tables in the main database. The only thing required to enable SQL storage for the portal’s assets is to specify theTyk no longer supports SQLite as of Tyk 5.7.0. To avoid disruption, please transition to PostgreSQL, MongoDB, or one of the listed compatible alternatives.
dbstorage type either via a config file or an environment variable.
Tyk Gateway
-
How to Check Your Gateway Version ?
Since Gateway version
5.0.8or5.2.3you can inspect detailed build information including the release version by runningtyk version.If you need this in a machine readable format, a--jsonflag is available.For older versions of Gateway, you can runtyk --versionto print the release version for your tyk binary. The binary is installed in/opt/tyk-gateway/tykby default. If your binary is not available in yourPATHenvironment, invoke it from there.
Tyk Cloud
- How can I track and audit changes made to Tyk Dashboard configurations ? To track changes in Dashboard configurations, please submit a support ticket. No configuration changes will occur without your explicit request.
Miscellaneous
- Error initialising system couldn’t unmarshal config The error “Error initializing system: couldn’t unmarshal config: invalid character” occurs in the Tyk Gateway logs due to improper syntax in the configuration files. To resolve this, carefully review and correct the syntax in all Tyk configuration files, restart the Gateway, and, if the issue persists, validate the JSON files using JSONLint.
-
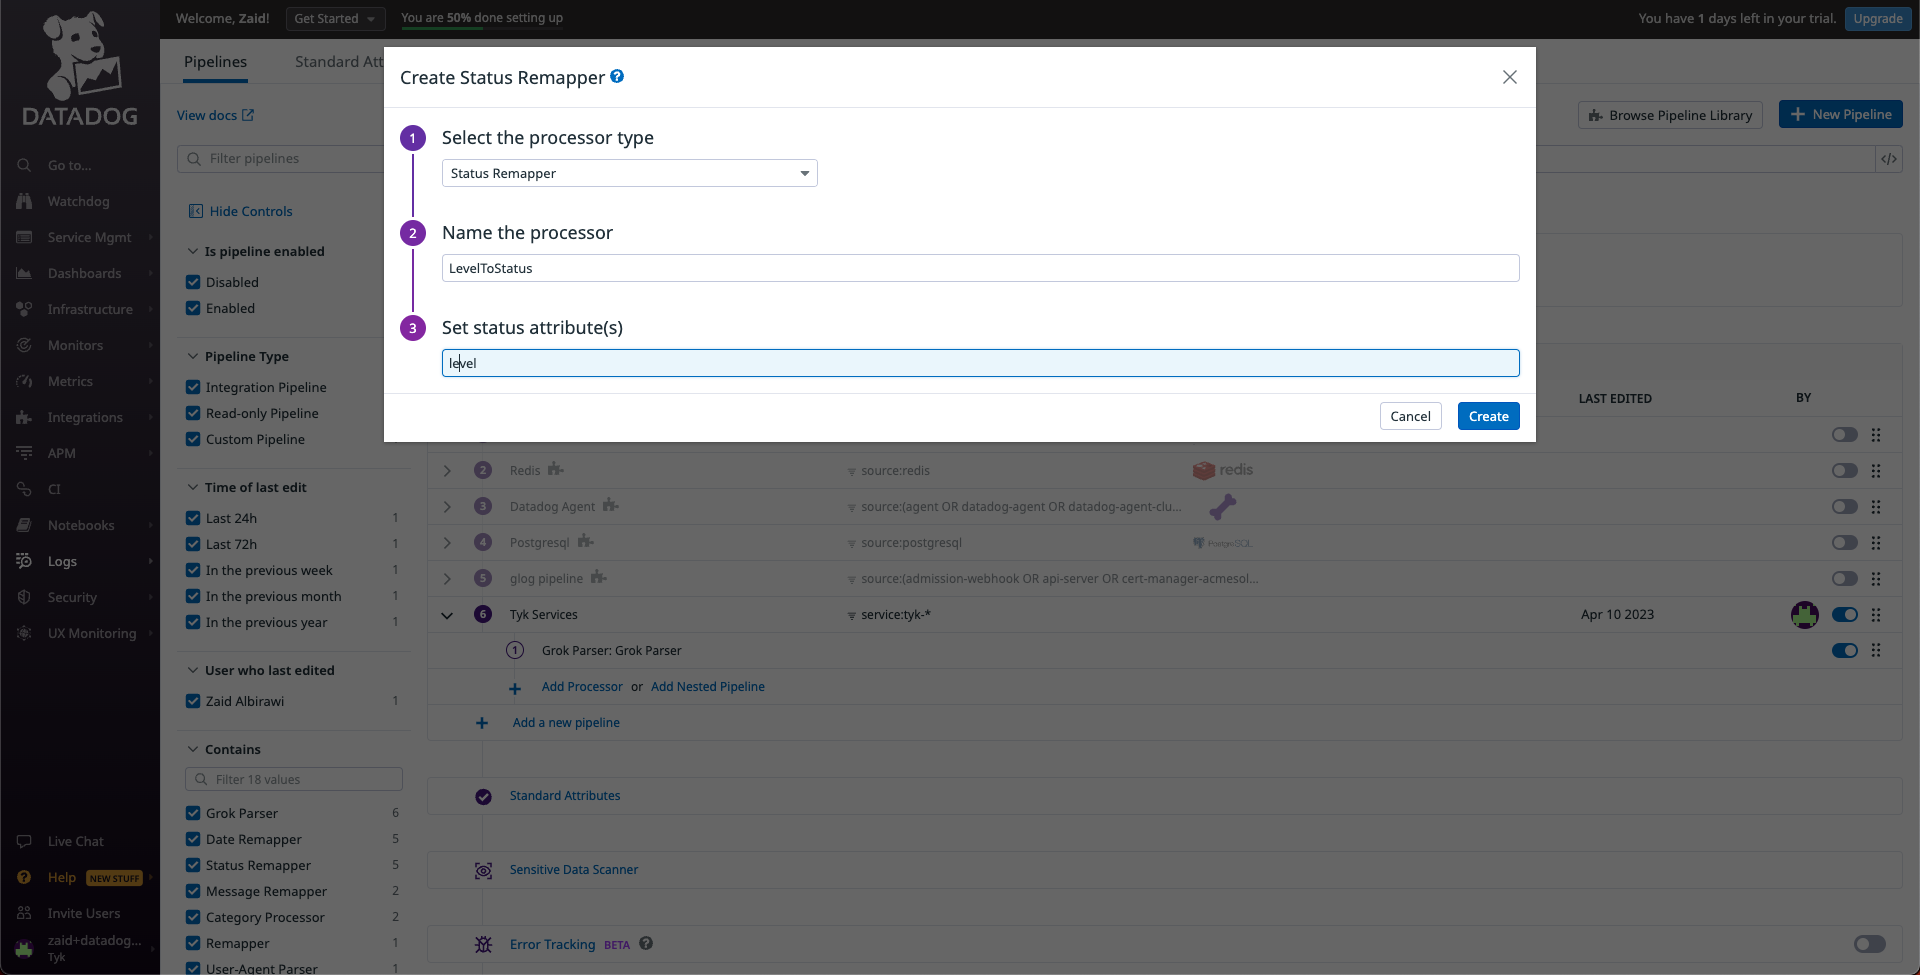
All tyk container logs show up under the error status in Datadog logs
With Datadog you can view logs of all your Tyk components.
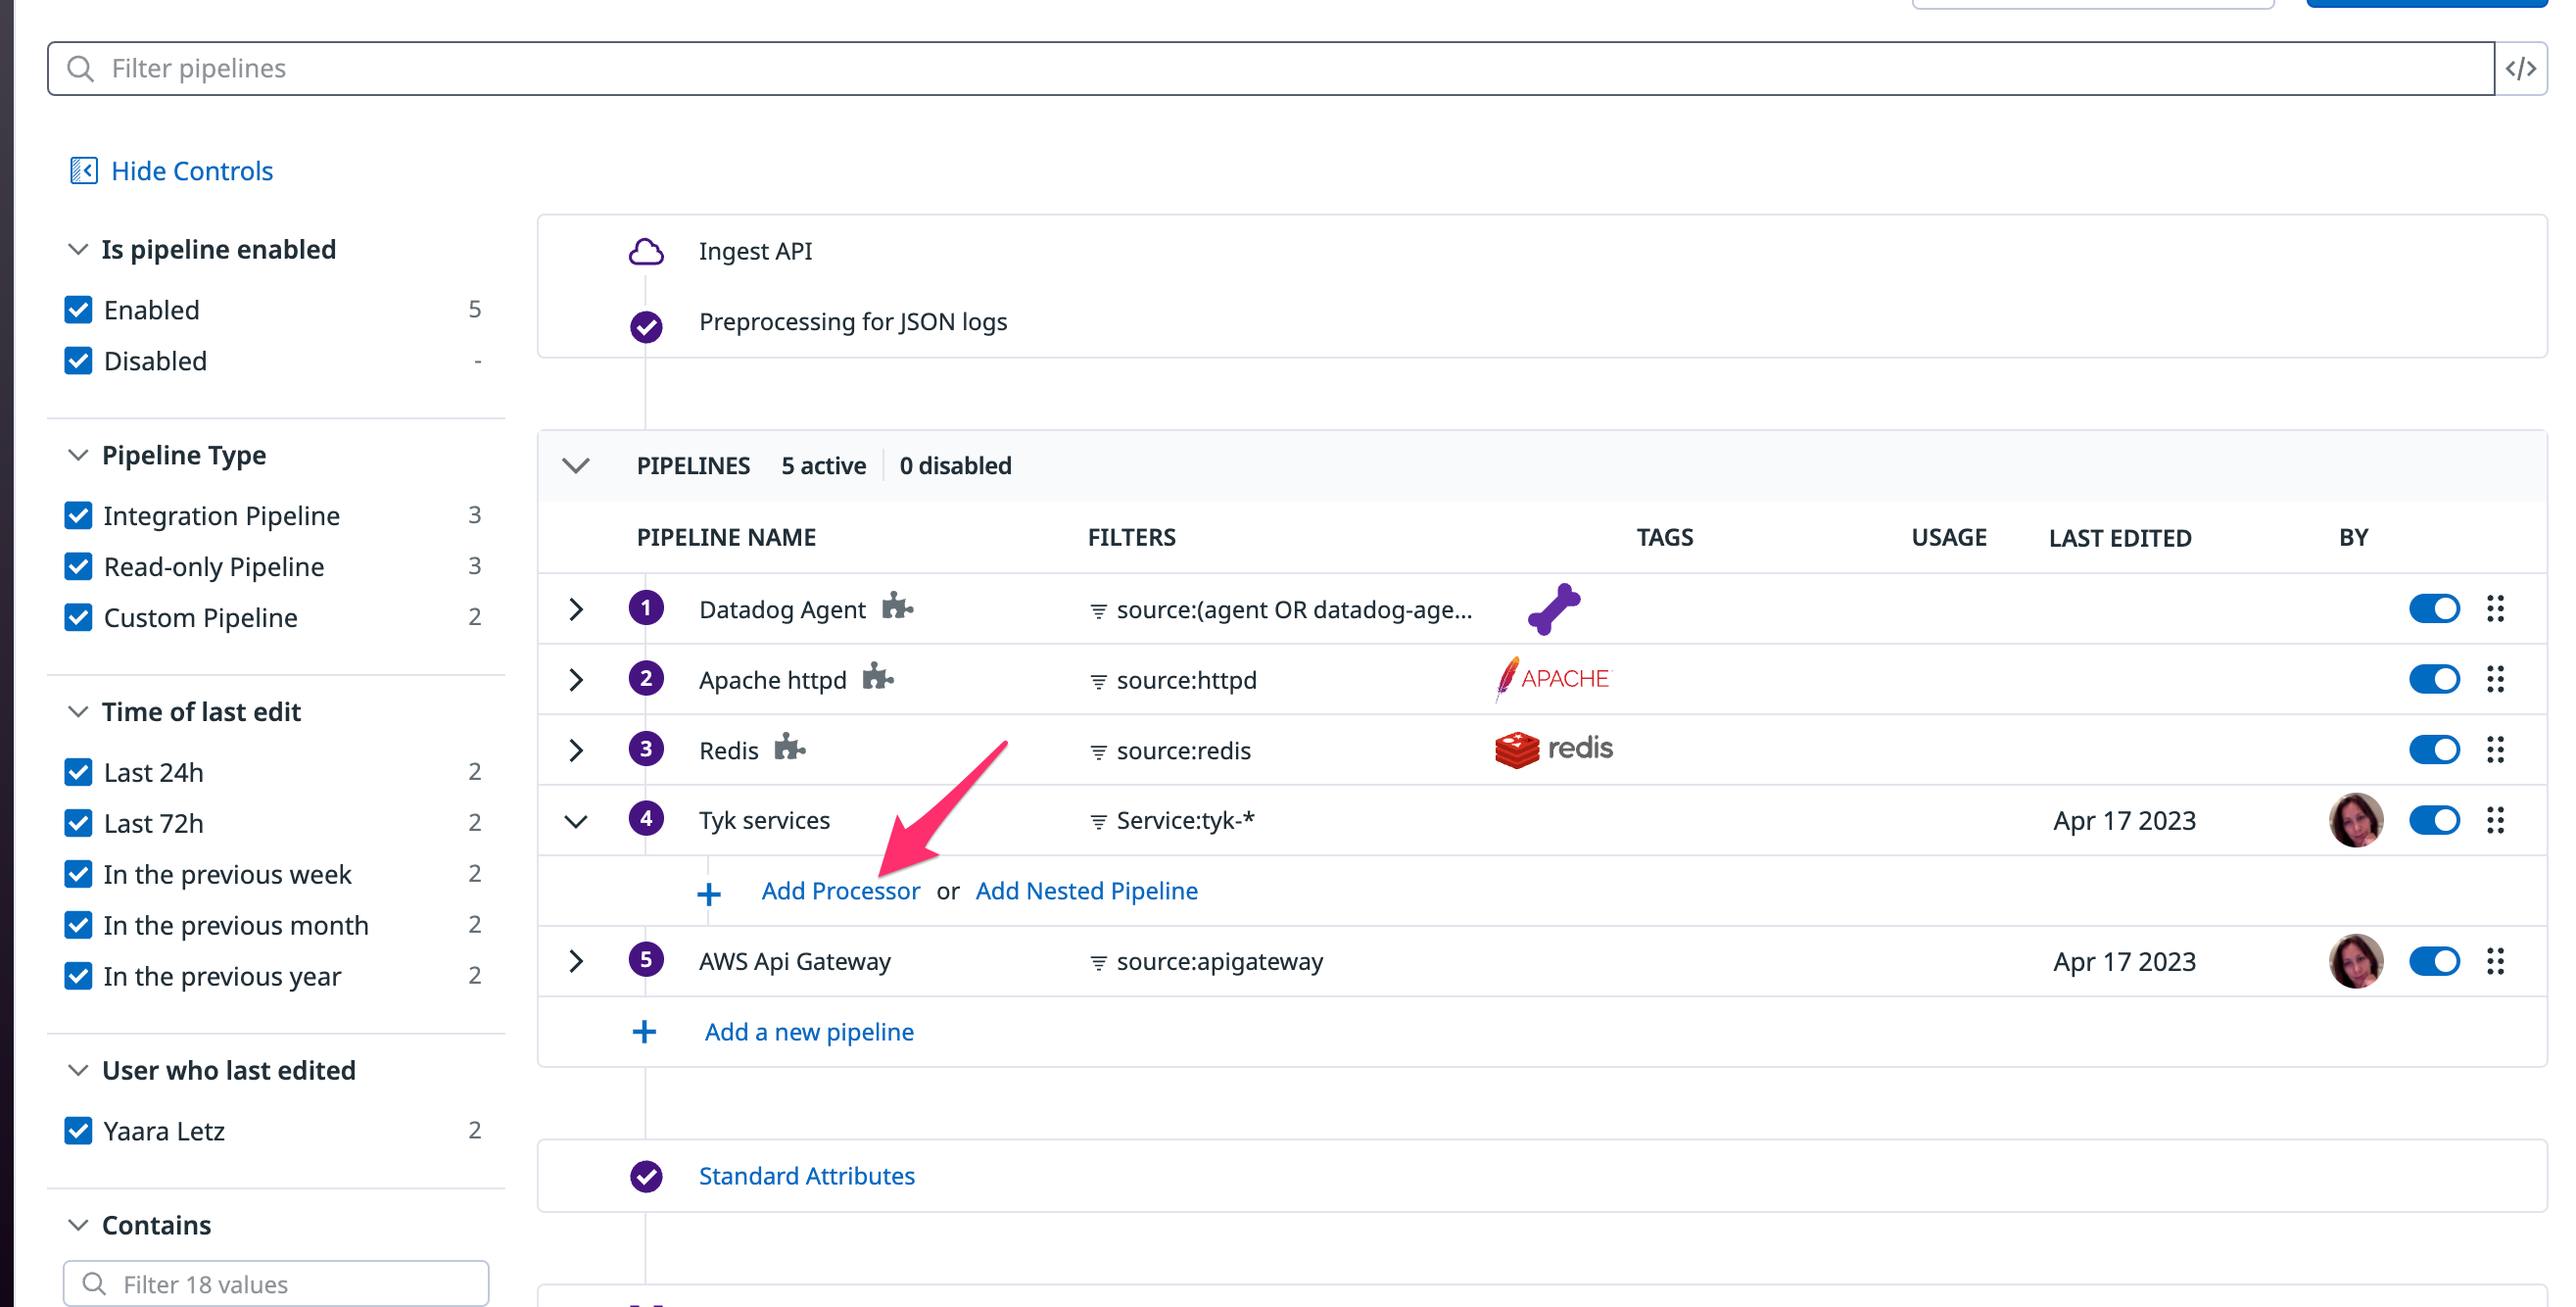
To allow Datadog Agent to scrape the logs of your Tyk deployment correctly you need to create a pipeline in Datadog, to process and underst and this data.
To do that, we need to access the
/logs/pipelinespath on your datadog web application. This will take us to the pipeline configuration page. In here, we will create a new pipeline. For the filter section, useService:tyk-*this will capture logs for any of the Tyk related services.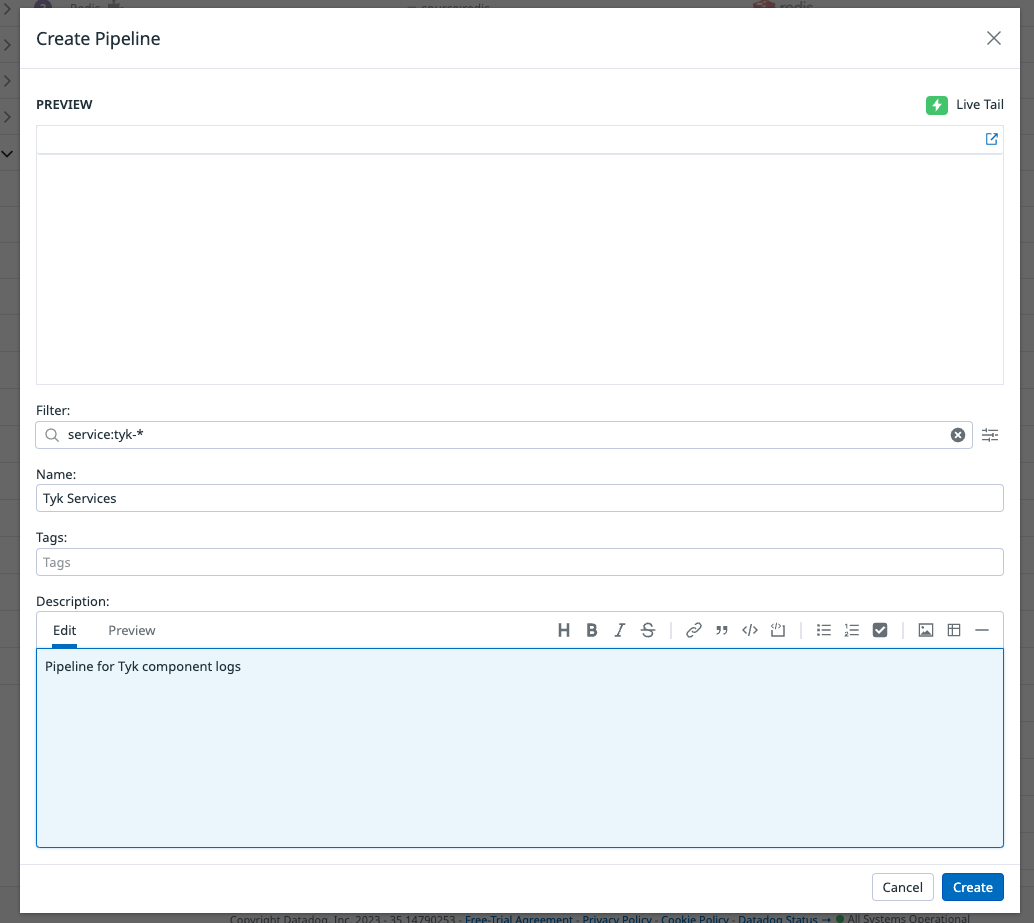
Parse My Logsbutton andCreate.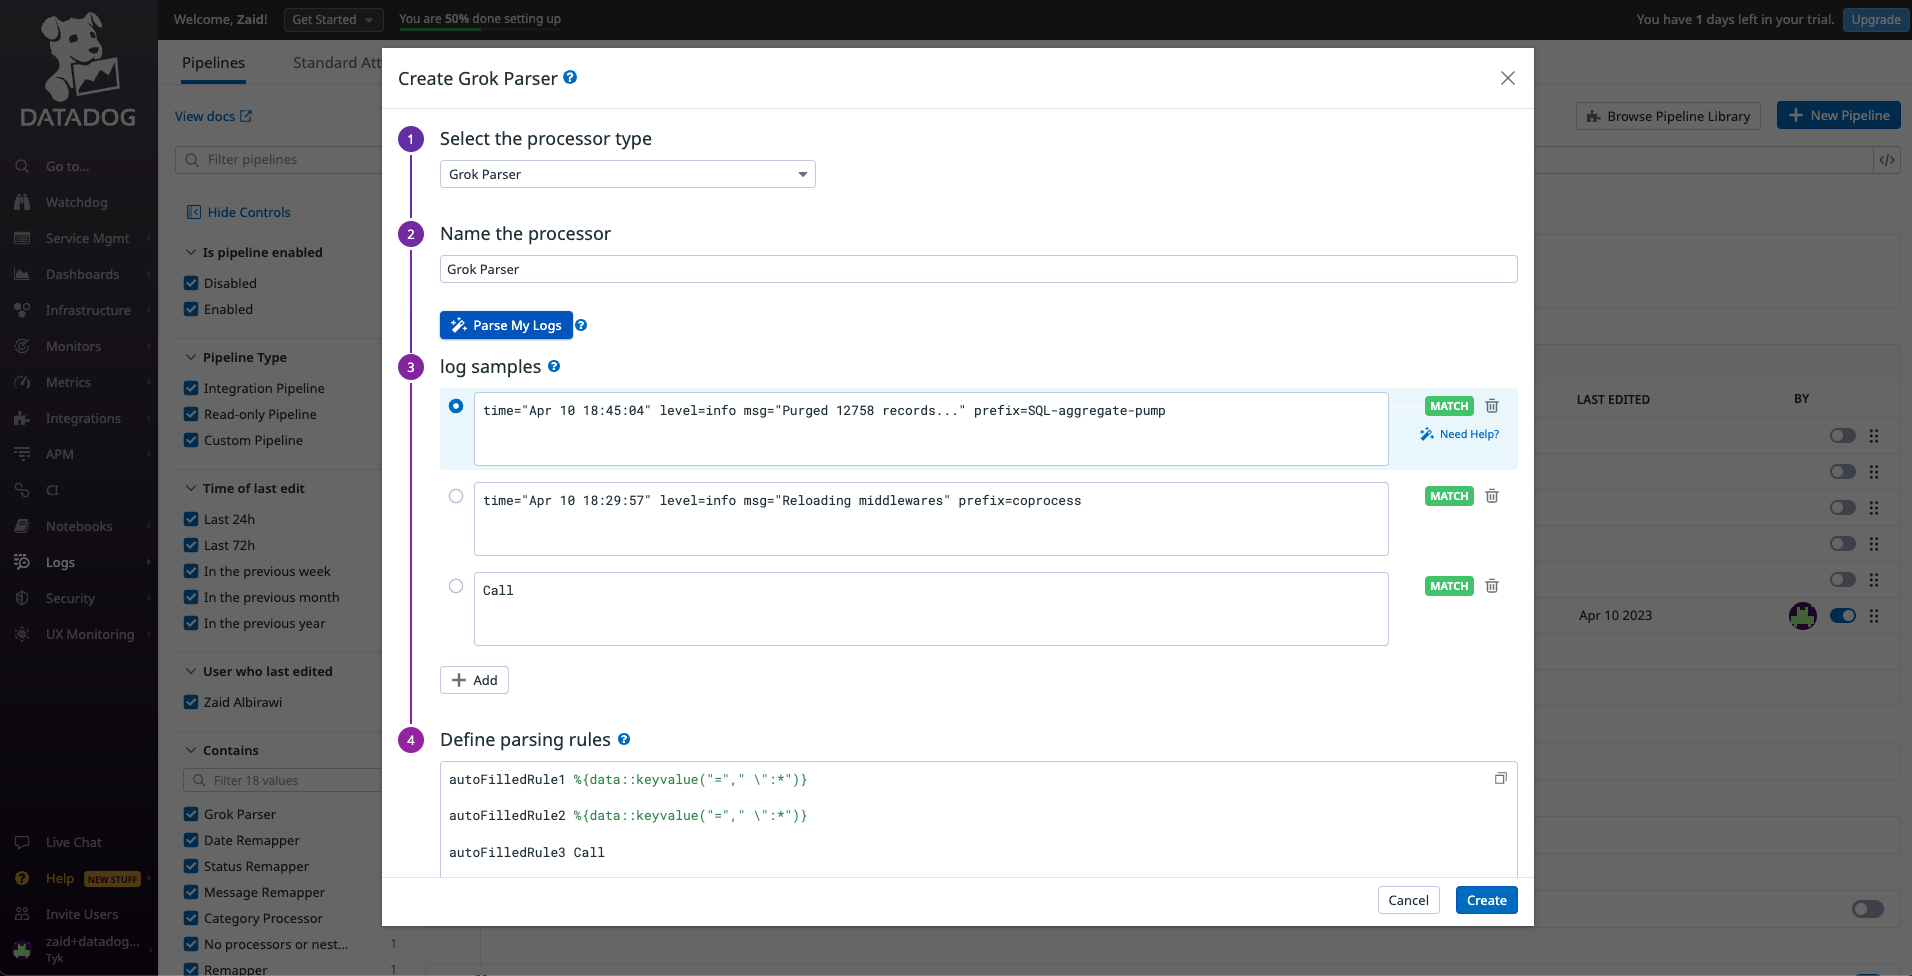
levelthenCreate.