Documentation Index
Fetch the complete documentation index at: https://tyk.io/docs/llms.txt
Use this file to discover all available pages before exploring further.
What is the performance impact of analytics
Tyk Gateway allows analytics to be recorded and stored in a persistent data store (MongoDB/SQL) for all APIs by default, via Tyk Pump. Tyk Gateway generates transaction records for each API request and response, containing analytics data relating to: the originating host (where the request is coming from), which Tyk API version was used, the HTTP method requested and request path etc. The transaction records are transmitted to Redis and subsequently transferred to a persistent data store of your choice via Tyk Pump. Furthermore, Tyk Pump can also be configured to aggregate the transaction records (using different data keys - API ID, access key, endpoint, response status code, location) and write to a persistent data store. Tyk Dashboard uses this data for:- Aggregated analytics - Displaying analytics based on the aggregated data.
- Log Browser to display raw transaction records.
How Do Analytics Impact Performance?
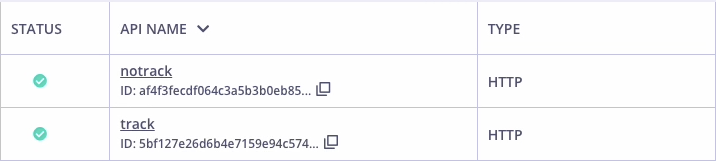
Analytics may introduce the problem of increased CPU load and a decrease in the number of requests per second (RPS). In the Tyk Dashboard API screen below, there are two APIs, track and notrack. The APIs were created to conduct a simple load test, to show the gateway’s RPS (requests per second) for each API:- track: Traffic to this API is tracked, i.e. transaction records are generated for each request/response.
- notrack: Traffic to this API is not tracked, i.e. transaction records are not generated for each request/response.
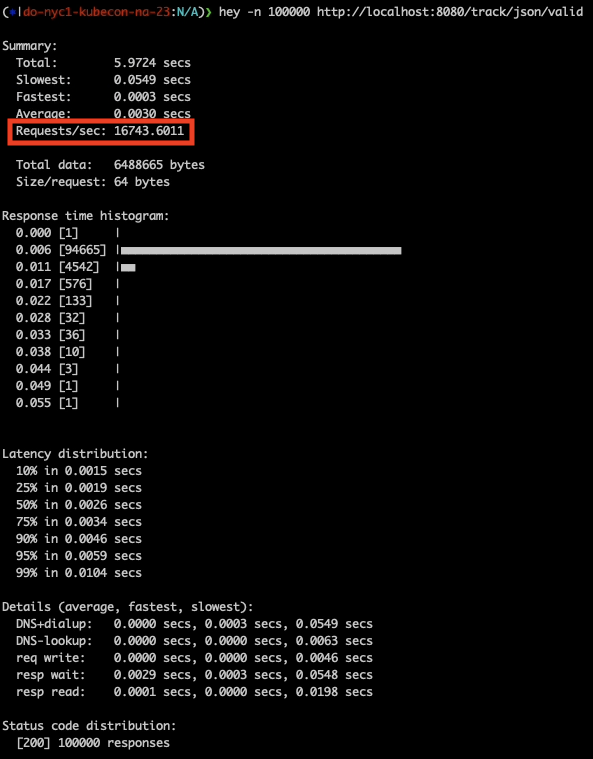
Tracked API Performance
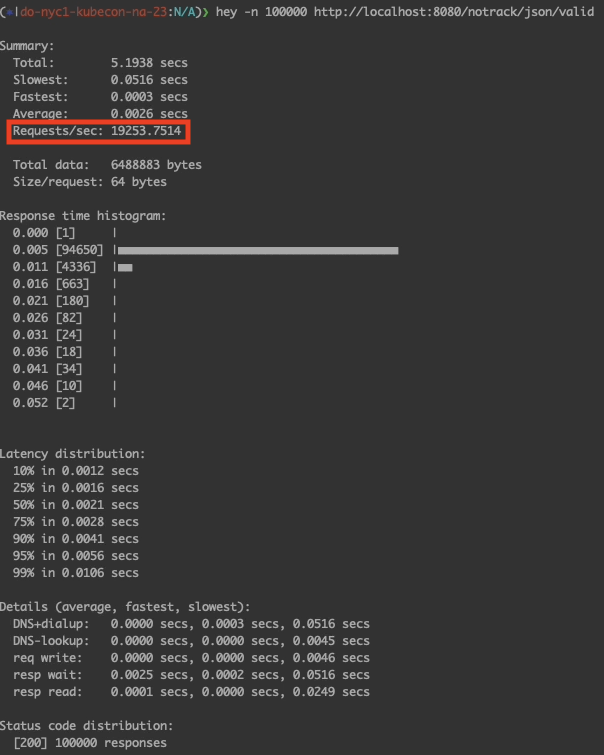
Untracked API Performance
Explaining the results
We can see that 19,253.75 RPS was recorded for the untracked API; with 16,743.6011 RPS reported for the tracked API. The number of requests per second decreased by ~13% when analytics was enabled.What Can Be Done To Address This Performance Impact?
Tyk is configurable, allowing fine grained control over which information should be recorded and which can be skipped, thus reducing CPU cycles, traffic and storage. Users can selectively prevent the generation of analytics for do_not_track middleware:- Per API: Tyk Gateway will not create records for requests/responses for any endpoints of an API.
- Per Endpoint: Tyk Gateway will not create records for requests/responses for specific endpoints.
Conclusion
Disabling the creation of analytics (either per API or for specific endpoints) helps to reduce CPU cycles and network requests for systems that exhibit high load and traffic, e.g. social media platforms, streaming, financial services and trading platforms. Application decisions need to be made concerning which endpoints are non critical and can thus have analytics disabled. Furthermore, benchmarking and testing will be required to evaluate the actual benefits for the application specific use case. Subsequently, it is worthwhile monitoring traffic and system load and using this feature to improve performance.How to reduce CPU usage in a Redis Cluster
What does high CPU usage in a Redis node within a Redis Cluster mean ?
When a single Redis node within a Redis Cluster exhibits high CPU usage, it indicates that the CPU resources of that particular node are being heavily utilized compared to others in the cluster. The illustration below highlights the scenario where a single Redis node is exhibiting high CPU usage of 1.20% within a Redis Cluster.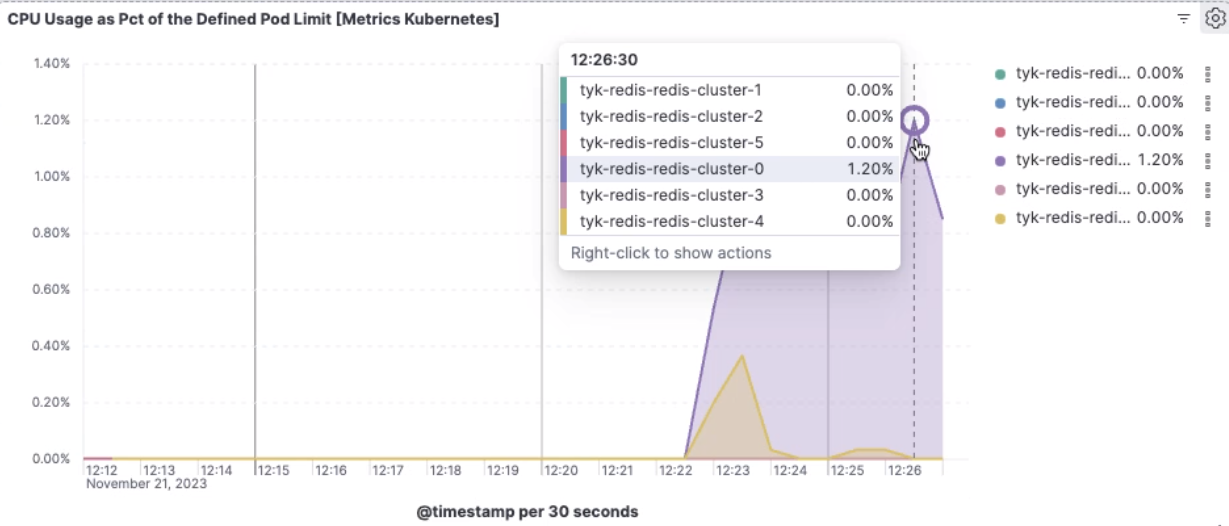
What could be causing this high CPU usage ?
One possible reason for high CPU usage in a single Redis node within a Redis Cluster is that analytics features are enabled and keys are being stored within that specific Redis node.How does storing keys within a single Redis server contribute to high CPU usage ?
A high volume of analytics traffic can decrease performance, since all analytics keys are stored within one Redis server. Storing keys within a single Redis server can lead to increased CPU usage because all operations related to those keys, such as retrieval, updates and analytics processing, are concentrated on that server. This can result in heavier computational loads on that particular node. This leads to high CPU usage.What can be done to address high CPU usage in this scenario ?
Consider distributing the analytics keys across multiple Redis nodes within the cluster. This can help distribute the computational load more evenly, reducing the strain on any single node and potentially alleviating the high CPU usage. In Redis, key sharding is a term used to describe the practice of distributing data across multiple Redis instances or shards based on the keys. This feature is provided by Redis Cluster and provides horizontal scalability and improved performance. Tyk supports configuring this behavior so that analytics keys are distributed across multiple servers within a Redis cluster. The image below illustrates that CPU usage is reduced across two Redis servers after making this configuration change.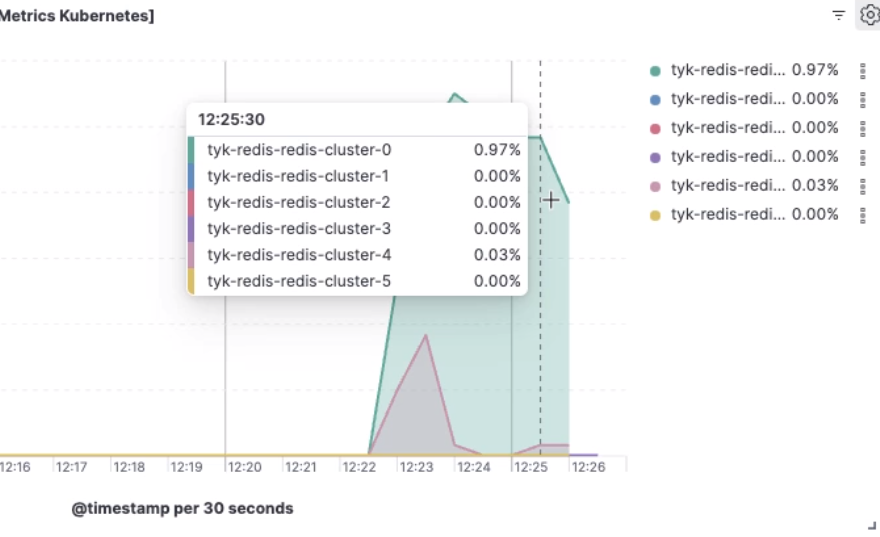
How do I configure Tyk to distribute analytics keys to multiple Redis shards ?
Follow these steps:-
Check that your Redis Cluster is correctly configured
Confirm that the
enable_clusterconfiguration option is set to true in the Tyk Gateway, Tyk Dashboard and Tyk Pump configuration files. This setting informs Tyk that a Redis Cluster is in use for key storage. Ensure that theaddrsarray is populated in the Tyk Gateway and Tyk Pump configuration files (tyk.conf and pump.conf) with the addresses of all Redis Cluster nodes. If you are using Tyk Self Managed (the licensed product), also update Tyk Dashboard configuration file (tyk_analytics.conf). This ensures that the Tyk components can interact with the entire Redis Cluster. Please refer to the configure Redis Cluster guide for further details. -
Configure Tyk to distribute analytics keys to multiple Redis shards
To distribute analytics keys across multiple Redis shards effectively you need to configure the Tyk components to leverage the Redis cluster’s sharding capabilities:
- Optimize Analytics Configuration: In the Tyk Gateway configuration (tyk.conf), set analytics_config.enable_multiple_analytics_keys to true. This option allows Tyk to distribute analytics data across Redis nodes, using multiple keys for the analytics. There’s a corresponding option for Self Managed MDCB, also named enable_multiple_analytics_keys. Useful only if the gateways in the data plane are configured to send analytics to MDCB.
- Optimize Connection Pool Settings: Adjust the optimization_max_idle and optimization_max_active settings in the configuration files to ensure that the connection pool can handle the analytics workload without overloading any Redis shard.
- Use a Separate Analytics Store: For high analytics traffic, you can opt to use a dedicated Redis Cluster for analytics by setting enable_separate_analytics_store to true in the Tyk Gateway configuration file (tyk.conf) and specifying the separate Redis cluster configuration in the
analytics_storagesection. Please consult the separated analytics storage guide for an example with Tyk Pump that can equally be applied to Tyk Gateway. - Review and Test: After implementing these changes, thoroughly review your configurations and conduct load testing to verify that the analytics traffic is now evenly distributed across all Redis shards.