> ## Documentation Index
> Fetch the complete documentation index at: https://tyk.io/docs/llms.txt
> Use this file to discover all available pages before exploring further.
# Get Started with Tyk Observability
> Add logs, distributed traces, and metrics to a Tyk Gateway deployment using Docker Compose with an OpenTelemetry Collector, Prometheus, Loki, Tempo, and Grafana.
## Introduction
Tyk Gateway exports all three observability signals (structured logs, distributed traces, and metrics) via the OpenTelemetry Protocol (OTLP). This guide shows you how to enable each signal and route them to a local Grafana stack (Prometheus, Loki, Tempo) using an OpenTelemetry Collector.
By the end of this guide you will have:
* Structured JSON access logs from Tyk Gateway shipping to [Loki](https://grafana.com/oss/loki/)
* Distributed traces exporting to [Tempo](https://grafana.com/oss/tempo/)
* Gateway metrics (request rate, latency, error rate) flowing to [Prometheus](https://grafana.com/oss/prometheus/)
* A Grafana instance wired up to all three backends
## Availability
| Signal | Minimum Gateway version |
| ----------------------------------------- | ----------------------- |
| Structured JSON logs (`log_format: json`) | 5.6.0 |
| Access logs (`access_logs.enabled`) | 5.8.0 |
| Distributed traces (OTLP) | 5.3.0 |
| OTLP metrics | 5.13.0 |
## Prerequisites
* [Docker](https://docs.docker.com/get-docker/) and [Docker Compose](https://docs.docker.com/compose/install/) installed
* A running Tyk deployment. We recommend following the [Tyk getting started guide](https://tyk.io/docs/getting-started/quick-start#getting-started-with-tyk-self-managed) to set up a local Docker environment
* Basic familiarity with Docker Compose
## Architecture
All three signals flow from Tyk Gateway to a single OpenTelemetry Collector endpoint. The Collector fans them out to the appropriate backend. Grafana queries all three.
```mermaid theme={null}
flowchart LR
TGW[Tyk Gateway]
COL[OTel Collector]
PRO[Prometheus]
LOK[Loki]
TMP[Tempo]
GRA[Grafana]
TGW -->|"OTLP gRPC :4317\n(traces + metrics)"| COL
TGW -->|"container logs\n(filelog receiver)"| COL
COL -->|metrics| PRO
COL -->|logs| LOK
COL -->|traces| TMP
PRO --> GRA
LOK --> GRA
TMP --> GRA
```
Tyk Gateway does not export logs via OTLP. It writes structured JSON to `stderr`. The OTel Collector reads those logs from the Docker container log path using the `filelog` receiver.
## Instructions
### Step 1: Configure Tyk Gateway
Add the following environment variables to your `tyk-gateway` service. These enable all three signals:
```yaml expandable theme={null}
services:
tyk-gateway:
environment:
# Structured JSON logs (requires v5.6.0+)
- TYK_GW_LOGFORMAT=json
# Per-request access logs with trace ID correlation (requires v5.8.0+)
- TYK_GW_ACCESSLOGS_ENABLED=true
# Distributed tracing
- TYK_GW_OPENTELEMETRY_TRACES_ENABLED=true
- TYK_GW_OPENTELEMETRY_TRACES_ENDPOINT=otel-collector:4317
- TYK_GW_OPENTELEMETRY_TRACES_SAMPLING_TYPE=TraceIDRatioBased
- TYK_GW_OPENTELEMETRY_TRACES_SAMPLING_RATE=1.0
# OTLP metrics
- TYK_GW_OPENTELEMETRY_METRICS_ENABLED=true
- TYK_GW_OPENTELEMETRY_METRICS_ENDPOINT=otel-collector:4317
- TYK_GW_OPENTELEMETRY_METRICS_EXPORTINTERVAL=15
```
If you prefer `tyk.conf`, the equivalent configuration is:
```json expandable theme={null}
{
"log_format": "json",
"access_logs": {
"enabled": true
},
"opentelemetry": {
"traces": {
"enabled": true,
"endpoint": "otel-collector:4317",
"sampling": {
"type": "TraceIDRatioBased",
"rate": 1.0
}
},
"metrics": {
"enabled": true,
"endpoint": "otel-collector:4317",
"export_interval": 15
}
}
}
```
`sampling.rate: 1.0` captures every request, which is suitable for getting started. In production, lower this to `0.1` (10%) or use `ParentBased` sampling. See the [Tyk Gateway configuration reference](/tyk-oss-gateway/configuration#opentelemetry-sampling) for all options.
### Step 2: Add the OTel Collector
Create an `otelcol-config.yml` file in your deployment directory:
```yaml expandable theme={null}
receivers:
otlp:
protocols:
grpc:
endpoint: 0.0.0.0:4317
http:
endpoint: 0.0.0.0:4318
filelog/tyk-gateway:
include: ["/var/lib/docker/containers/*/*-json.log"]
include_file_name: false
include_file_path: true
start_at: end
operators:
- type: json_parser
parse_from: body
parse_to: attributes.docker
on_error: drop
- type: move
from: attributes.docker.log
to: body
- type: json_parser
parse_from: body
parse_to: attributes.tyk
on_error: drop
- type: filter
expr: 'attributes.tyk.prefix == nil and attributes.tyk.msg == nil'
- type: time_parser
parse_from: attributes.tyk.time
layout: '%Y-%m-%dT%H:%M:%SZ'
on_error: send_quiet
- type: severity_parser
parse_from: attributes.tyk.level
on_error: send_quiet
processors:
batch: {}
resource/tyk_gateway_logs:
attributes:
- action: upsert
key: service.name
value: tyk-gateway
memory_limiter:
check_interval: 1s
limit_percentage: 75
spike_limit_percentage: 20
transform/tyk_gw_resource_attrs:
error_mode: ignore
metric_statements:
- context: datapoint
statements:
- set(attributes["tyk_gw_id"], resource.attributes["tyk.gw.id"]) where resource.attributes["tyk.gw.id"] != nil
- set(attributes["tyk_gw_group_id"], resource.attributes["tyk.gw.group.id"]) where resource.attributes["tyk.gw.group.id"] != nil
- set(attributes["tyk_gw_tags"], resource.attributes["tyk.gw.tags"]) where resource.attributes["tyk.gw.tags"] != nil
exporters:
otlphttp/prometheus:
endpoint: "http://prometheus:9090/api/v1/otlp"
tls:
insecure: true
otlphttp/loki:
endpoint: "http://loki:3100/otlp"
tls:
insecure: true
otlp/tempo:
endpoint: "tempo:4317"
tls:
insecure: true
service:
pipelines:
traces:
receivers: [otlp]
processors: [memory_limiter, batch]
exporters: [otlp/tempo]
metrics:
receivers: [otlp]
processors: [memory_limiter, transform/tyk_gw_resource_attrs, batch]
exporters: [otlphttp/prometheus]
logs:
receivers: [filelog/tyk-gateway]
processors: [memory_limiter, resource/tyk_gateway_logs, batch]
exporters: [otlphttp/loki]
```
Then add the `otel-collector` service to your `docker-compose.yml`:
```yaml expandable theme={null}
services:
otel-collector:
image: ghcr.io/open-telemetry/opentelemetry-collector-releases/opentelemetry-collector-contrib:0.133.0
user: "0" # Required — without this, permission denied reading /var/lib/docker/containers
volumes:
- ./otelcol-config.yml:/etc/otelcol-contrib/config.yaml
- /var/lib/docker/containers:/var/lib/docker/containers:ro
- /var/run/docker.sock:/var/run/docker.sock:ro
ports:
- "4317:4317"
- "4318:4318"
networks:
- tyk
```
The volume mounts give the Collector read access to Docker container logs for the `filelog` receiver.
### Step 3: Add the Grafana stack
Add Prometheus, Loki, Tempo, and Grafana to your `docker-compose.yml`:
```yaml expandable theme={null}
services:
prometheus:
image: prom/prometheus:v3.4.0
command:
- --config.file=/etc/prometheus/prometheus.yml
- --web.enable-otlp-receiver
volumes:
- ./prometheus.yml:/etc/prometheus/prometheus.yml
ports:
- "9090:9090"
networks:
- tyk
loki:
image: grafana/loki:3.5.0
command: -config.file=/etc/loki/local-config.yaml
ports:
- "3100:3100"
networks:
- tyk
tempo:
image: grafana/tempo:2.7.2
command: -config.file=/etc/tempo.yaml
volumes:
- ./tempo.yaml:/etc/tempo.yaml
ports:
- "3200:3200"
- "4317"
networks:
- tyk
grafana:
image: grafana/grafana:12.0.0
environment:
- GF_AUTH_ANONYMOUS_ENABLED=true
- GF_AUTH_ANONYMOUS_ORG_ROLE=Admin
volumes:
- ./grafana/provisioning:/etc/grafana/provisioning
ports:
- "3001:3000"
networks:
- tyk
depends_on:
- prometheus
- loki
- tempo
```
Grafana is mapped to port `3001` to avoid conflicting with Tyk Dashboard on port `3000`. Adjust if needed.
Create a minimal `prometheus.yml` to allow OTLP ingest:
```yaml theme={null}
global:
scrape_interval: 15s
storage:
tsdb:
out_of_order_time_window: 10m
```
Create a minimal `tempo.yaml`:
```yaml expandable theme={null}
server:
http_listen_port: 3200
distributor:
receivers:
otlp:
protocols:
grpc:
endpoint: 0.0.0.0:4317
storage:
trace:
backend: local
local:
path: /tmp/tempo/blocks
```
#### Provision Grafana datasources
Create `grafana/provisioning/datasources/tyk.yaml`:
```yaml expandable theme={null}
apiVersion: 1
datasources:
- name: Prometheus
type: prometheus
url: http://prometheus:9090
isDefault: true
- name: Loki
type: loki
url: http://loki:3100
- name: Tempo
type: tempo
url: http://tempo:3200
```
### Step 4: Start and verify
Restart your deployment to apply the configuration changes to your Gateway and bring up the new services:
```bash theme={null}
docker compose up -d
```
Send test requests through Tyk Gateway, then open Grafana at **[http://localhost:3001](http://localhost:3001)** and verify each signal.
If you are following this guide using the Tyk Self-Managed getting started setup, an **httpbingo** API is pre-configured. Generate test traffic with:
```bash theme={null}
for i in $(seq 1 10); do curl -s -o /dev/null -w "HTTP %{http_code}\n" \
-H "Authorization: " http://localhost:8080/httpbingo/get; done
```
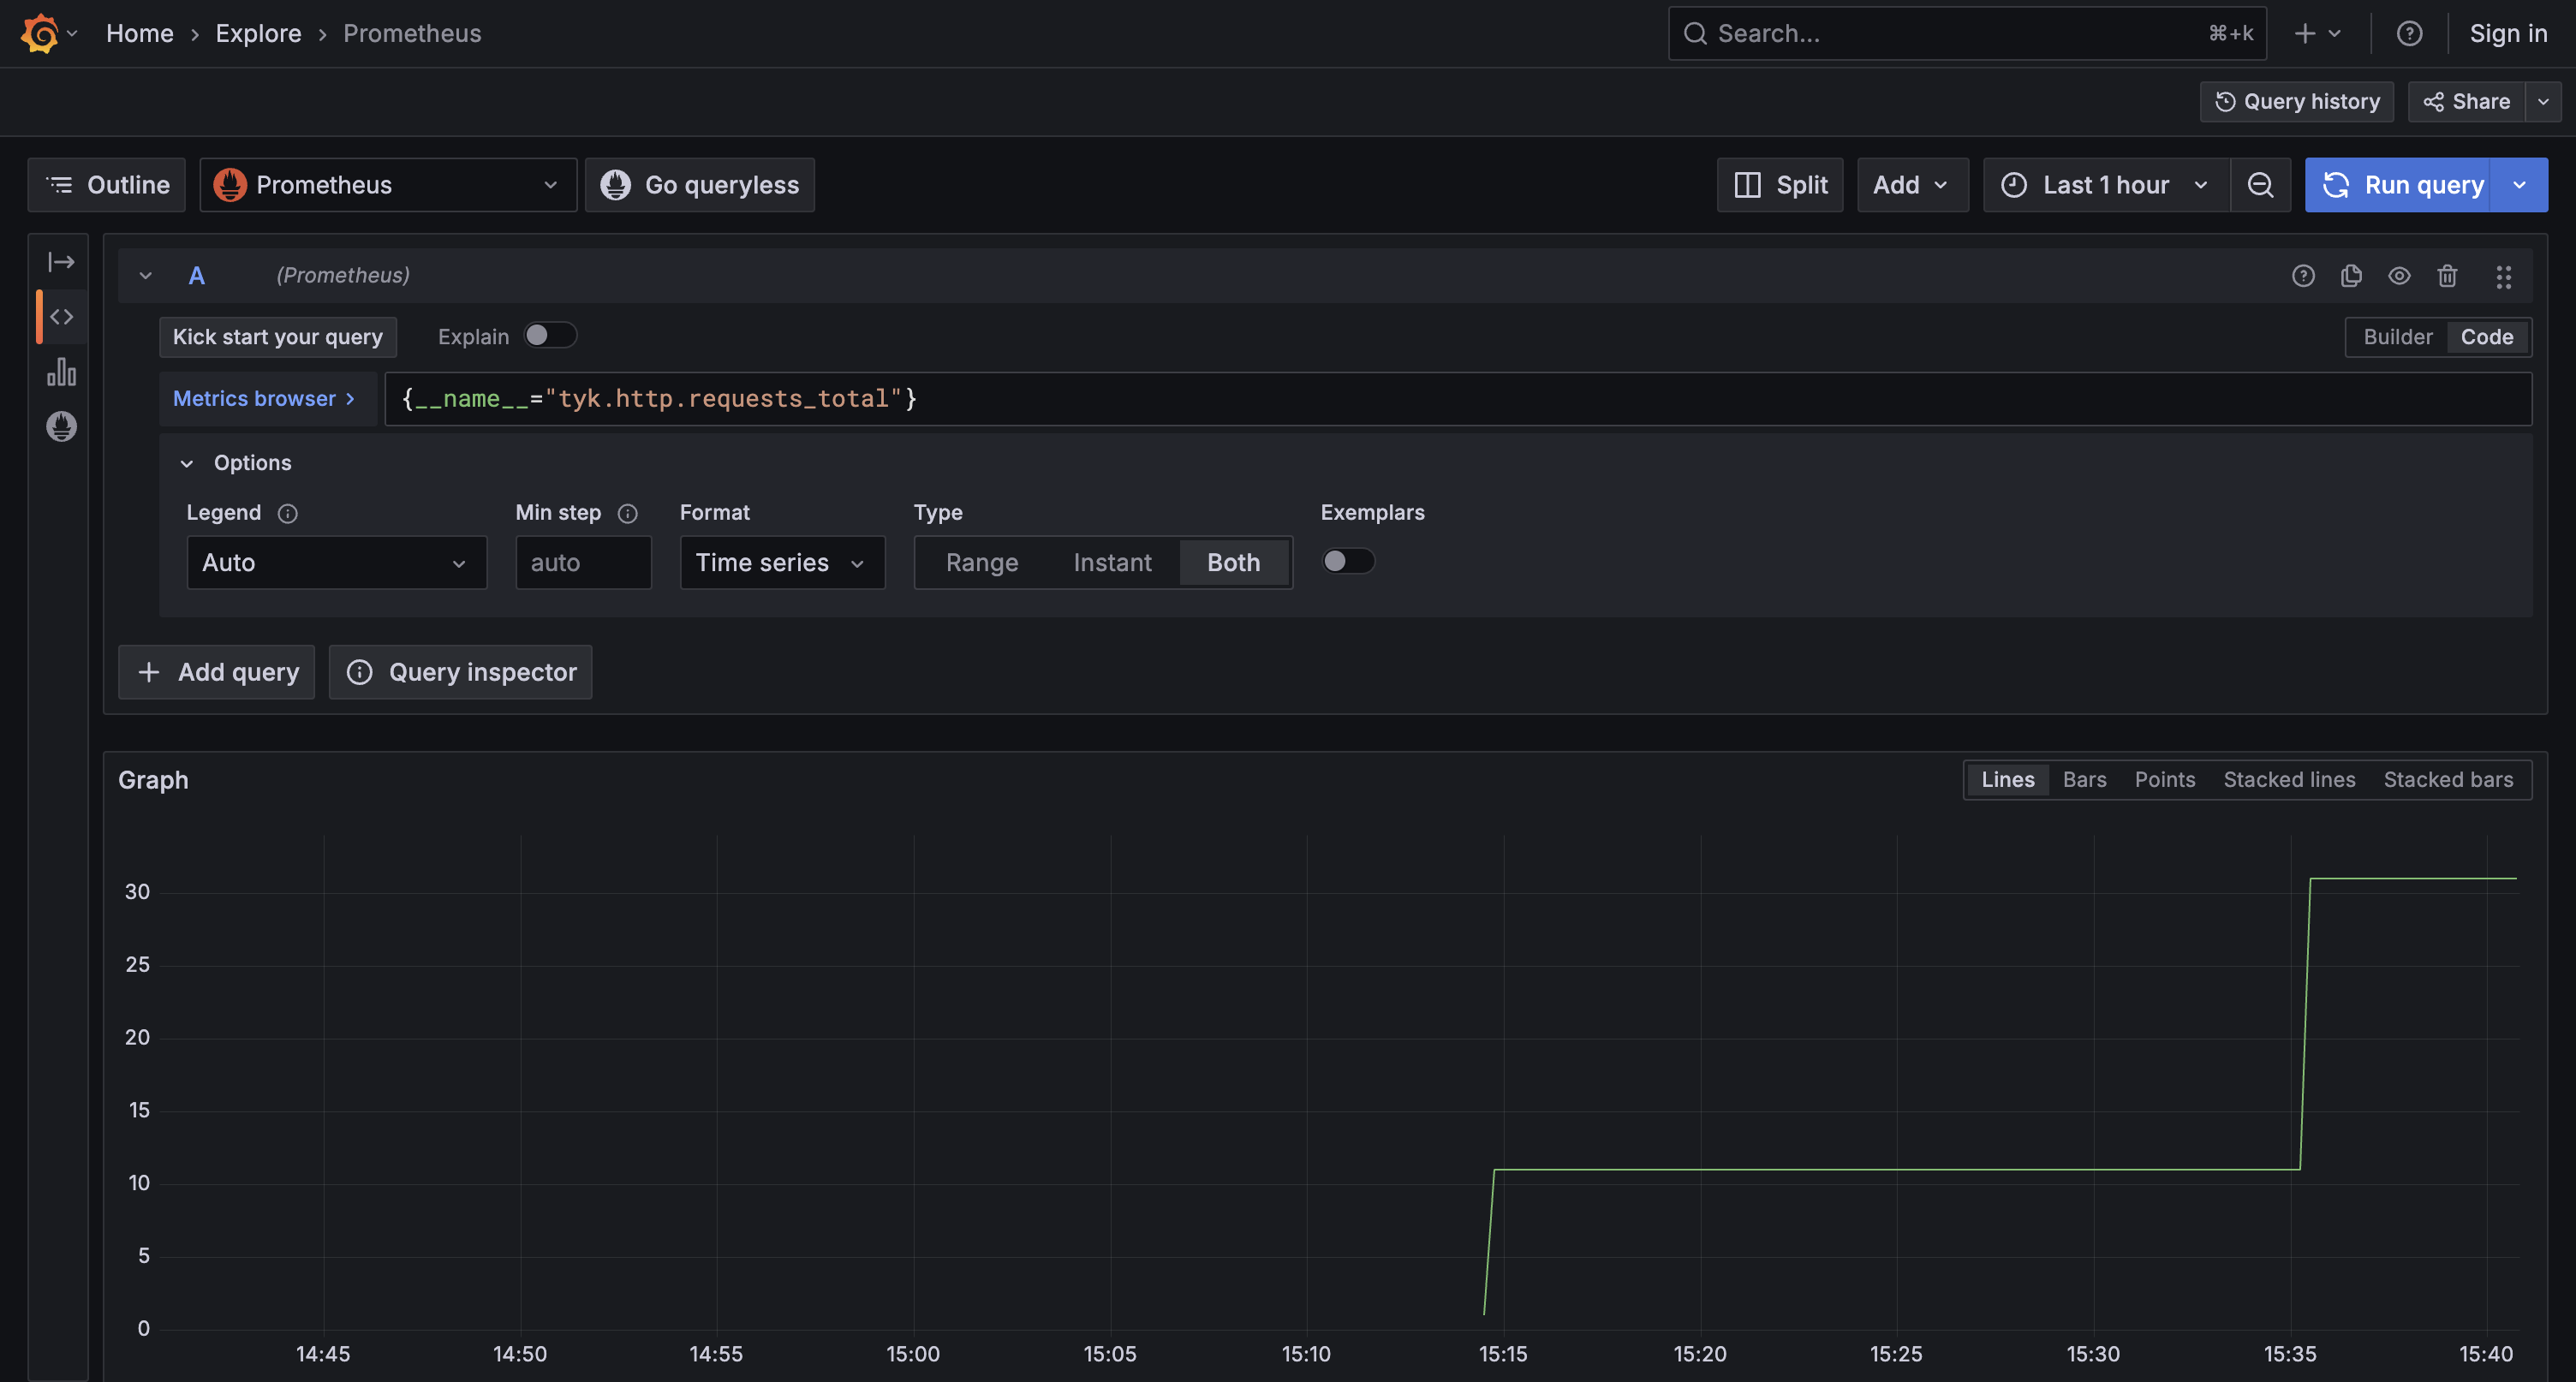
**Metrics**: in Explore, select the Prometheus datasource and run:
```promql theme={null}
{__name__="tyk.http.requests_total"}
```
You should see request counts rise as traffic flows through the Gateway.
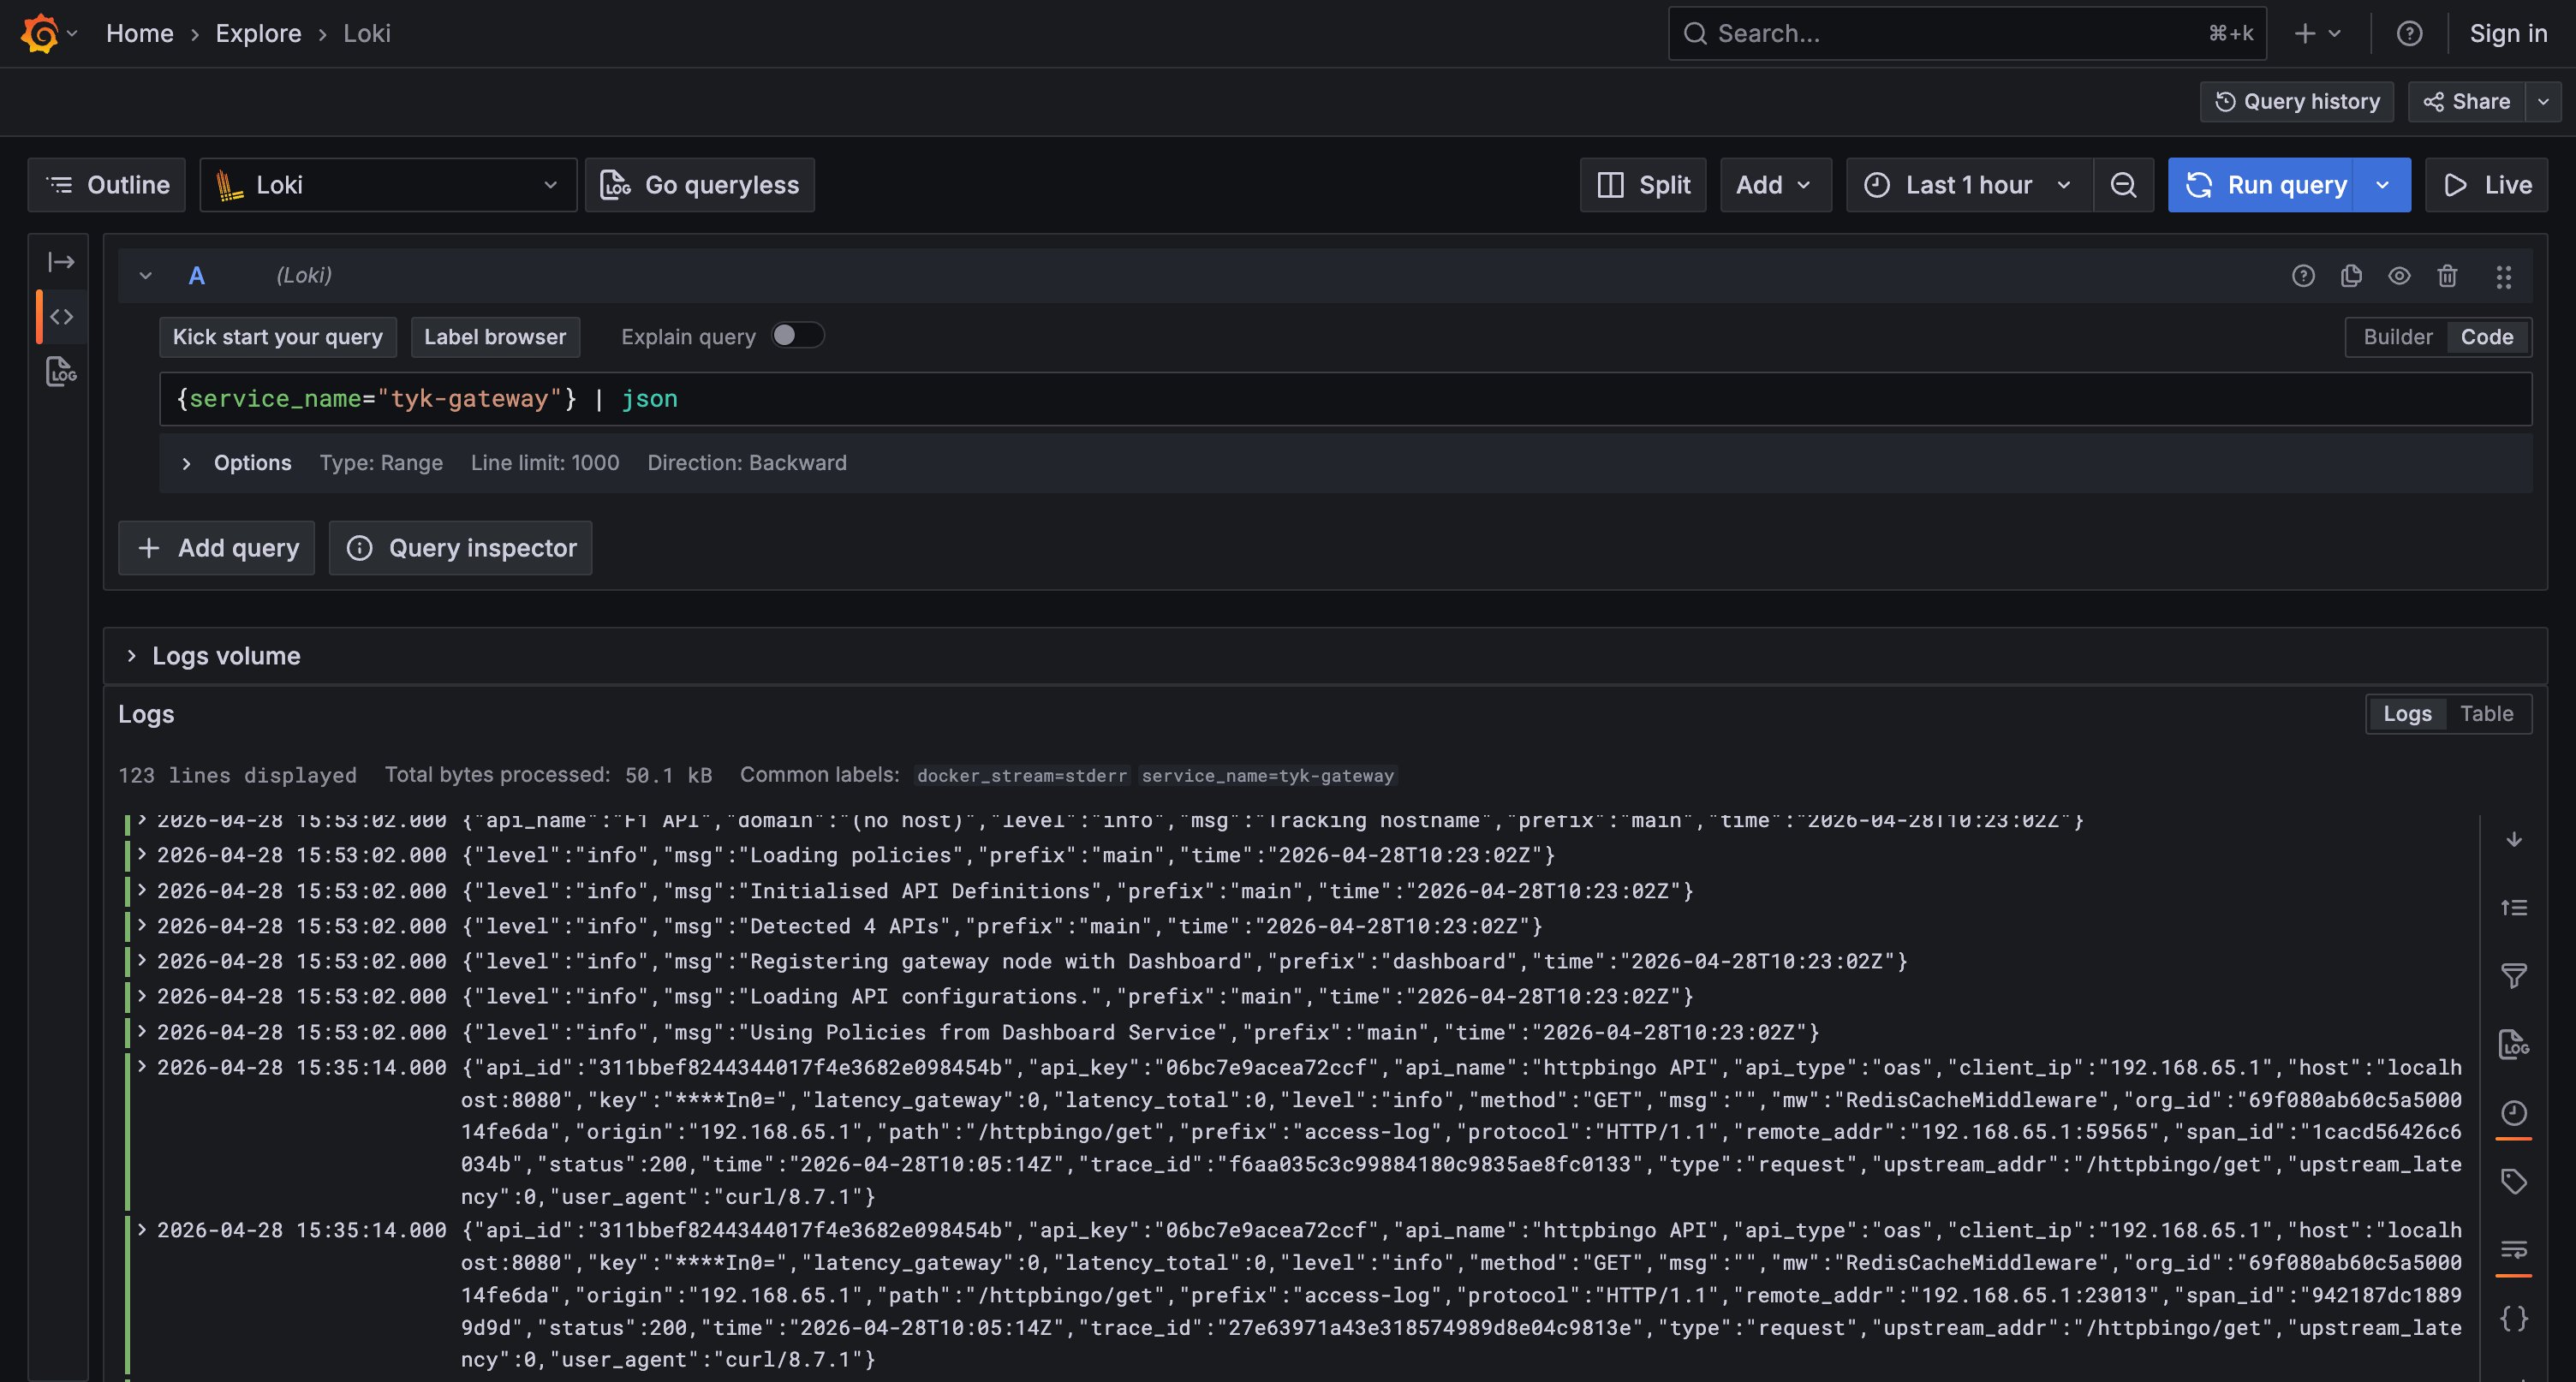
 **Logs**: in Explore, select the Loki datasource and run:
```logql theme={null}
{service_name="tyk-gateway"} | json
```
You should see structured access log entries with fields like `api_id`, `path`, `status`, `latency_total`, and `trace_id`.
**Logs**: in Explore, select the Loki datasource and run:
```logql theme={null}
{service_name="tyk-gateway"} | json
```
You should see structured access log entries with fields like `api_id`, `path`, `status`, `latency_total`, and `trace_id`.
 **Traces**: in Explore, select the Tempo datasource and search for recent traces. Each trace should show one span for the request.
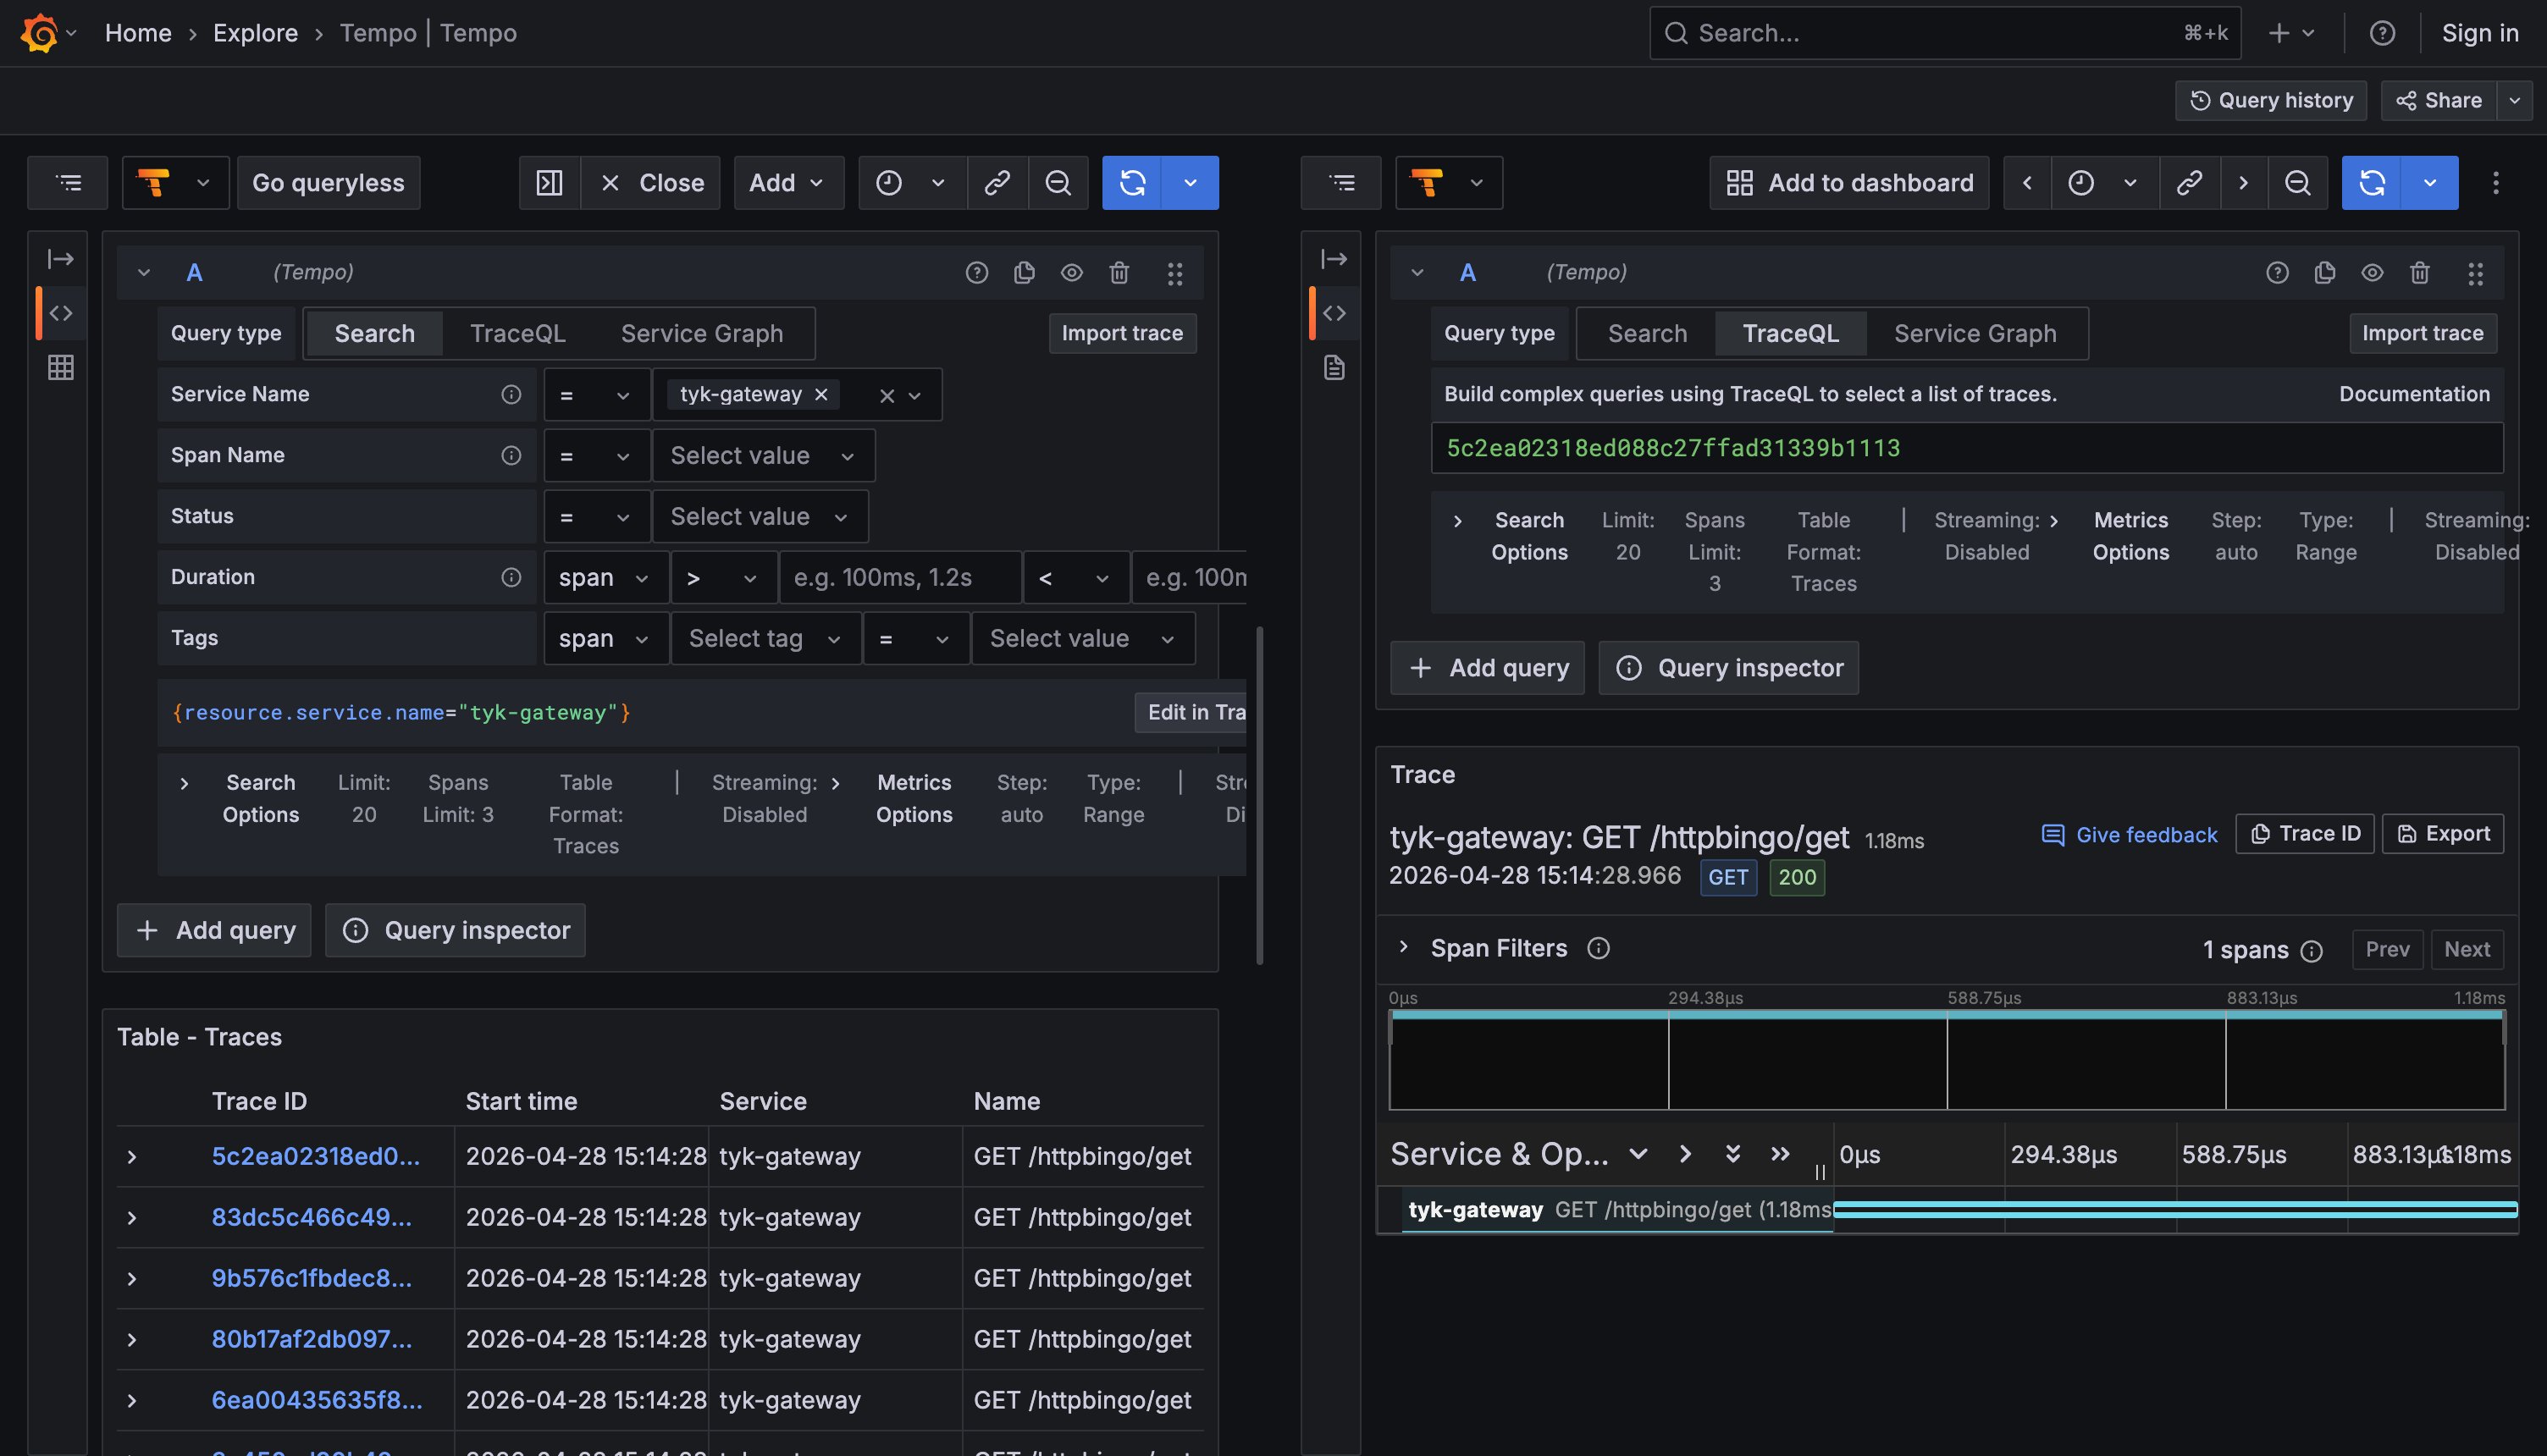 If traces are not appearing, verify that `TYK_GW_OPENTELEMETRY_TRACES_ENABLED=true` is set and that the Gateway can reach `otel-collector:4317`. Check the OTel Collector logs with `docker compose logs otel-collector` for any connection errors.
## Next steps
* **Explore default metrics**: see all Gateway metrics available out of the box in [Default Metrics](/api-management/logs-metrics)
* **Add custom metrics**: attach request headers, JWT claims, and response codes as metric dimensions using [Custom Metrics](/api-management/metrics/custom-metrics)
* **Kubernetes deployment**: for log collection in Kubernetes using the OTel Collector DaemonSet, see [Collecting Gateway Logs with OTel on Kubernetes](/api-management/collecting-gateway-logs-otel-kubernetes)
If traces are not appearing, verify that `TYK_GW_OPENTELEMETRY_TRACES_ENABLED=true` is set and that the Gateway can reach `otel-collector:4317`. Check the OTel Collector logs with `docker compose logs otel-collector` for any connection errors.
## Next steps
* **Explore default metrics**: see all Gateway metrics available out of the box in [Default Metrics](/api-management/logs-metrics)
* **Add custom metrics**: attach request headers, JWT claims, and response codes as metric dimensions using [Custom Metrics](/api-management/metrics/custom-metrics)
* **Kubernetes deployment**: for log collection in Kubernetes using the OTel Collector DaemonSet, see [Collecting Gateway Logs with OTel on Kubernetes](/api-management/collecting-gateway-logs-otel-kubernetes)