> ## Documentation Index
> Fetch the complete documentation index at: https://tyk.io/docs/llms.txt
> Use this file to discover all available pages before exploring further.
# Metrics Pumps (Legacy)
> Configure Tyk Pump to expose Prometheus, StatsD, or DogStatsD metrics derived from traffic logs.
For new deployments, we recommend [OpenTelemetry Metrics](/docs/api-management/logs-metrics#opentelemetry-metrics) instead: Tyk Gateway pushes Rate, Errors, and Duration (RED) metrics via an OpenTelemetry Collector. This page remains relevant for existing deployments already using Tyk Pump for metrics.
## Introduction
[Tyk Pump](/docs/api-management/tyk-pump) can independently expose metrics, derived from the traffic logs it reads out of Redis, the same traffic logs used for [Dashboard Analytics](/docs/api-management/dashboard-analytics). These metrics are computed by Tyk Pump after the fact from traffic log records, so it can only produce traffic-derived counters and histograms (status codes, latency, and whatever traffic log fields you tag). It has no visibility into Gateway's own runtime health or configuration state, unlike [OpenTelemetry metrics](/docs/api-management/metrics/default-metrics).
Three pump types expose metrics this way, all deriving from the same traffic log fields:
| Pump Type | Format |
| :------------------------------ | :------------------------------------------------------------------------ |
| [Prometheus](#prometheus) | Exposes an HTTP endpoint for Prometheus to scrape |
| [StatsD](#statsd) | Sends per-request metrics to a StatsD server |
| [DogStatsD](#dogstatsd-datadog) | Sends per-request metrics in the DogStatsD format, for example to Datadog |
Not to be confused with [Tyk Gateway's native StatsD instrumentation](/docs/api-management/logs-metrics#statsd-instrumentation): that's a completely different, built-in mechanism exporting internal system metrics (request rate, goroutine health, and so on), not traffic-log-derived request metrics. The [StatsD pump](#statsd) on this page is unrelated to that feature.
## Prometheus
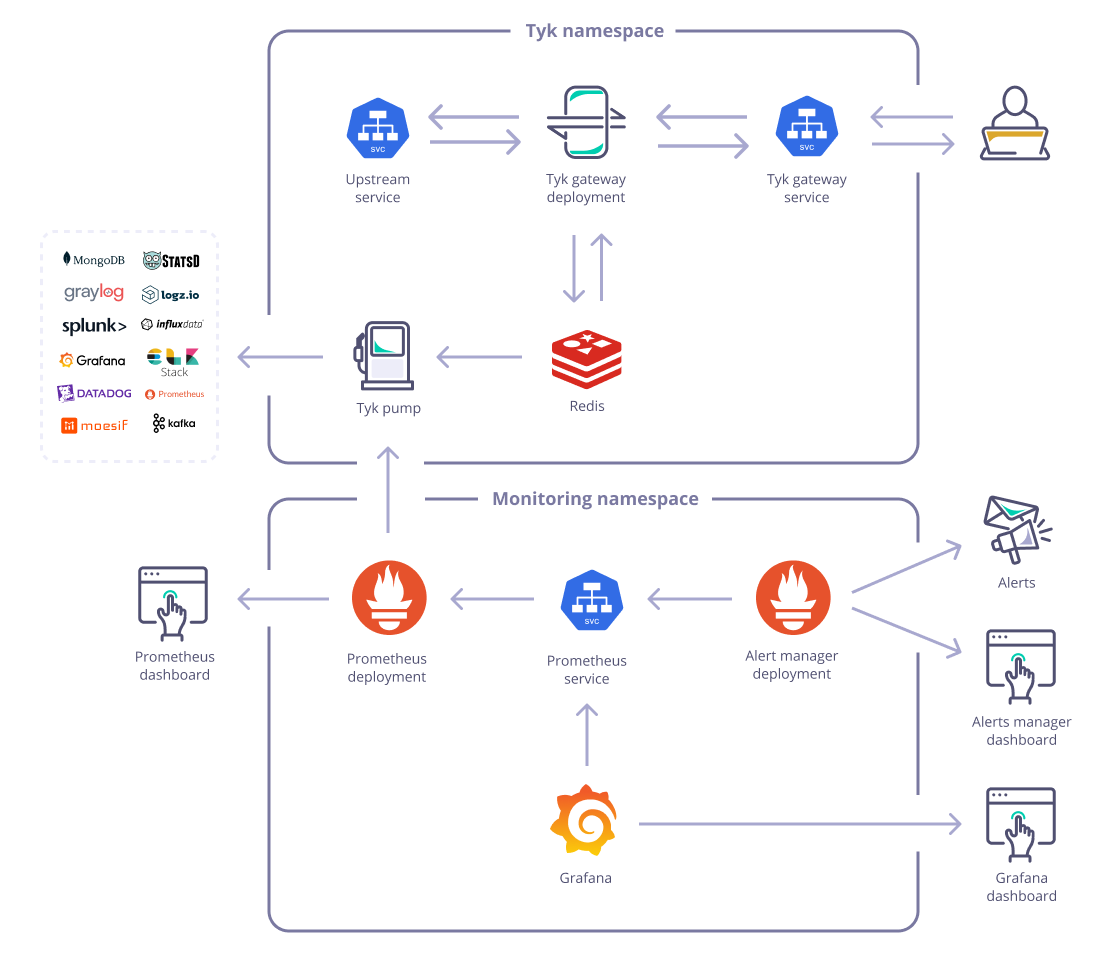
Tyk Pump can expose Prometheus metrics derived from the traffic logs it reads out of Redis, useful for tracking how often your APIs are called, how they perform, and what status codes they return. See the [demo project on GitHub](https://github.com/TykTechnologies/demo-slo-prometheus-grafana) for a working example.
Unlike the other pumps on this page, Tyk Pump doesn't send these metrics anywhere itself: it exposes them on a plain HTTP endpoint (`/metrics` by default), and Prometheus scrapes that endpoint on its own schedule.
This endpoint has no built-in authentication or TLS: anyone who can reach it can read all your metrics. That's more than a data-exposure risk: request rates, status codes, and latency broken down per API give an attacker a detailed map of your system's architecture, traffic patterns, and likely weak points, valuable reconnaissance for an attack. Restrict access at the network level, for example with firewall rules or security groups, rather than relying on Tyk Pump to secure it.
### Base Metrics
By default, the `prometheus` pump exposes these metrics:
| Metric | Type | Labels | Description |
| :--------------------------------- | :-------- | :------------------------------ | :---------------------------------------------------------------------------------------- |
| `tyk_http_status` | Counter | `code`, `api` | HTTP status codes per API. |
| `tyk_http_status_per_path` | Counter | `code`, `api`, `path`, `method` | HTTP status codes per API path and method. |
| `tyk_http_status_per_key` | Counter | `code`, `key` | HTTP status codes per access key. |
| `tyk_http_status_per_oauth_client` | Counter | `code`, `client_id` | HTTP status codes per OAuth client. |
| `tyk_latency` | Histogram | `type`, `api` | Latency added by Tyk, per API. `type` distinguishes total, upstream, and gateway latency. |
You can add further custom metrics of your own; see [Custom Metrics](#custom-metrics) below.
### Configuring the Pump
In addition to the [common pump settings](/docs/api-management/tyk-pump#common-pump-settings), the `prometheus` pump accepts the following `meta` fields. Add them to `pump.conf`:
```json theme={null}
{
"pumps": {
"prometheus": {
"type": "prometheus",
"meta": {
"listen_address": ":9090",
"path": "/metrics",
"custom_metrics": [],
"disabled_metrics": []
},
...
}
}
}
```
| Field | Default | Description |
| :----------------- | :--------- | :------------------------------------------------------------------------------------------------------------------------------------------------------------------------------------------------------ |
| `listen_address` | - | Bind address for the metrics endpoint, in Go's `host:port` format. Use `:9090` to listen on all interfaces; add a host, for example `127.0.0.1:9090`, only if you want to restrict it to one interface. |
| `path` | `/metrics` | HTTP path Prometheus scrapes. |
| `custom_metrics` | (none) | Additional counters and histograms, on top of the [base metrics](#base-metrics) above. See [Custom Metrics](#custom-metrics) below. |
| `disabled_metrics` | (none) | Base metric families to remove. |
Tyk Pump will listen on the port configured in `listen_address`. The Prometheus scraper must be configured to access that port on the Tyk Pump service. You must ensure that the port is exposed for the scraper to find.
Restart Tyk Pump, then verify metrics are exposed by visiting `http://:9090/metrics` from a machine that can reach it. Then add a scrape target to your [Prometheus configuration](https://prometheus.io/docs/prometheus/latest/configuration/configuration/) pointing at that same host and port, and connect a [Grafana data source](https://grafana.com/docs/grafana/latest/datasources/add-a-data-source/) to your Prometheus server. See the [Tyk Pump GitHub repository](https://github.com/TykTechnologies/tyk-pump#prometheus) for example dashboard queries, including request rate, error rate, and percentile latency, per API or across all APIs.
### Custom Metrics
The base metrics above cover a fixed set of dimensions. You can define your own counters and histograms instead, built from any traffic log fields you choose as labels, for example, you could break down requests by a custom aggregation tag or API alias that the base metrics don't expose.
Add custom metrics to your Prometheus pump using the `custom_metrics` object in the pump `meta`:
```json theme={null}
"custom_metrics": [
{
"name": "tyk_http_requests_total",
"description": "Total of API requests",
"metric_type": "counter",
"labels": ["response_code", "api_name", "method", "api_key", "alias", "path"]
},
{
"name": "tyk_http_latency",
"description": "Latency of API requests",
"metric_type": "histogram",
"labels": ["type", "response_code", "api_name", "method", "api_key", "alias", "path"],
"buckets": [1, 5, 10, 50, 100, 500, 1000, 5000, 10000]
}
],
```
Each entry accepts:
| Field | Default | Description |
| :------------ | :------------------------------------------------------------------------------------------------------------------------- | :------------------------------------------------------------------------------------------------------------------------------------------------------------------------------------------------------------------------------------- |
| `name` | - | Metric name. |
| `description` | - | Metric description. |
| `metric_type` | - | `counter` or `histogram`. Histograms always observe the `request_time` field. |
| `labels` | - | Traffic log fields to expose as metric labels. Available values: `host`, `method`, `path`, `response_code`, `api_key`, `time_stamp`, `api_version`, `api_name`, `api_id`, `org_id`, `oauth_id`, `request_time`, `ip_address`, `alias`. |
| `buckets` | `[1, 2, 5, 7, 10, 15, 20, 25, 30, 40, 50, 60, 70, 80, 90, 100, 200, 300, 400, 500, 1000, 2000, 5000, 10000, 30000, 60000]` | Histogram bucket boundaries, in milliseconds. Histograms only. |
### Docker
If `listen_address` is set to `:9090`, make sure to publish port 9090 in addition to the health check port.
For example, in Docker Compose:
```yaml theme={null}
tyk-pump:
image: tykio/tyk-pump-docker-pub:${PUMP_VERSION}
ports:
- 8083:8083
- 9090:9090
```
### Kubernetes
Tyk Pump's Prometheus endpoint can be scraped on Kubernetes using either of the standard Prometheus discovery mechanisms:
* **Prometheus Operator**: if enabled on your cluster (for example via the [kube-prometheus-stack](https://github.com/prometheus-community/helm-charts/tree/main/charts/kube-prometheus-stack) chart), it looks for `PodMonitor` or `ServiceMonitor` resources and scrapes the specified port automatically. Enable this with `tyk-pump.pump.prometheusPump.prometheusOperator.enabled=true` on the [Tyk OSS Helm chart](/docs/product-stack/tyk-charts/tyk-oss-chart).
* **Pod annotations**: if your Prometheus deployment scrapes pods by annotation instead, for example using the [prometheus-community/prometheus](https://github.com/prometheus-community/helm-charts/tree/main/charts/prometheus#scraping-pod-metrics-via-annotations) chart, set matching `prometheus.io/scrape`, `prometheus.io/path`, and `prometheus.io/port` annotations via `tyk-pump.pump.podAnnotations`.
Either way, Tyk Pump must also be exposed as a Kubernetes service so Prometheus can reach `/metrics`: set `tyk-pump.pump.service.enabled: true`.
 ## StatsD
[StatsD](https://github.com/etsy/statsd) is a network daemon that listens for statistics sent over UDP or TCP and forwards aggregates to pluggable backend services. The `statsd` pump sends per-request metrics to a StatsD server this way, derived from the same traffic logs as the other pumps on this page.
In addition to the [common pump settings](/docs/api-management/tyk-pump#common-pump-settings), the `statsd` pump accepts the following `meta` fields:
```json theme={null}
{
"pumps": {
"statsd": {
"type": "statsd",
"meta": {
"address": "localhost:8125",
"fields": ["request_time"],
"tags": ["path", "response_code", "api_key", "api_version", "api_name", "api_id", "raw_request", "ip_address", "org_id", "oauth_id"],
"separated_method": false
},
...
}
}
}
```
| Field | Default | Description |
| :----------------- | :------ | :---------------------------------------------------------------------------------------------------------------------------------- |
| `address` | - | StatsD server host and port. |
| `fields` | - | Traffic log fields sent as timing values. Accepts `request_time`, `latency_total`, `latency_upstream`, and `latency_gateway`. |
| `tags` | - | Traffic log fields sent as tags. |
| `separated_method` | `false` | By default, the method and path are combined into a single path field. Set to `true` to record the method in its own field instead. |
## DogStatsD (Datadog)
Tyk Pump can send API traffic analytics to [Datadog](https://www.datadoghq.com/), which you can use to build [dashboards](https://docs.datadoghq.com/integrations/tyk/#dashboards) from your API traffic.
**Prerequisites:**
* A working Datadog agent. See the [Datadog Tyk integration documentation](https://docs.datadoghq.com/integrations/tyk/).
* A [Tyk Self-Managed](/docs/tyk-self-managed/install) or [Tyk Open Source](/docs/apim/open-source/installation) installation with [Tyk Pump](/docs/api-management/tyk-pump) configured.
**How it works:** when running the Datadog Agent, the `dogstatsd` pump sends the [request\_time](https://docs.datadoghq.com/integrations/tyk/#data-collected) metric from Tyk Pump in real time, per request, so you can aggregate by API, version, response code, method, and other parameters.
In addition to the [common pump settings](/docs/api-management/tyk-pump#common-pump-settings), the `dogstatsd` pump accepts the following `meta` fields:
```json theme={null}
{
"pumps": {
"dogstatsd": {
"type": "dogstatsd",
"meta": {
"address": "dd-agent:8126",
"namespace": "tyk",
"async_uds": true,
"async_uds_write_timeout_seconds": 2,
"buffered": true,
"buffered_max_messages": 32,
"sample_rate": 0.9999999999,
"tags": ["method", "response_code", "api_version", "api_name", "api_id", "org_id", "tracked", "path", "oauth_id"]
},
...
}
}
}
```
| Field | Default | Description |
| :-------------------------------- | :------------------------------------------------------------------------------------------------------ | :--------------------------------------------------------------------------------------------- |
| `address` | - | Datadog agent host and port. |
| `namespace` | - | Prefix applied to metrics sent to Datadog. |
| `async_uds` | `false` | Enable async [UDS over UDP](https://github.com/Datadog/datadog-go#unix-domain-sockets-client). |
| `async_uds_write_timeout_seconds` | - | Write timeout in seconds if `async_uds: true`. |
| `buffered` | `false` | Enable buffering of messages. |
| `buffered_max_messages` | `16` | Maximum messages per datagram if `buffered: true`. |
| `sample_rate` | `1` | Fraction of requests to sample; `1` is 100%, `0.5` samples 50%. |
| `tags` | `path`, `method`, `response_code`, `api_version`, `api_name`, `api_id`, `org_id`, `tracked`, `oauth_id` | Traffic log fields sent as tags. |
Including `path` as a tag can generate significant cardinality, since it's unbounded.
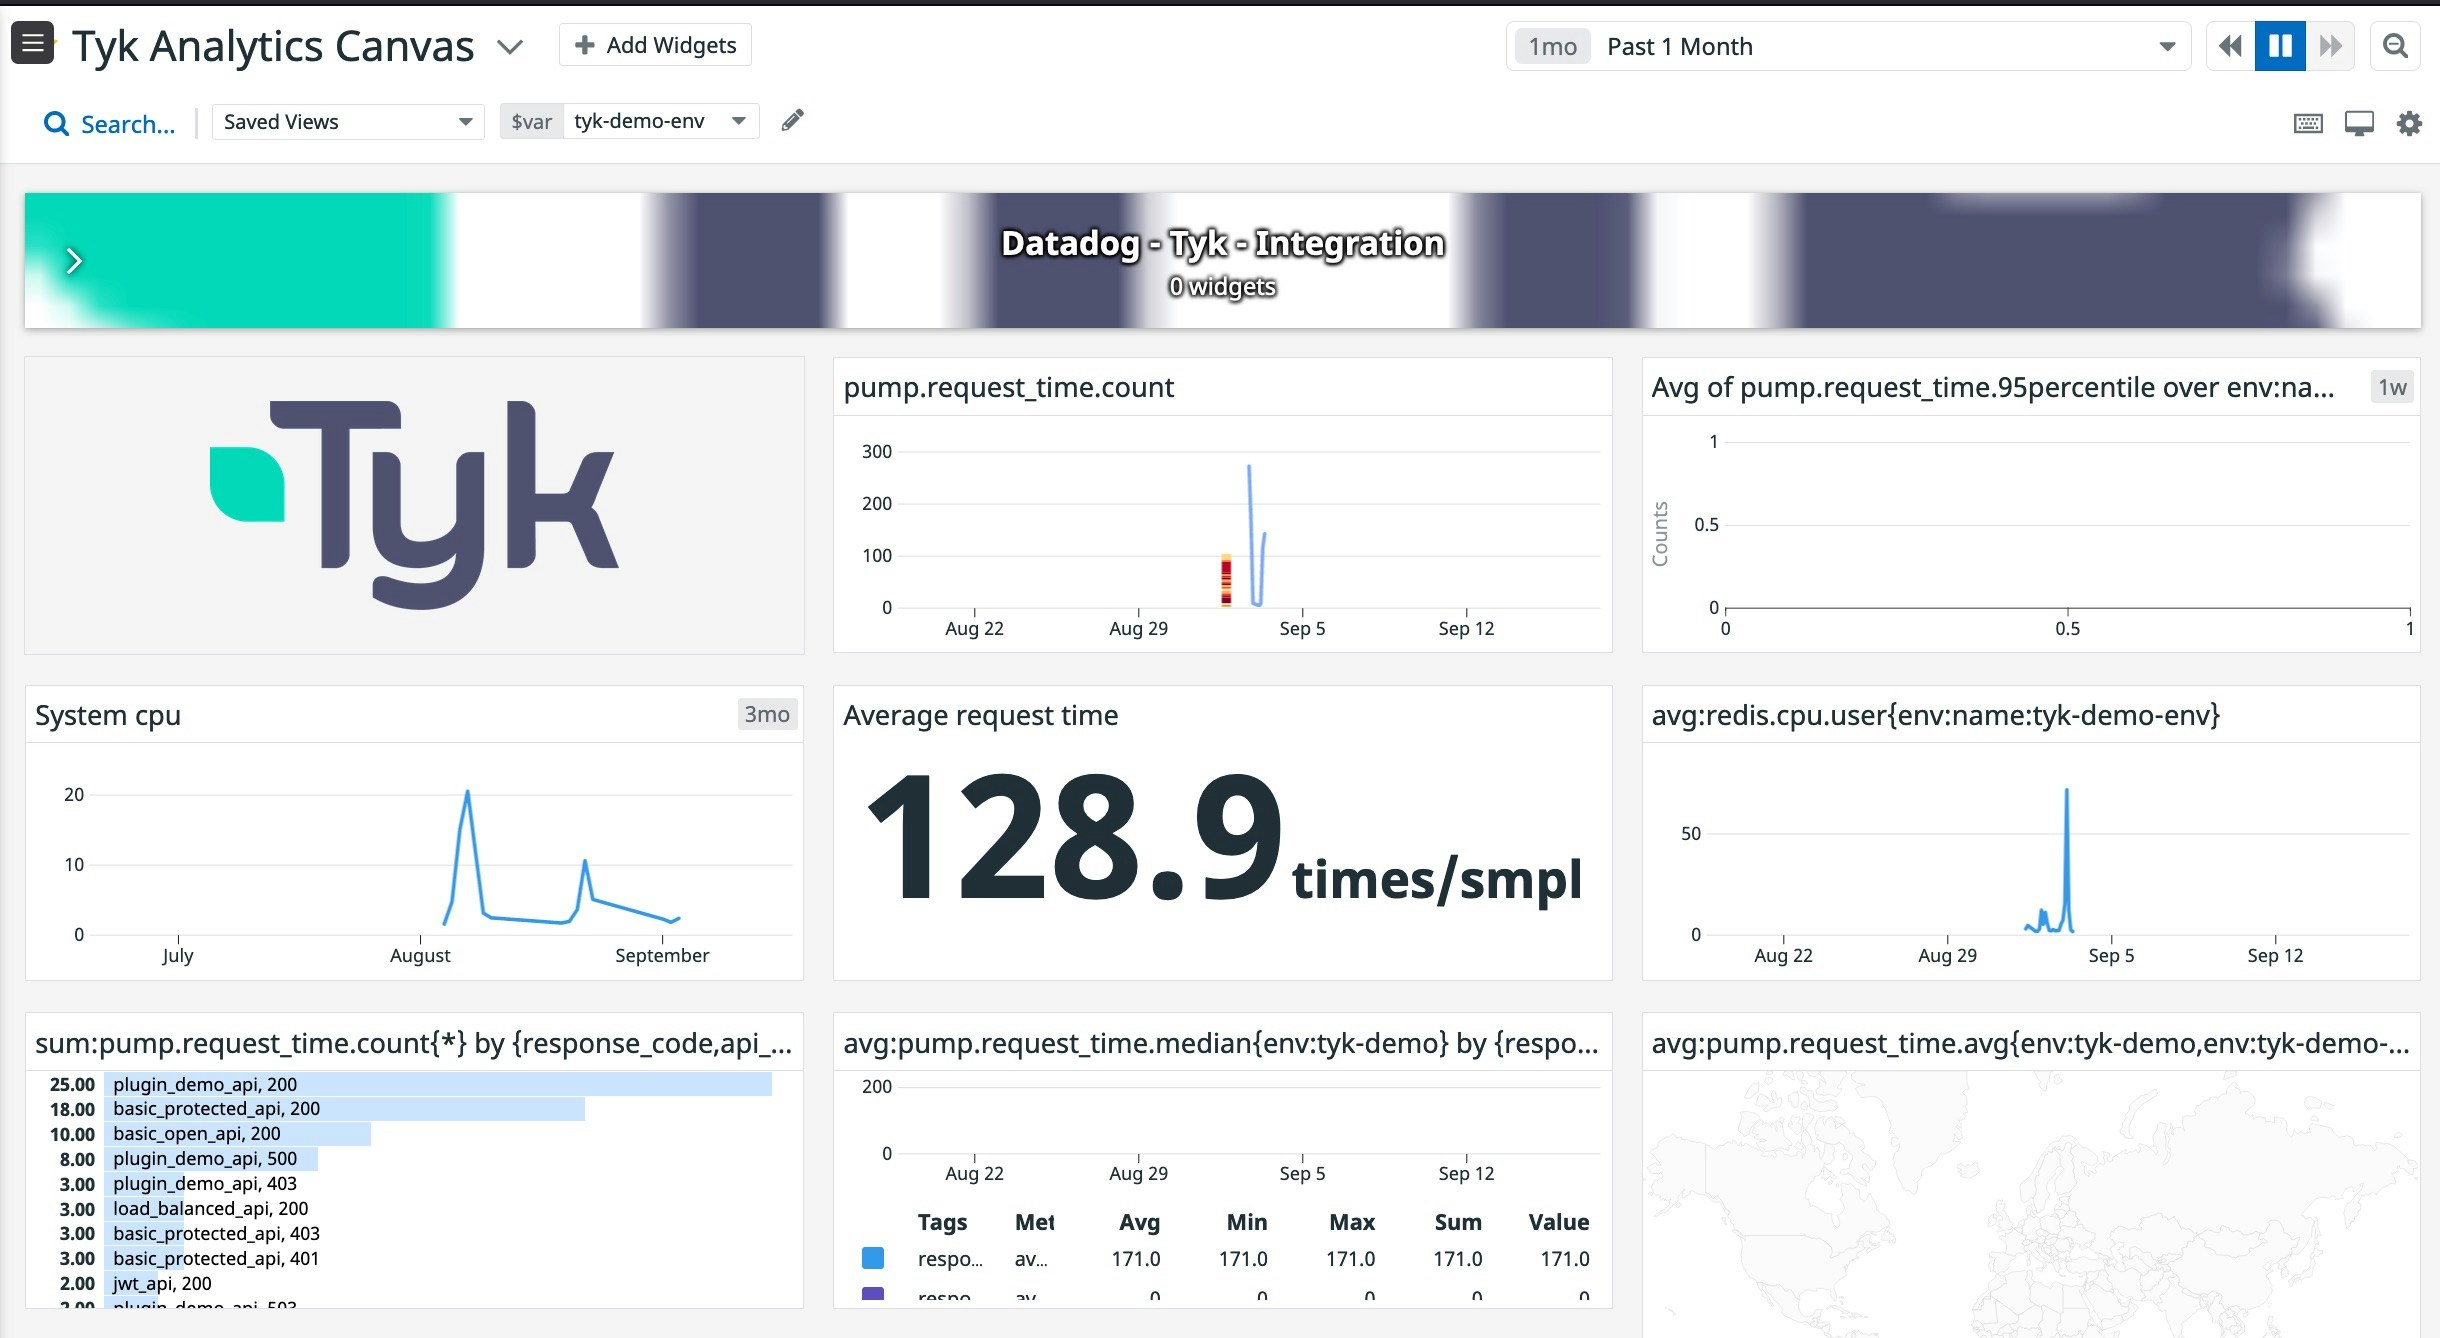
Tyk maintains a default Datadog dashboard canvas to give you an easier starting point. In the Datadog portal, under [Dashboards → Lists](https://app.datadoghq.com/dashboard/lists), it's named **Tyk Analytics Canvas**. To use it, ensure your Datadog agent deployment has the tag `env:tyk-demo-env` and that `dogstatsd.meta.namespace` is set to `pump`. You can also import it from the [Datadog integrations-extras repository](https://github.com/DataDog/integrations-extras/blob/master/tyk/assets/dashboards/tyk_analytics_canvas.json) and adjust those values to match your own setup.
## StatsD
[StatsD](https://github.com/etsy/statsd) is a network daemon that listens for statistics sent over UDP or TCP and forwards aggregates to pluggable backend services. The `statsd` pump sends per-request metrics to a StatsD server this way, derived from the same traffic logs as the other pumps on this page.
In addition to the [common pump settings](/docs/api-management/tyk-pump#common-pump-settings), the `statsd` pump accepts the following `meta` fields:
```json theme={null}
{
"pumps": {
"statsd": {
"type": "statsd",
"meta": {
"address": "localhost:8125",
"fields": ["request_time"],
"tags": ["path", "response_code", "api_key", "api_version", "api_name", "api_id", "raw_request", "ip_address", "org_id", "oauth_id"],
"separated_method": false
},
...
}
}
}
```
| Field | Default | Description |
| :----------------- | :------ | :---------------------------------------------------------------------------------------------------------------------------------- |
| `address` | - | StatsD server host and port. |
| `fields` | - | Traffic log fields sent as timing values. Accepts `request_time`, `latency_total`, `latency_upstream`, and `latency_gateway`. |
| `tags` | - | Traffic log fields sent as tags. |
| `separated_method` | `false` | By default, the method and path are combined into a single path field. Set to `true` to record the method in its own field instead. |
## DogStatsD (Datadog)
Tyk Pump can send API traffic analytics to [Datadog](https://www.datadoghq.com/), which you can use to build [dashboards](https://docs.datadoghq.com/integrations/tyk/#dashboards) from your API traffic.
**Prerequisites:**
* A working Datadog agent. See the [Datadog Tyk integration documentation](https://docs.datadoghq.com/integrations/tyk/).
* A [Tyk Self-Managed](/docs/tyk-self-managed/install) or [Tyk Open Source](/docs/apim/open-source/installation) installation with [Tyk Pump](/docs/api-management/tyk-pump) configured.
**How it works:** when running the Datadog Agent, the `dogstatsd` pump sends the [request\_time](https://docs.datadoghq.com/integrations/tyk/#data-collected) metric from Tyk Pump in real time, per request, so you can aggregate by API, version, response code, method, and other parameters.
In addition to the [common pump settings](/docs/api-management/tyk-pump#common-pump-settings), the `dogstatsd` pump accepts the following `meta` fields:
```json theme={null}
{
"pumps": {
"dogstatsd": {
"type": "dogstatsd",
"meta": {
"address": "dd-agent:8126",
"namespace": "tyk",
"async_uds": true,
"async_uds_write_timeout_seconds": 2,
"buffered": true,
"buffered_max_messages": 32,
"sample_rate": 0.9999999999,
"tags": ["method", "response_code", "api_version", "api_name", "api_id", "org_id", "tracked", "path", "oauth_id"]
},
...
}
}
}
```
| Field | Default | Description |
| :-------------------------------- | :------------------------------------------------------------------------------------------------------ | :--------------------------------------------------------------------------------------------- |
| `address` | - | Datadog agent host and port. |
| `namespace` | - | Prefix applied to metrics sent to Datadog. |
| `async_uds` | `false` | Enable async [UDS over UDP](https://github.com/Datadog/datadog-go#unix-domain-sockets-client). |
| `async_uds_write_timeout_seconds` | - | Write timeout in seconds if `async_uds: true`. |
| `buffered` | `false` | Enable buffering of messages. |
| `buffered_max_messages` | `16` | Maximum messages per datagram if `buffered: true`. |
| `sample_rate` | `1` | Fraction of requests to sample; `1` is 100%, `0.5` samples 50%. |
| `tags` | `path`, `method`, `response_code`, `api_version`, `api_name`, `api_id`, `org_id`, `tracked`, `oauth_id` | Traffic log fields sent as tags. |
Including `path` as a tag can generate significant cardinality, since it's unbounded.
Tyk maintains a default Datadog dashboard canvas to give you an easier starting point. In the Datadog portal, under [Dashboards → Lists](https://app.datadoghq.com/dashboard/lists), it's named **Tyk Analytics Canvas**. To use it, ensure your Datadog agent deployment has the tag `env:tyk-demo-env` and that `dogstatsd.meta.namespace` is set to `pump`. You can also import it from the [Datadog integrations-extras repository](https://github.com/DataDog/integrations-extras/blob/master/tyk/assets/dashboards/tyk_analytics_canvas.json) and adjust those values to match your own setup.