> ## Documentation Index
> Fetch the complete documentation index at: https://tyk.io/docs/llms.txt
> Use this file to discover all available pages before exploring further.
# MCP Analytics
> Using Tyk Dashboard's Activity by MCP page to monitor traffic and errors across your MCP proxies and their tools, resources, and prompts.
MCP analytics gives you visibility into how your MCP proxies and their primitives are being used, directly in Tyk Dashboard. Analytics are organized at two levels: **proxy-level charts** compare traffic and errors across your MCP proxies, giving you a fleet-wide view; **primitive-level charts** break the data down by individual tool, resource, or prompt, showing exactly what agents are calling and where failures are concentrated. Use the filter bar to scope the view to a specific proxy, primitive type, or time window.
This page is populated by [Tyk Pump](/docs/api-management/tyk-pump#dashboard-analytics-pumps), through one of two paths depending on your deployment topology. In a combined control and data plane, the `mongo-mcp-aggregate`/`sql-mcp-aggregate` pump types feed this page directly; see the [Mongo MCP Aggregate Pump](/docs/api-management/dashboard-analytics/control-plane-pumps#mongo-mcp-aggregate-pump) and [SQL MCP Aggregate Pump](/docs/api-management/dashboard-analytics/control-plane-pumps#sql-mcp-aggregate-pump) sections of Control Plane Pumps for installation and configuration. In a distributed deployment with Tyk MDCB, the Hybrid Pump has its own dedicated path; see [MCP Proxy Traffic](/docs/api-management/dashboard-analytics/data-plane-pump#mcp-proxy-traffic) for how to configure it. Either way, the `mongo-mcp`/`sql-mcp` pumps store MCP traffic logs for your own downstream querying, but don't feed this page.
To access the MCP analytics page, your Tyk Dashboard user account must have both `analytics` and `mcp` permissions.
## Navigating to MCP Analytics
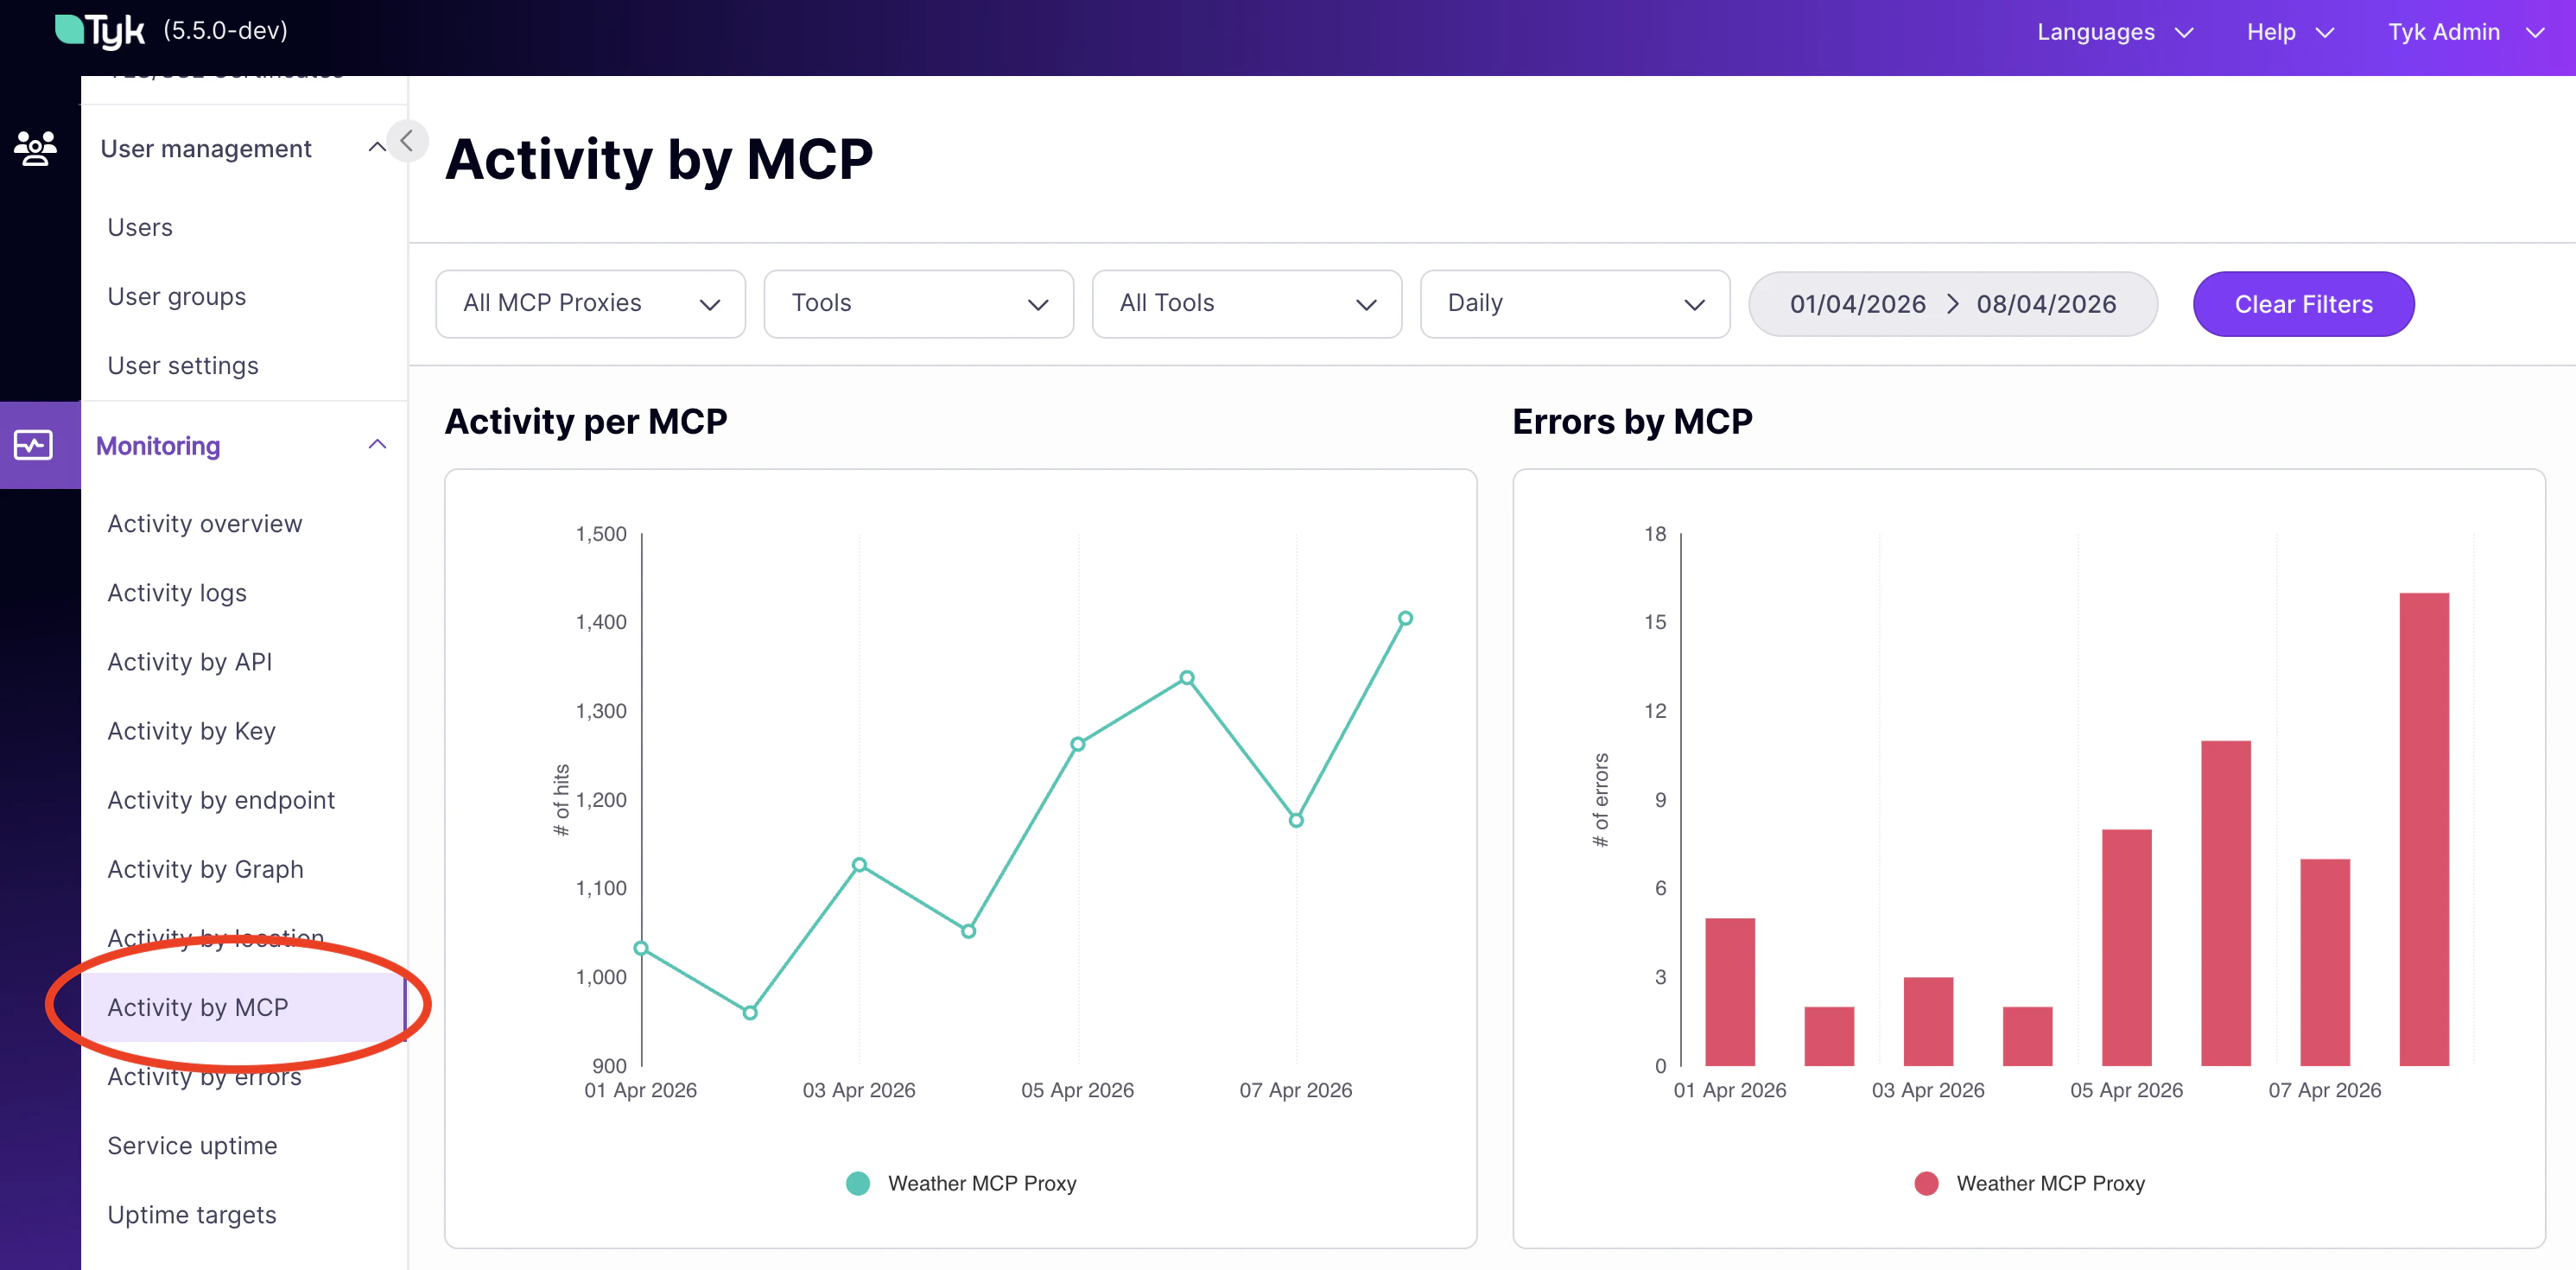
In the Tyk Dashboard, go to **Monitoring** in the sidebar and select **Activity by MCP**.
 ## Filters
The filter bar at the top of the page applies to all charts simultaneously. Changing a filter refreshes every chart on the page.
## Filters
The filter bar at the top of the page applies to all charts simultaneously. Changing a filter refreshes every chart on the page.
 | Filter | Description |
| ------------------ | --------------------------------------------------------------------------------------- |
| **MCP Proxy** | Restricts all charts to a single MCP proxy. Defaults to all proxies. |
| **Primitive Type** | Filters by primitive type: **Tools**, **Resources**, or **Prompts**. |
| **Primitive Name** | Filters by a specific primitive name within the selected type. The field is searchable. |
| **Resolution** | Sets the time bucket for chart data: **Hourly**, **Daily**, or **Monthly**. |
| **Date range** | Sets the time window for all chart data, in `dd/MM/yyyy` format. |
When **Primitive Type** is changed, the **Primitive Name** filter resets to show all primitives of the new type.
## Proxy-Level Charts
The charts in this section aggregate activity at the proxy level. Use them to compare traffic and error rates across your MCP proxies and identify which ones need attention.
### Activity per MCP
A line chart showing hit count over time, with one line per MCP proxy. Use this chart to compare traffic volumes across proxies and identify usage trends. A proxy with disproportionately high traffic is a good candidate for tighter rate limits; a sudden spike may indicate a misbehaving client.
| Filter | Description |
| ------------------ | --------------------------------------------------------------------------------------- |
| **MCP Proxy** | Restricts all charts to a single MCP proxy. Defaults to all proxies. |
| **Primitive Type** | Filters by primitive type: **Tools**, **Resources**, or **Prompts**. |
| **Primitive Name** | Filters by a specific primitive name within the selected type. The field is searchable. |
| **Resolution** | Sets the time bucket for chart data: **Hourly**, **Daily**, or **Monthly**. |
| **Date range** | Sets the time window for all chart data, in `dd/MM/yyyy` format. |
When **Primitive Type** is changed, the **Primitive Name** filter resets to show all primitives of the new type.
## Proxy-Level Charts
The charts in this section aggregate activity at the proxy level. Use them to compare traffic and error rates across your MCP proxies and identify which ones need attention.
### Activity per MCP
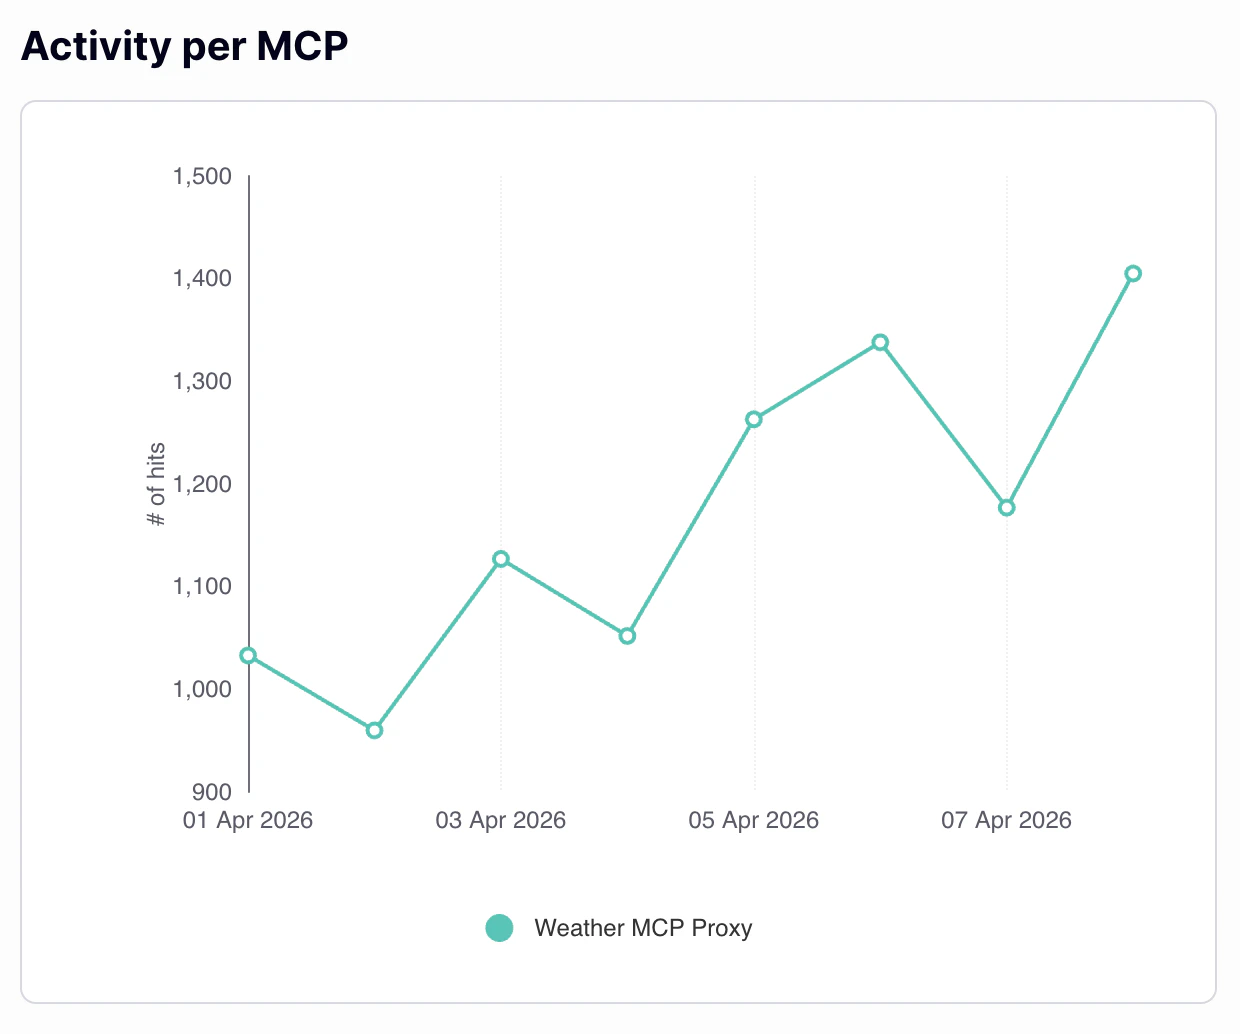
A line chart showing hit count over time, with one line per MCP proxy. Use this chart to compare traffic volumes across proxies and identify usage trends. A proxy with disproportionately high traffic is a good candidate for tighter rate limits; a sudden spike may indicate a misbehaving client.
 ### Errors by MCP
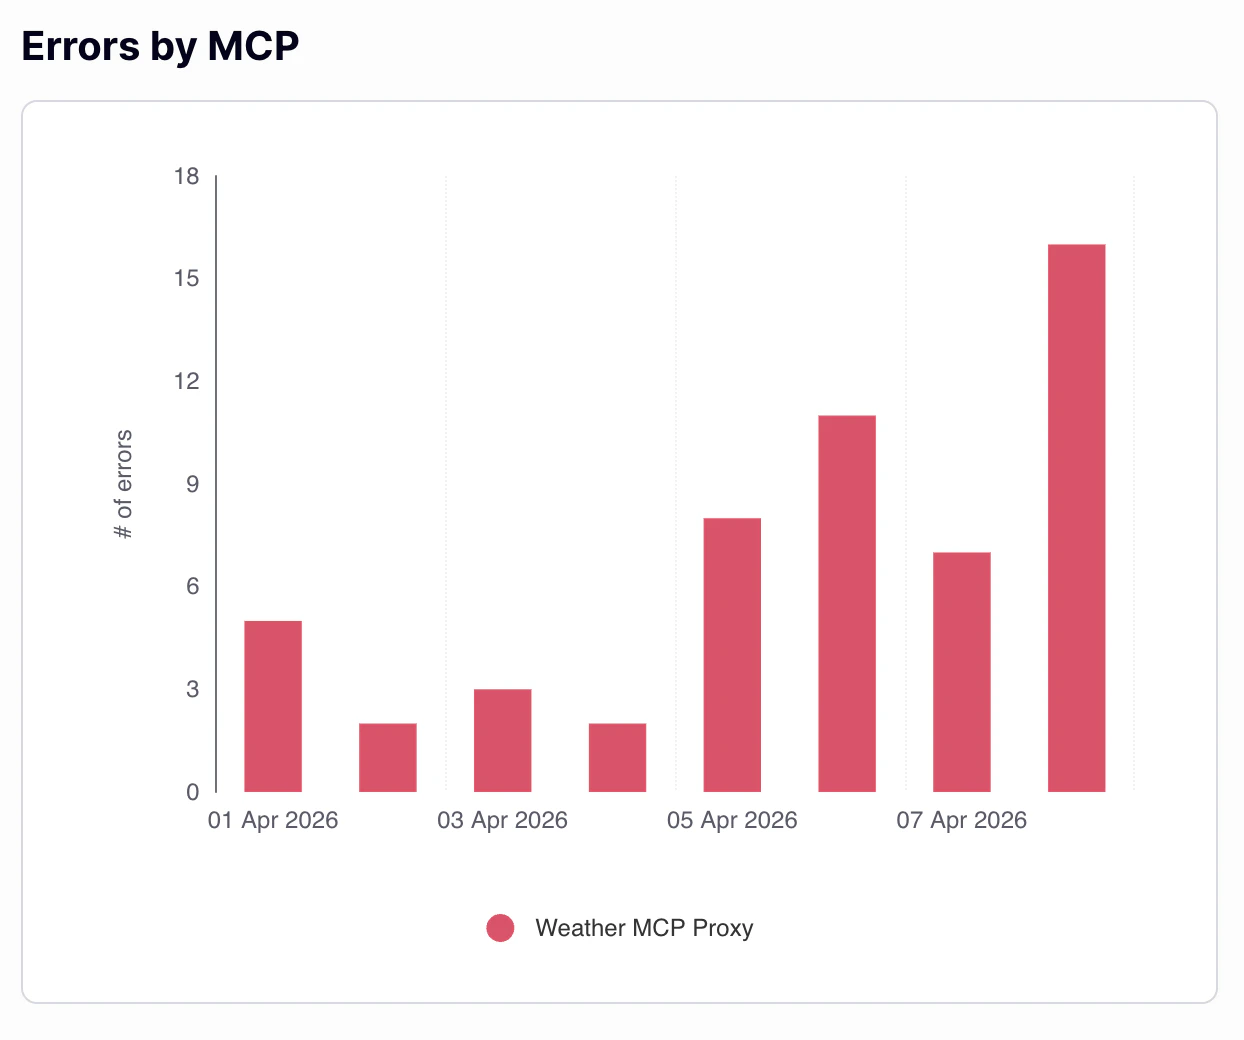
A stacked bar chart showing error count over time, with bars stacked by MCP proxy. Use this chart to identify which proxies are generating errors and whether spikes correlate with specific time periods. Persistent errors on one proxy suggest a configuration or upstream issue; a brief, time-bounded burst may indicate a client retry loop or a transient upstream outage.
### Errors by MCP
A stacked bar chart showing error count over time, with bars stacked by MCP proxy. Use this chart to identify which proxies are generating errors and whether spikes correlate with specific time periods. Persistent errors on one proxy suggest a configuration or upstream issue; a brief, time-bounded burst may indicate a client retry loop or a transient upstream outage.
 ## Primitive-Level Charts
The charts in this section break down activity to the individual primitive level: tools, resources, and prompts. Use them to move from knowing that a proxy has a problem to knowing exactly which tool, resource, or prompt is the cause.
### Most Used Primitives
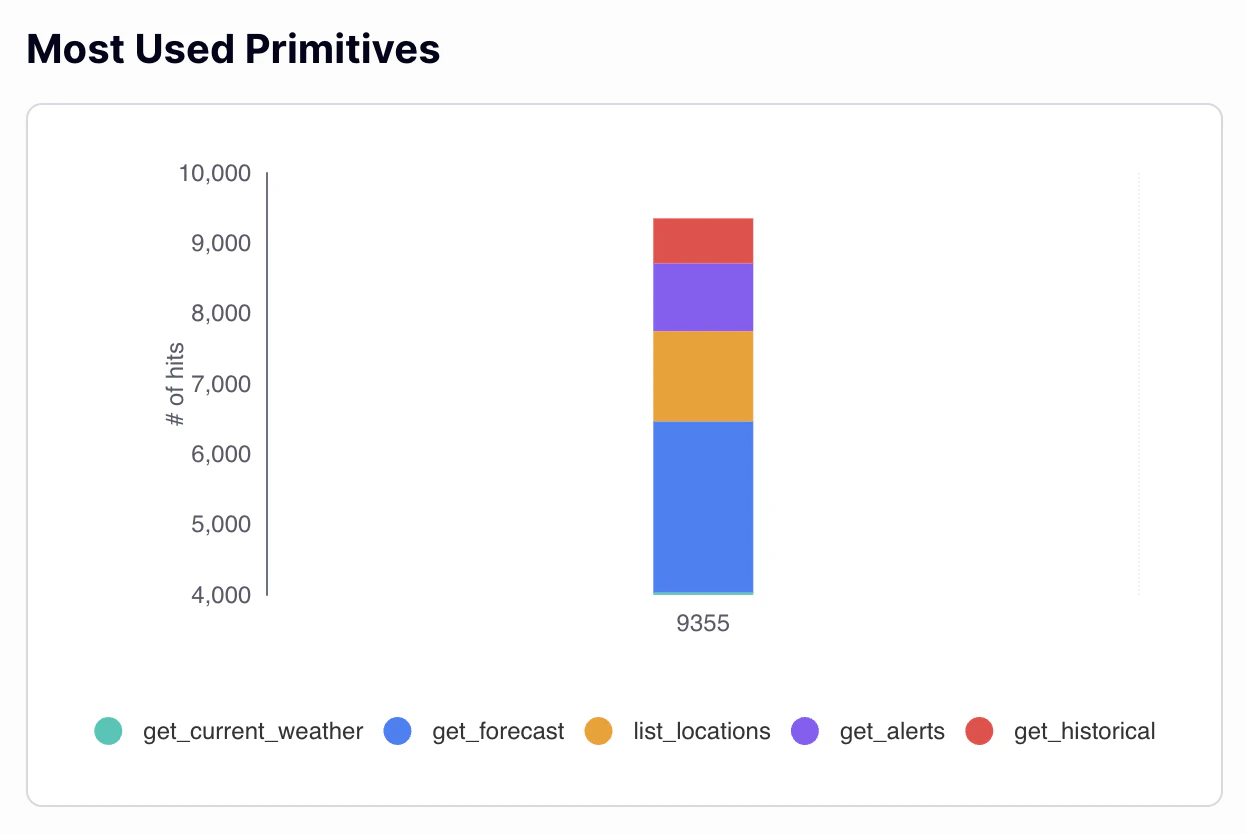
A horizontal stacked bar chart showing total hits ranked by primitive, highest first. Use this chart to identify which tools, resources, or prompts agents call most frequently. High-volume tools are the best candidates for per-tool rate limits and circuit breaker configuration.
## Primitive-Level Charts
The charts in this section break down activity to the individual primitive level: tools, resources, and prompts. Use them to move from knowing that a proxy has a problem to knowing exactly which tool, resource, or prompt is the cause.
### Most Used Primitives
A horizontal stacked bar chart showing total hits ranked by primitive, highest first. Use this chart to identify which tools, resources, or prompts agents call most frequently. High-volume tools are the best candidates for per-tool rate limits and circuit breaker configuration.
 ### Most Failing Primitives
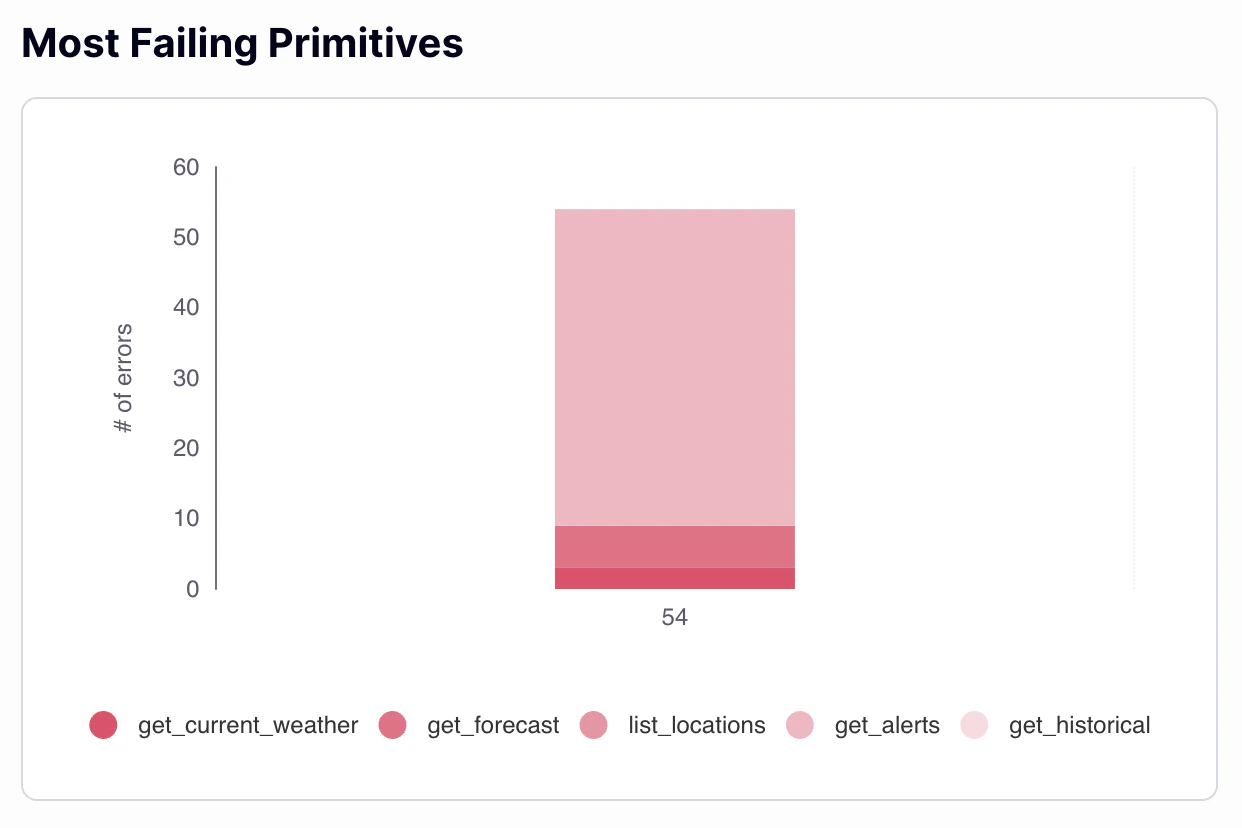
A horizontal stacked bar chart showing total errors ranked by primitive. Use this chart to pinpoint which primitives have the highest failure rates and may require investigation or circuit breaker configuration.
### Most Failing Primitives
A horizontal stacked bar chart showing total errors ranked by primitive. Use this chart to pinpoint which primitives have the highest failure rates and may require investigation or circuit breaker configuration.
 ### Slowest Primitives
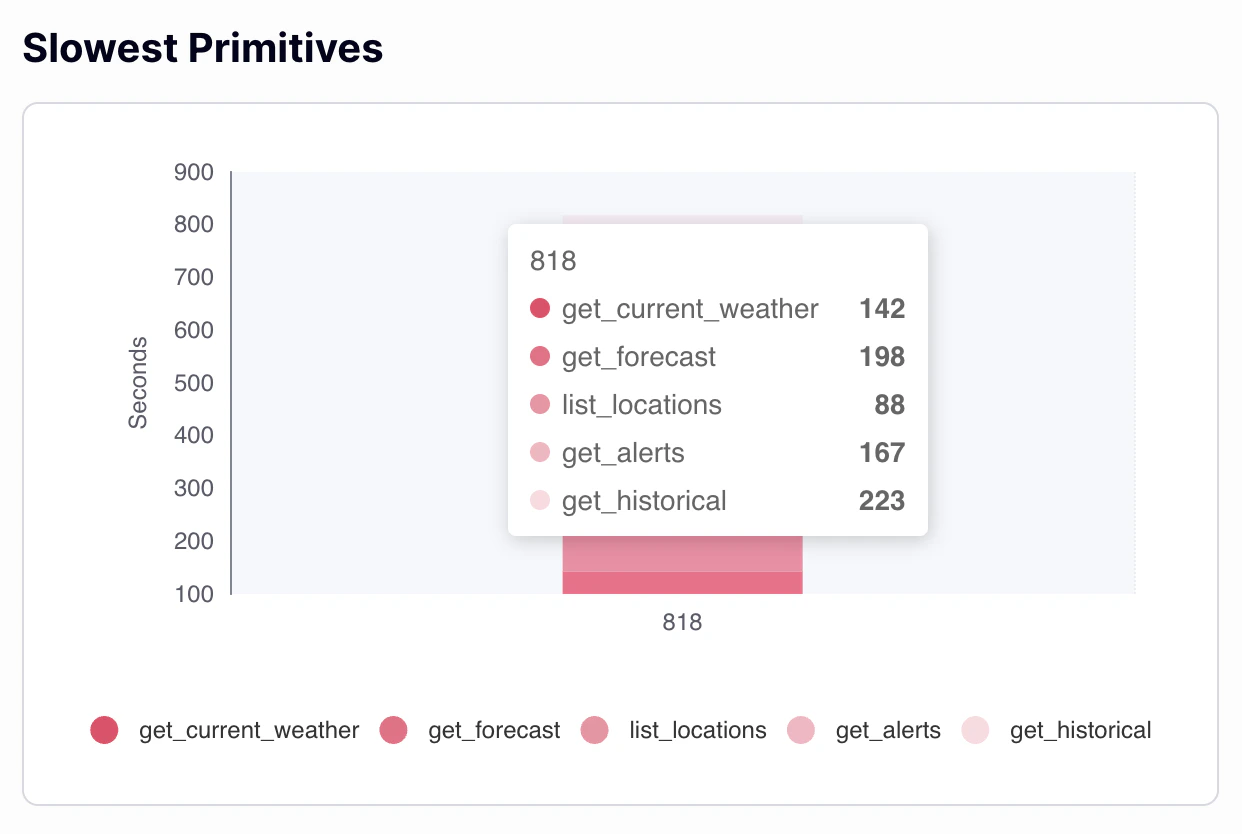
A horizontal stacked bar chart showing average latency in seconds, ranked by primitive. Use this chart to identify performance bottlenecks in your upstream MCP server. Consistently slow tools are good candidates for per-tool timeouts, which prevent a single slow tool from stalling an entire agent session.
### Slowest Primitives
A horizontal stacked bar chart showing average latency in seconds, ranked by primitive. Use this chart to identify performance bottlenecks in your upstream MCP server. Consistently slow tools are good candidates for per-tool timeouts, which prevent a single slow tool from stalling an entire agent session.
 ### Error Status Codes by Primitive
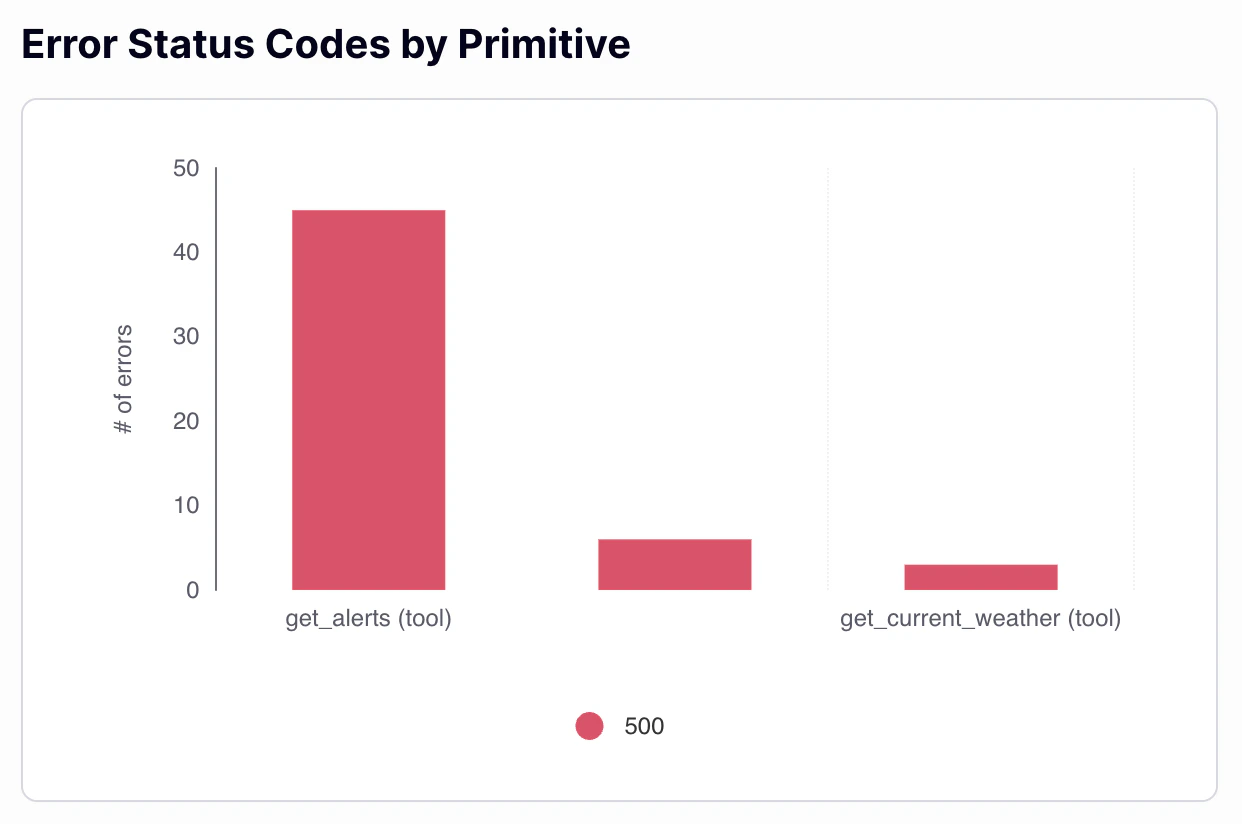
A stacked bar chart breaking down HTTP error status codes by primitive. Use this chart to diagnose the type of errors occurring at the primitive level and determine whether failures are originating at the gateway or the upstream MCP server.
### Error Status Codes by Primitive
A stacked bar chart breaking down HTTP error status codes by primitive. Use this chart to diagnose the type of errors occurring at the primitive level and determine whether failures are originating at the gateway or the upstream MCP server.
 Analytics data is only recorded for MCP proxies that have analytics recording enabled. If charts show no data for a proxy, verify that analytics recording is configured correctly for that proxy.