> ## Documentation Index
> Fetch the complete documentation index at: https://tyk.io/docs/llms.txt
> Use this file to discover all available pages before exploring further.
# Uptime Tests
> How to configure uptime tests
## Introuduction
As of v1.9 Tyk supports a kind of built-in "uptime awareness" of the underlying services and hosts that it is managing traffic for by actively polling user-defined endpoints at set intervals.
Tyk uptime awareness is not meant to replace traditional uptime monitoring tools, in fact, it is designed to supplement them by offering a way to bypass unhealthy nodes when they are down as part of Tyk's role as an API Gateway.
### Compatibility
Uptime tests are only available for Tyk Self-Managed users. It is not available on Tyk Cloud.
### How do the uptime tests work?
When uptime tests are added into a Tyk cluster, a single Gateway will elect itself as primary. Gateways remain as primary using a dead man's switch, by keeping a key active in Redis. Primaries are re-elected or confirmed every few seconds. If one Gateway stops or fails, another can detect the failure and elect itself as the primary.
The primary Gateway will then run the uptime tests allocated to the cluster (shard group).
The Gateway running the uptime test will have a worker pool defined so that it can execute tests simultaneously every few seconds determined by a Gateway-configurable interval loop. Depending on how many uptime tests are being run, this worker pool should be increased or decreased as needed.
## Initial configuration
To configure uptime tests, add the relevant section to your `tyk.conf`:
```yaml theme={null}
"uptime_tests": {
"disable": false, // disable uptime tests on the node completely
"poller_group":"",
"config": {
"enable_uptime_analytics": true,
"failure_trigger_sample_size": 3,
"time_wait": 300,
"checker_pool_size": 50
}
}
```
* `disable`: When set to `false` this tells Tyk to run uptime tests, if you do not want any uptime tests to run on a Gateway, set it to `true` and they will be disabled on those Gateways (this could be useful if you are running uptime tests in a separate group of Tyk instances).
* `poller_group`: This field is used to define a different group of uptime tests. All the gateways that have the same `poller_group`, will be candidates to be elected as the primary Gateway of its group. This could be useful if you are running uptime tests in a segmented or sharded group of Tyk instances.
* `enable_uptime_analytics`: Tyk supports the recording of the data that is generated by the uptime tests, these can then be tabulated in the dashboard. Set to `true` to enable uptime analytics. However, since uptime tests run constantly, they can generate large amounts of data, for some users who do not wish to manage this data, they can disable it by setting this value to `false`.
* `failure_trigger_sample_size`: Here we tell Tyk to trigger a `HostDown` or `HostUp` event after the test has failed or passed a set number of times; `3` in this example. Setting the number to higher values can protect against false positives, but can increase lead incident time due to the verification.
* `time_wait`: The number of seconds between running tests. In this example, it is set to `300` seconds.
* `checker_pool_size`: The worker pool for uptime tests. In this example we have configured Tyk to keep `50` idle workers in memory to send tests to, in other words, with this configuration, you are pretty much guaranteed asynchronous testing for up to 50 tests.
## Configure with the API Definition
Uptime test checklists sit within API configurations, so in your API Definition add a section for the tests:
```yaml theme={null}
uptime_tests: {
check_list: [
{
"url": "http://google.com/"
},
{
"url": "http://posttestserver.com/post.php?dir=uptime-checker",
"method": "POST",
"headers": {
"this": "that",
"more": "beans"
},
"body": "VEhJUyBJUyBBIEJPRFkgT0JKRUNUIFRFWFQNCg0KTW9yZSBzdHVmZiBoZXJl"
}
]
},
```
Uptime tests are not versioned.
In the above example, there are two forms for the Uptime test, a "quick" form, which assumes a GET request:
```
{
"url": "http://google.com/"
}
```
Or a long form, which allows for a full request to be checked or mocked:
```
{
"url": "http://posttestserver.com/post.php?dir=tyk-checker-target-test&beep=boop",
"method": "POST",
"headers": {
"this": "that",
"more": "beans"
},
"body": "VEhJUyBJUyBBIEJPRFkgT0JKRUNUIFRFWFQNCg0KTW9yZSBzdHVmZiBoZXJl",
"timeout": 1000
}
```
* `body`: The `body` is Base64 encoded.
* `timeout`: The `timeout` in milli seconds.
## Configure with the Dashboard
To add an uptime test using the dashboard is very simple. Make sure that you have fulfilled the prerequisite configuration in your Gateway to enable the tester.
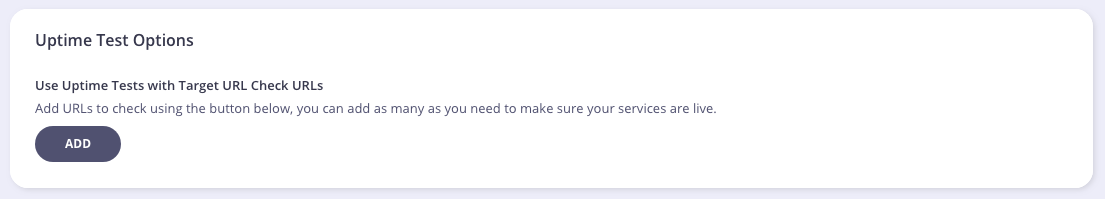
**Step 1: Select the Uptime Tests tab**
From the API Designer select the **Uptime Tests** tab:
 **Step 2: Click Add**
Click **Add** to add a test:
**Step 2: Click Add**
Click **Add** to add a test:
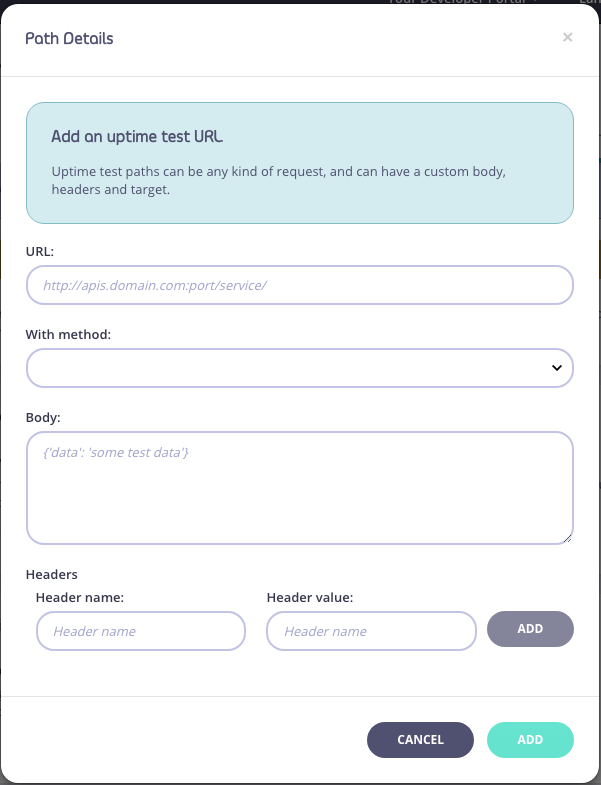
 **Step 3: Enter Path Details**
From the **Path Details** pop-up, complete the details and click **Add** to add the test:
**Step 3: Enter Path Details**
From the **Path Details** pop-up, complete the details and click **Add** to add the test:
 ## Events
**Uptime and downtime events**
When Tyk detects downtime on a test, it will trigger a system event called `HostDown`, when that host returns to service, it will trigger `HostUp`. These events are triggered in the same event system as other Tyk Events, and therefore can have any kind of action performed:
* A logger action
* A web hook to a notification URL
* A custom JS script for complex API interactions
Please see the section on the event system on how to add event handlers to your API Definition.
Since tests are on a URL-by-URL basis, you could potentially see multiple `HostDown` events for a single host where multiple endpoints are being tested.
## Load balancing and Service Discovery
**Downtime detection and service availability**
If you have configured Tyk to use round-robin load balancing, you can enable an option in the `proxy` section of your API Definition that will check the hostname of the outbound Tyk request (to your service) against the downtime list to see if the server is active, if the host is marked as "down" Tyk will skip to the next host in its list before making the request:
Note, the fully qualified host, including the port, needs to be exactly the same between the uptime test config and the RRLB entry in order for Tyk to link the two together.
ie: `www.myapi.com:3000`
```
...
"proxy": {
...
"check_host_against_uptime_tests": true,
...
}
...
```
## Events
**Uptime and downtime events**
When Tyk detects downtime on a test, it will trigger a system event called `HostDown`, when that host returns to service, it will trigger `HostUp`. These events are triggered in the same event system as other Tyk Events, and therefore can have any kind of action performed:
* A logger action
* A web hook to a notification URL
* A custom JS script for complex API interactions
Please see the section on the event system on how to add event handlers to your API Definition.
Since tests are on a URL-by-URL basis, you could potentially see multiple `HostDown` events for a single host where multiple endpoints are being tested.
## Load balancing and Service Discovery
**Downtime detection and service availability**
If you have configured Tyk to use round-robin load balancing, you can enable an option in the `proxy` section of your API Definition that will check the hostname of the outbound Tyk request (to your service) against the downtime list to see if the server is active, if the host is marked as "down" Tyk will skip to the next host in its list before making the request:
Note, the fully qualified host, including the port, needs to be exactly the same between the uptime test config and the RRLB entry in order for Tyk to link the two together.
ie: `www.myapi.com:3000`
```
...
"proxy": {
...
"check_host_against_uptime_tests": true,
...
}
...
```