> ## Documentation Index
> Fetch the complete documentation index at: https://tyk.io/docs/llms.txt
> Use this file to discover all available pages before exploring further.
# Distributed Tracing with Tyk
> Learn how to configure distributed tracing in Tyk for enhanced API observability, including integration with OpenTelemetry and third-party tracing tools.
## Distributed Tracing
Distributed traces provide a detailed, end-to-end view of a single API request or transaction as it traverses through various services and components. Traces are crucial for understanding the flow of requests and identifying bottlenecks or latency issues. Here's how you can make use of traces for API observability:
* **End-to-end request tracing:** Implement distributed tracing across your microservices architecture to track requests across different services and gather data about each service's contribution to the overall request latency.
* **Transaction Flow:** Visualize the transaction flow by connecting traces to show how requests move through different services, including entry points (e.g., API gateway), middleware and backend services.
* **Latency Analysis:** Analyze trace data to pinpoint which service or component is causing latency issues, allowing for quick identification and remediation of performance bottlenecks.
* **Error Correlation:** Use traces to correlate errors across different services to understand the root cause of issues and track how errors propagate through the system.
Since v5.2, Tyk Gateway has supported the [OpenTelemetry](/5.12/api-management/traces#opentelemetry) standard for distributed tracing. You can configure Tyk to work with an [OpenTelemetry collector](https://opentelemetry.io/docs/collector/) or integrate it with any [observability vendor supporting OpenTelemetry](https://opentelemetry.io/ecosystem/vendors/) to capture traces of API requests as they flow through Tyk Gateway and any upstream services.
Explore our guides for [Datadog](/5.12/api-management/traces#datadog), [Dynatrace](/5.12/api-management/traces#dynatrace), [Jaeger](/5.12/api-management/traces#using-docker) and [New Relic](/5.12/api-management/traces#new-relic) for further info on how to integrate with 3rd party observability vendors.
Tyk also supports the legacy [OpenTracing](/5.12/api-management/traces#opentracing-deprecated) approach (now deprecated), but we recommend users to adopt OpenTelemetry for a comprehensive, vendor-neutral technology with wide industry support.
## OpenTelemetry
Starting from Tyk Gateway version 5.2, you can leverage the power of [OpenTelemetry](https://opentelemetry.io/docs/what-is-opentelemetry/), an open-source observability framework designed for cloud-native software. This enhances your API monitoring with end-to-end distributed tracing. At this time, Tyk does not support OpenTelemetry metrics or logging, but we have these on our roadmap for future enhancement of the product.
This documentation will guide you through the process of enabling and configuring OpenTelemetry in Tyk Gateway. You'll also learn how to customize trace detail levels to meet your monitoring requirements.
For further guidance on configuring your observability back-end, explore our guides for [Datadog](/5.12/api-management/traces#datadog), [Dynatrace](/5.12/api-management/traces#dynatrace), [Jaeger](/5.12/api-management/traces#jaeger) and [New Relic](/5.12/api-management/traces#new-relic).
All the configuration options available when using Tyk's OpenTelemetry capability are documented in the [Tyk Gateway configuration guide](/5.12/tyk-oss-gateway/configuration#opentelemetry).
### Using OpenTelemetry with Tyk
OpenTelemetry support must be enabled at the Gateway level by adding the following to the Tyk Gateway configuration file (typically `tyk.conf`):
```json theme={null}
{
"opentelemetry": {
"enabled": true
}
}
```
Alternatively you can set the corresponding environment variable `TYK_GW_OPENTELEMETRY_ENABLED` to `true`.
By default, OpenTelemetry spans are exported to the collector using the `gRPC` protocol to `localhost:4317`. You can choose between HTTP and gRPC protocols by configuring the [opentelemetry.exporter](/5.12/tyk-oss-gateway/configuration#opentelemetry-exporter) field to `http` or `grpc`. You can specify an alternative target using the [opentelemetry.endpoint](/5.12/tyk-oss-gateway/configuration#opentelemetry-endpoint) control.
Tyk Gateway will now generate two spans for each request made to your APIs, encapsulating the entire request lifecycle. These spans include attributes and tags but lack fine-grained details. The parent span represents the total time from request reception to response and the child span represent the time spent in the upstream service.
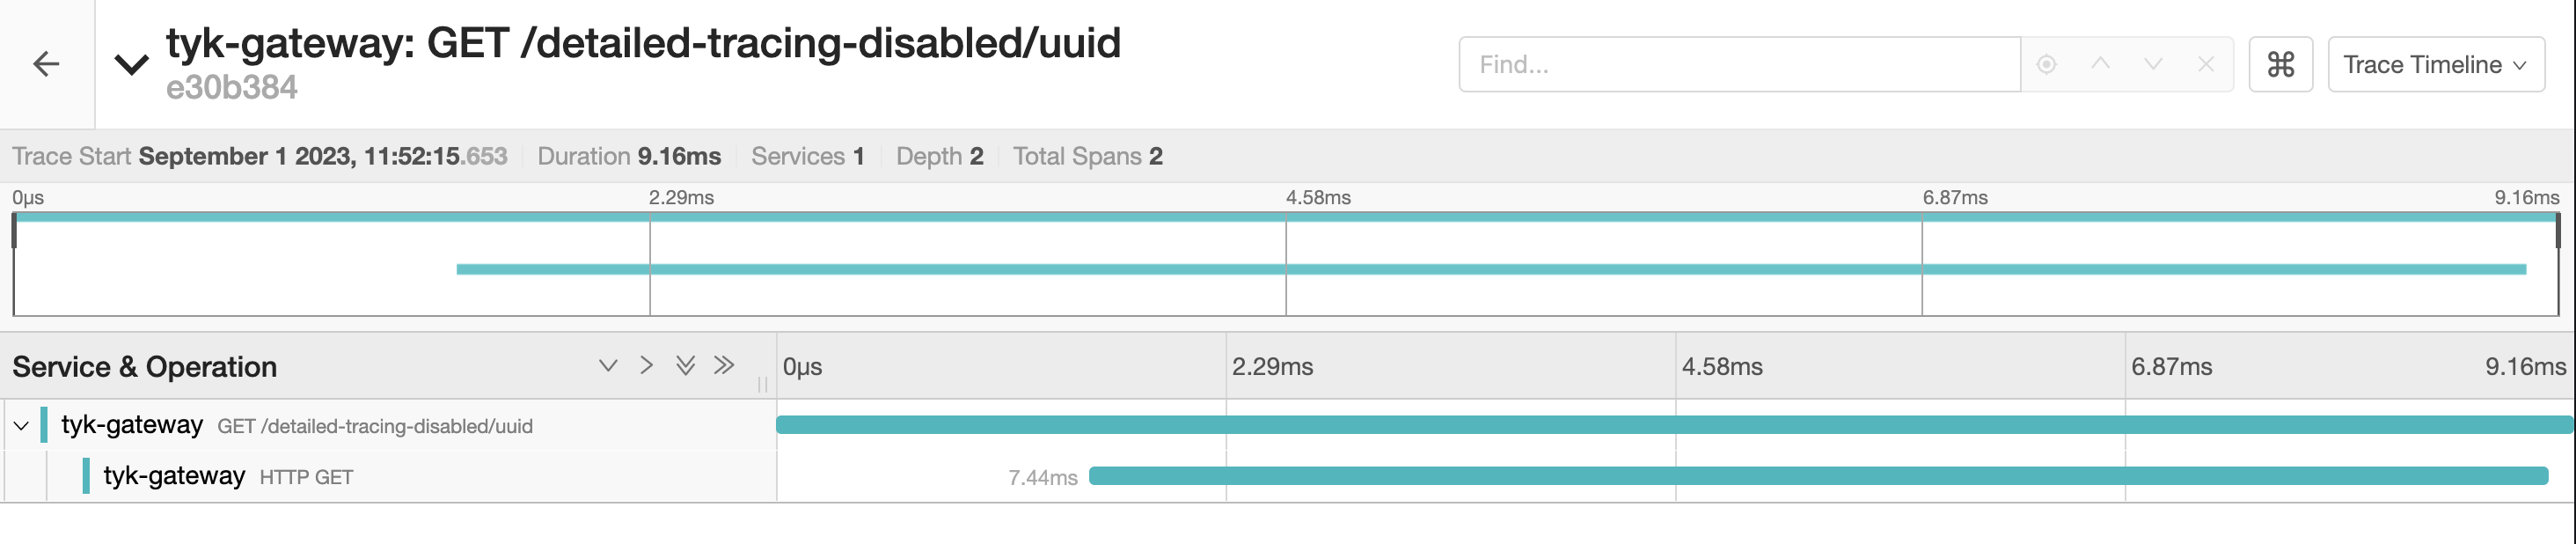 #### Detailed Tracing
You can generate more detailed traces for requests to an API by setting the [server.detailedTracing](/5.12/api-management/gateway-config-tyk-oas#detailedtracing) flag in the Tyk Vendor Extension of the API definition.
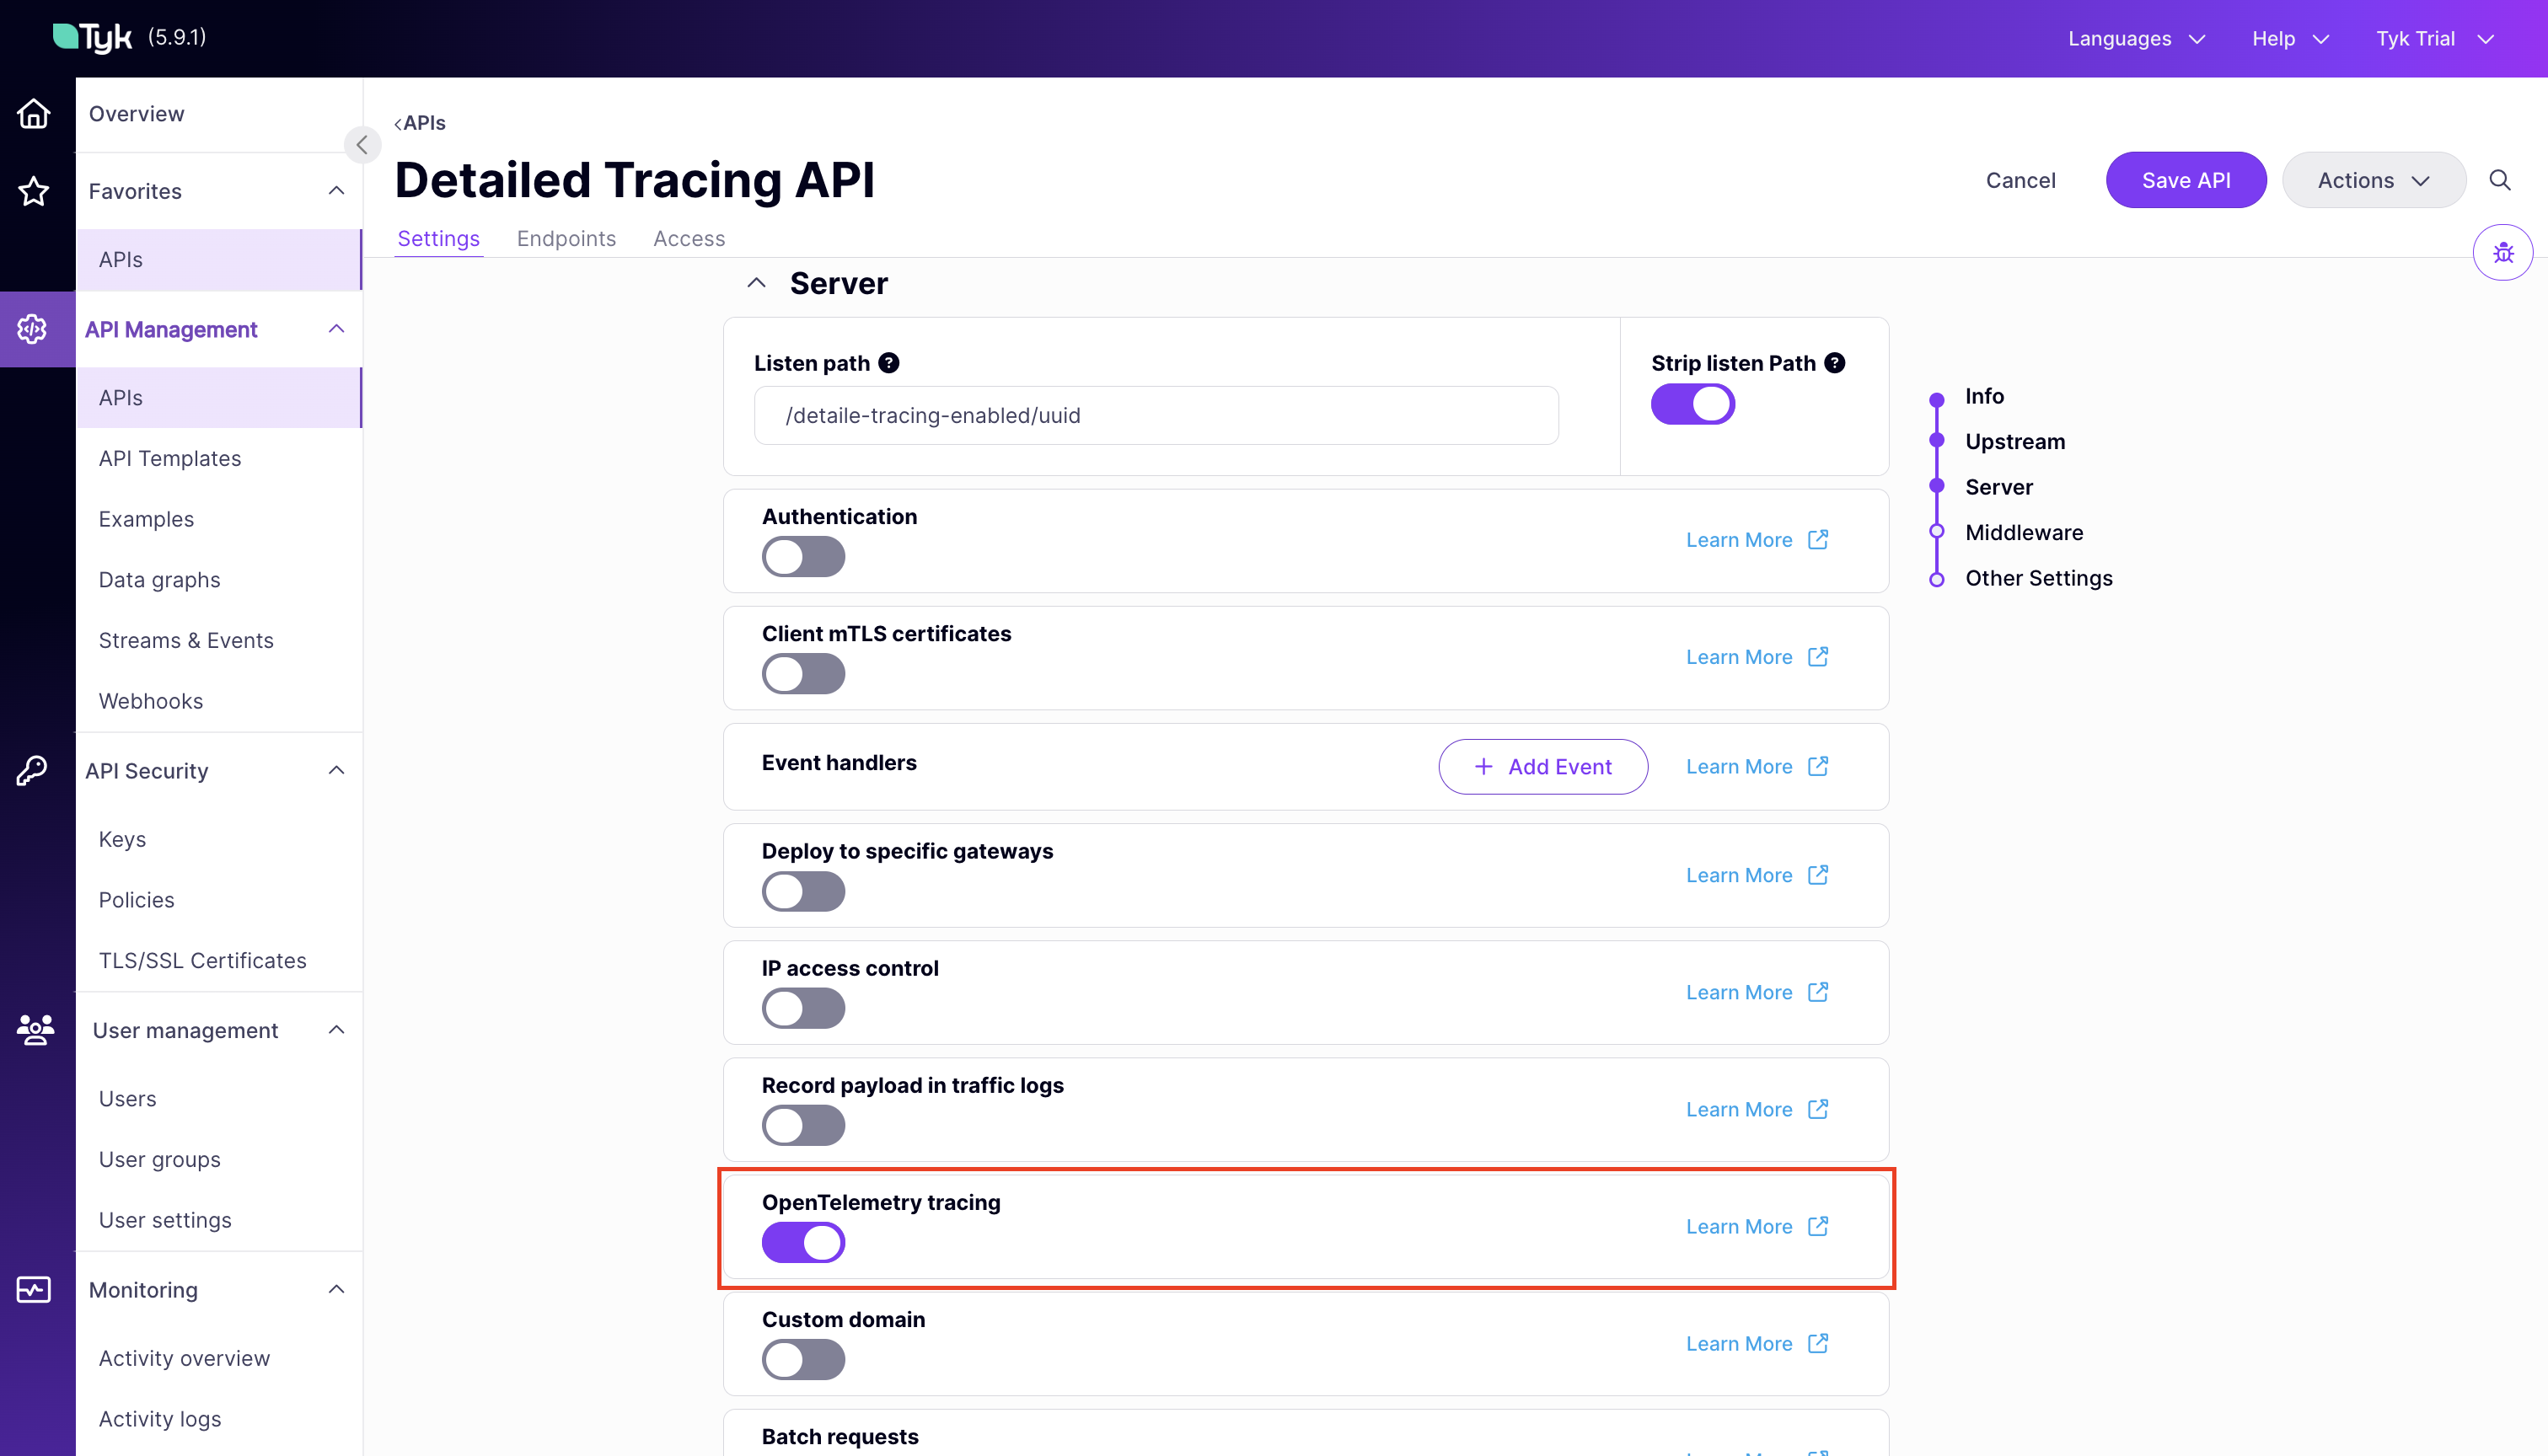
For users of the Tyk Dashboard UI, the **OpenTelemetry Tracing** option in the Tyk OAS API Designer allows you to set and unset this option for the API.
#### Detailed Tracing
You can generate more detailed traces for requests to an API by setting the [server.detailedTracing](/5.12/api-management/gateway-config-tyk-oas#detailedtracing) flag in the Tyk Vendor Extension of the API definition.
For users of the Tyk Dashboard UI, the **OpenTelemetry Tracing** option in the Tyk OAS API Designer allows you to set and unset this option for the API.
 When detailed tracing is enabled for an API, Tyk creates a span for each middleware involved in request processing. These spans offer detailed insights, including the time taken for each middleware execution and the sequence of invocations.
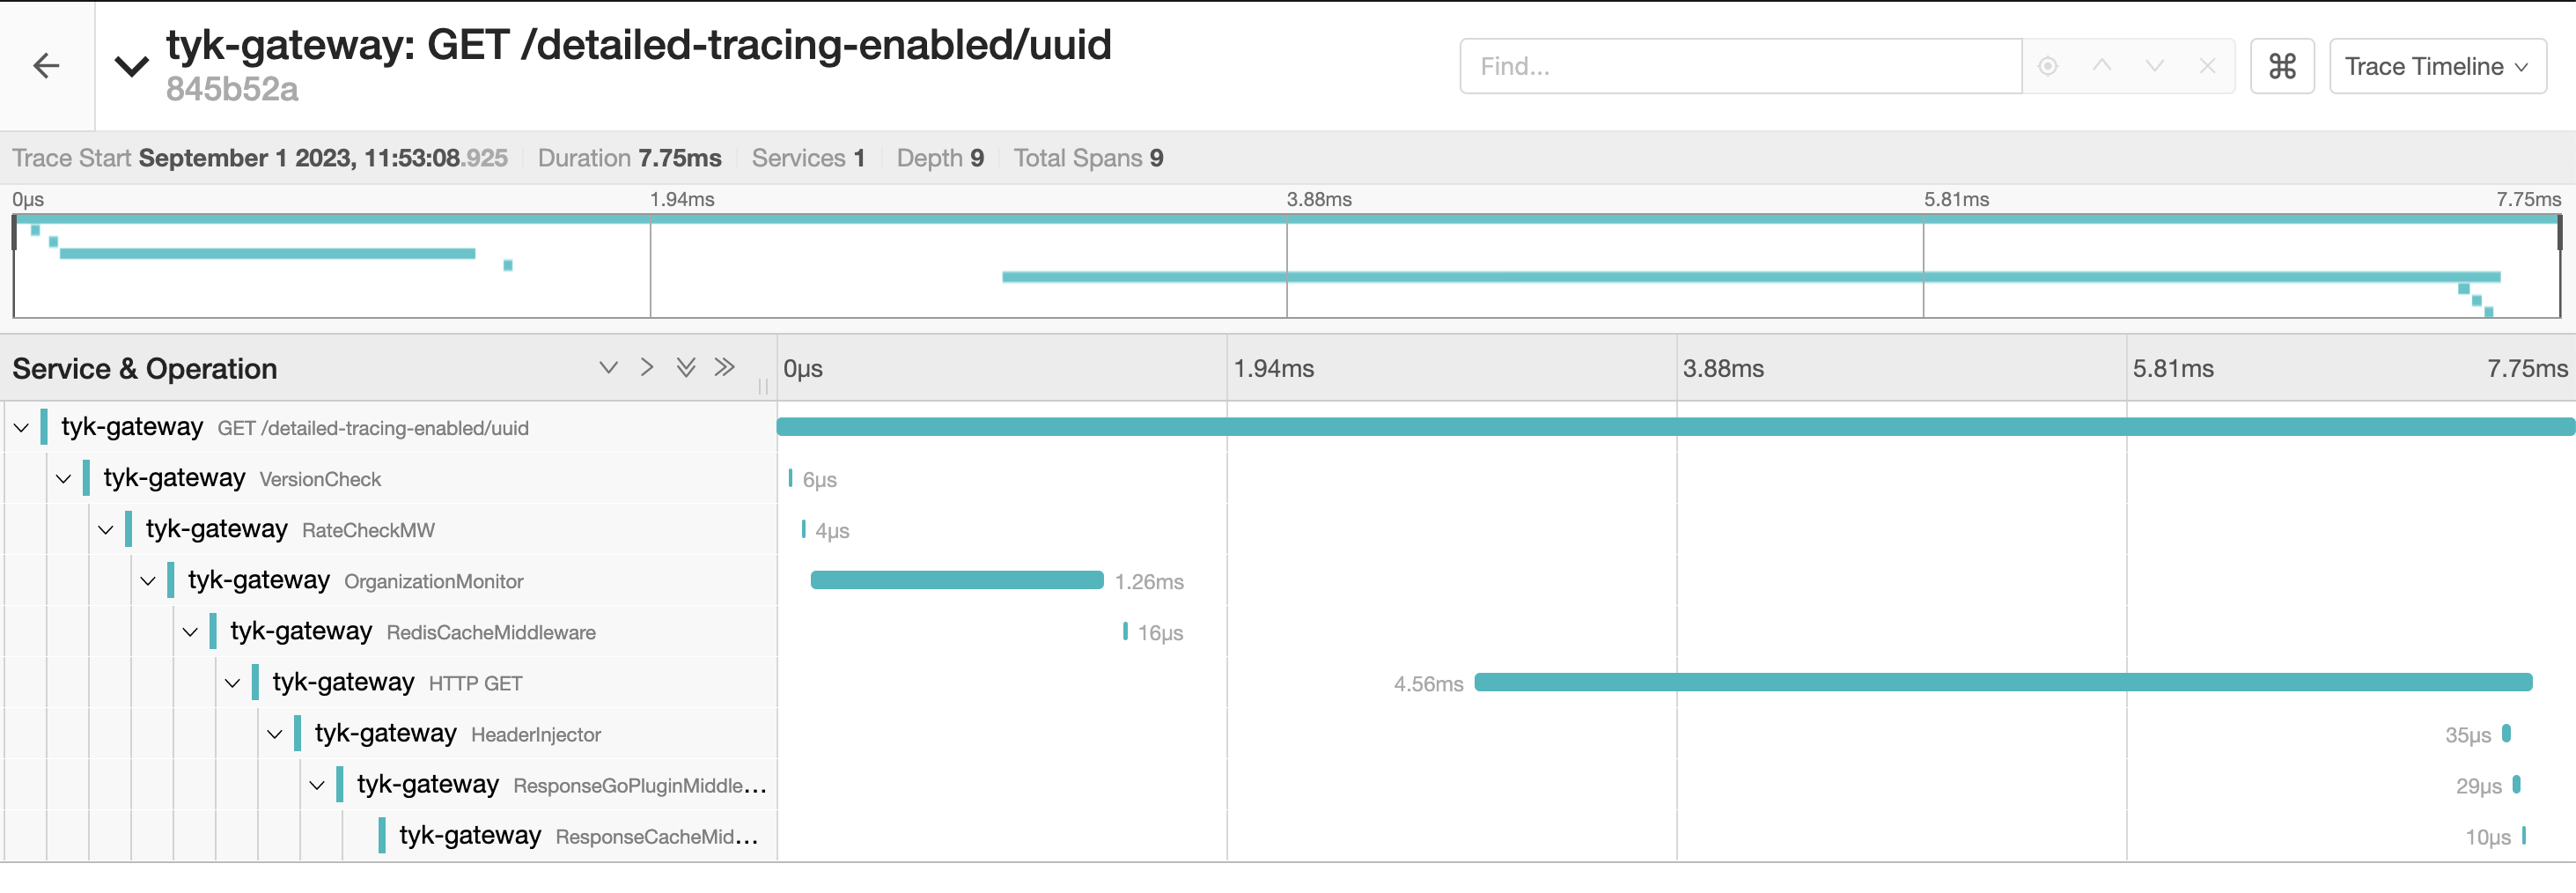 By choosing the appropriate setting, you can customize the level of tracing detail to suit your monitoring needs.
**Tyk Classic APIs**
If you are using Tyk Classic APIs, then the equivalent field in the API definition is [detailed\_tracing](/5.12/api-management/gateway-config-tyk-classic#opentelemetry).
### Understanding The Traces
Tyk Gateway exposes a helpful set of *span attributes* and *resource attributes* with the generated spans. These attributes provide useful insights for analyzing your API requests. A clear analysis can be obtained by observing the specific actions and associated context within each request/response. This is where span and resource attributes play a significant role.
#### Span Attributes
A span is a named, timed operation that represents an operation. Multiple spans represent different parts of the workflow and are pieced together to create a trace. While each span includes a duration indicating how long the operation took, the span attributes provide additional contextual metadata.
Span attributes are key-value pairs that provide contextual metadata for individual spans. Tyk automatically sets the following span attributes:
* `tyk.api.name`: API name.
* `tyk.api.orgid`: Organization ID.
* `tyk.api.id`: API ID.
* `tyk.api.path`: API listen path.
* `tyk.api.tags`: If tagging is enabled in the API definition, the tags are added here.
* `tyk.api.apikey.alias`: The identity alias of the authenticated client. Populated for APIs using JWT authentication or multi-auth (compliant mode).
#### Resource Attributes
Resource attributes provide contextual information about the entity that produced the telemetry data. Tyk exposes following resource attributes:
#### Service Attributes
The service attributes supported by Tyk are:
| Attribute | Type | Description |
| :------------------------------------ | :-------- | :----------------------------------------------------------------------------------------------- |
| `service.name` | String | Service name for Tyk API Gateway: `tyk-gateway` |
| `service.instance.id` and `tyk.gw.id` | String | The Node ID assigned to the gateway. Example `solo-6b71c2de-5a3c-4ad3-4b54-d34d78c1f7a3` |
| `service.version` | String | Represents the service version. Example `v5.2.0` |
| `tyk.gw.dataplane` | Bool | Whether the Tyk Gateway is hybrid (`slave_options.use_rpc=true`) |
| `tyk.gw.group.id` | String | Represents the `slave_options.group_id` of the gateway. Populated only if the gateway is hybrid. |
| `tyk.gw.tags` | \[]String | Represents the gateway `segment_tags`. Populated only if the gateway is segmented. |
By understanding and using these resource attributes, you can gain better insights into the performance of your API Gateways.
#### Common HTTP Span Attributes
Tyk follows the OpenTelemetry semantic conventions for HTTP spans. You can find detailed information on common attributes [here](https://github.com/open-telemetry/semantic-conventions/blob/main/docs/http/http-spans.md#common-attributes).
Some of these common attributes include:
* `http.method`: HTTP request method.
* `http.scheme`: URL scheme.
* `http.status_code`: HTTP response status code.
* `http.url`: Full HTTP request URL.
For the full list and details, refer to the official [OpenTelemetry Semantic Conventions](https://github.com/open-telemetry/semantic-conventions/blob/main/docs/http/http-spans.md#common-attributes).
### Advanced OpenTelemetry Capabilities
#### Context Propagation
This setting allows you to specify the type of context propagator to use for trace data. It's essential for ensuring compatibility and data integrity between different services in your architecture. The available options are:
* **tracecontext**: Supports the [W3C Trace Context](https://www.w3.org/TR/trace-context/) format. This is the default.
* **b3**: Serializes `SpanContext` to/from the B3 multi-header format. [More information](https://github.com/openzipkin/b3-propagation).
* **custom**: Reads the trace ID from a custom header (set via `custom_trace_header`) and writes it back to that same custom header only. No standard headers are written to upstream.
* **composite**: Reads the trace ID from a custom header (priority) or standard headers (fallback), and writes **both** the custom header and the standard `traceparent` header to upstream.
`custom` and `composite` are available from Tyk Gateway v5.12.0 and require `custom_trace_header` to be set.
The default setting is `tracecontext`. To configure this setting, you have two options:
* **Environment Variable**: Use `TYK_GW_OPENTELEMETRY_CONTEXTPROPAGATION` to specify the context propagator type.
* **Configuration File**: Navigate to the `opentelemetry.context_propagation` field in your configuration file to set your preferred option.
#### Custom Trace Header
If your upstream systems use a proprietary correlation header (for example, `X-Correlation-ID`), set `custom_trace_header` to that header name. The behavior depends on `context_propagation`:
**Tracecontext mode** (`tracecontext` + `custom_trace_header`) — reads from the custom header (with fallback to `traceparent`), writes only the standard `traceparent` header to upstream.
```json theme={null}
{
"opentelemetry": {
"enabled": true,
"context_propagation": "tracecontext",
"custom_trace_header": "X-Correlation-ID"
}
}
```
**Custom mode** (`custom` + `custom_trace_header`) — reads from and writes to the custom header only. No standard headers are involved.
```json theme={null}
{
"opentelemetry": {
"enabled": true,
"context_propagation": "custom",
"custom_trace_header": "X-Correlation-ID"
}
}
```
**Composite mode** (`composite` + `custom_trace_header`) — reads from the custom header (priority) or standard headers (fallback), and writes both the custom header and `traceparent` to upstream.
```json theme={null}
{
"opentelemetry": {
"enabled": true,
"context_propagation": "composite",
"custom_trace_header": "X-Correlation-ID"
}
}
```
In all modes, if the custom header is absent from the incoming request, the gateway falls back to standard headers or generates a new trace ID. The custom header is never generated if it wasn't present in the original request.
#### Sampling Strategies
Tyk supports configuring the following sampling strategies via the Sampling configuration structure:
##### Sampling Type
This setting dictates the sampling policy that OpenTelemetry uses to decide if a trace should be sampled for analysis. The decision is made at the start of a trace and applies throughout its lifetime. By default, the setting is `AlwaysOn`.
To customize, you can either set the `TYK_GW_OPENTELEMETRY_SAMPLING_TYPE` environment variable or modify the `opentelemetry.sampling.type` field in the Tyk Gateway configuration file. Valid values for this setting are:
* **AlwaysOn**: All traces are sampled.
* **AlwaysOff**: No traces are sampled.
* **TraceIDRatioBased**: Samples traces based on a specified ratio.
##### Sampling Rate
This field is crucial when the `Type` is configured to `TraceIDRatioBased`. It defines the fraction of traces that OpenTelemetry will aim to sample, and accepts a value between 0.0 and 1.0. For example, a `Rate` set to 0.5 implies that approximately 50% of the traces will be sampled. The default value is 0.5. To configure this setting, you have the following options:
* **Environment Variable**: Use `TYK_GW_OPENTELEMETRY_SAMPLING_RATE`.
* **Configuration File**: Update the `opentelemetry.sampling.rate` field in the configuration file.
##### ParentBased Sampling
This option is useful for ensuring the sampling consistency between parent and child spans. Specifically, if a parent span is sampled, all it's child spans will be sampled as well. This setting is particularly effective when used with `TraceIDRatioBased`, as it helps to keep the entire transaction story together. Using `ParentBased` with `AlwaysOn` or `AlwaysOff` may not be as useful, since in these cases, either all or no spans are sampled. The default value is `false`. Configuration options include:
* **Environment Variable**: Use `TYK_GW_OPENTELEMETRY_SAMPLING_PARENTBASED`.
* **Configuration File**: Update the `opentelemetry.sampling.parent_based` field in the configuration file.
#### Span Processor Configuration
When using `span_processor_type: batch` (the default), you can tune the batch processor to prevent span loss under high traffic. Use the `span_batch_config` block to configure the following fields:
* `max_queue_size` — maximum number of spans buffered before export (default: `2048`)
* `max_export_batch_size` — maximum number of spans per export batch (default: `512`)
* `batch_timeout` — seconds to wait before forcing an export (default: `5`)
```json theme={null}
{
"opentelemetry": {
"enabled": true,
"span_processor_type": "batch",
"span_batch_config": {
"max_queue_size": 8192,
"max_export_batch_size": 1024,
"batch_timeout": 3
}
}
}
```
Increase `max_queue_size` and `max_export_batch_size` in high-throughput environments where spans are being dropped before they can be exported.
### OpenTelemetry Backends for Tracing
#### Datadog
This guide explains how to configure Tyk API Gateway and the OpenTelemetry Collector to collect distributed traces in Datadog. It follows the reference documentation from [Datadog](https://docs.datadoghq.com/opentelemetry/otel_collector_datadog_exporter/?tab=onahost).
While this tutorial demonstrates using an OpenTelemetry Collector running in Docker, the core concepts remain consistent regardless of how and where the OpenTelemetry collector is deployed.
Whether you're using Tyk API Gateway in an open-source (OSS) or commercial deployment, the configuration options remain identical.
##### Prerequisites
* [Docker installed on your machine](https://docs.docker.com/get-docker/)
* Tyk Gateway v5.2.0 or higher
* OpenTelemetry Collector Contrib [docker image](https://hub.docker.com/r/otel/opentelemetry-collector-contrib). Make sure to use the Contrib distribution of the OpenTelemetry Collector as it is required for the [Datadog exporter](https://github.com/open-telemetry/opentelemetry-collector-contrib/tree/main/exporter/datadogexporter).
##### Steps for Configuration
1. **Configure the OpenTelemetry Collector**
You will need:
* An [API key from Datadog](https://docs.datadoghq.com/account_management/api-app-keys/#add-an-api-key-or-client-token). For example, `6c35dacbf2e16aa8cda85a58d9015c3c`.
* Your [Datadog site](https://docs.datadoghq.com/getting_started/site/#access-the-datadog-site). Examples are: `datadoghq.com`, `us3.datadoghq.com` and `datadoghq.eu`.
Create a new YAML configuration file named `otel-collector.yml` with the following content:
```yaml theme={null}
receivers:
otlp:
protocols:
grpc:
endpoint: 0.0.0.0:4317
processors:
batch:
send_batch_max_size: 100
send_batch_size: 10
timeout: 10s
exporters:
datadog:
api:
site: "YOUR-DATADOG-SITE"
key: "YOUR-DATAGOG-API-KEY"
service:
pipelines:
traces:
receivers: [otlp]
processors: [batch]
exporters: [datadog]
```
2. **Configure a test API**
If you don't have any APIs configured yet, create a subdirectory called `apps` in the current directory. Create a new file `apidef-hello-world.json` and copy this very simple API definition for testing purposes:
```json theme={null}
{
"name": "Hello-World",
"slug": "hello-world",
"api_id": "Hello-World",
"org_id": "1",
"use_keyless": true,
"detailed_tracing": true,
"version_data": {
"not_versioned": true,
"versions": {
"Default": {
"name": "Default",
"use_extended_paths": true
}
}
},
"proxy": {
"listen_path": "/hello-world/",
"target_url": "http://httpbin.org/",
"strip_listen_path": true
},
"active": true
}
```
3. **Create the Docker-Compose file**
Save the following YAML configuration to a file named `docker-compose.yml`.
```yaml theme={null}
version: "2"
services:
# OpenTelemetry Collector Contrib
otel-collector:
image: otel/opentelemetry-collector-contrib:latest
volumes:
- ./otel-collector.yml:/etc/otel-collector.yml
command: ["--config=/etc/otel-collector.yml"]
ports:
- "4317" # OTLP gRPC receiver
networks:
- tyk
# Tyk API Gateway, open-source deployment
tyk:
image: tykio/tyk-gateway:v5.2
ports:
- 8080:8080
environment:
- TYK_GW_OPENTELEMETRY_ENABLED=true
- TYK_GW_OPENTELEMETRY_EXPORTER=grpc
- TYK_GW_OPENTELEMETRY_ENDPOINT=otel-collector:4317
volumes:
- ./apps:/opt/tyk-gateway/apps
depends_on:
- redis
networks:
- tyk
redis:
image: redis:4.0-alpine
ports:
- 6379:6379
command: redis-server --appendonly yes
networks:
- tyk
networks:
tyk:
```
To start the services, go to the directory that contains the docker-compose.yml file and run the following command:
```bash theme={null}
docker-compose up
```
4. **Explore OpenTelemetry traces in Datadog**
Begin by sending a few requests to the API endpoint configured in step 2:
` http://localhost:8080/hello-world/
`
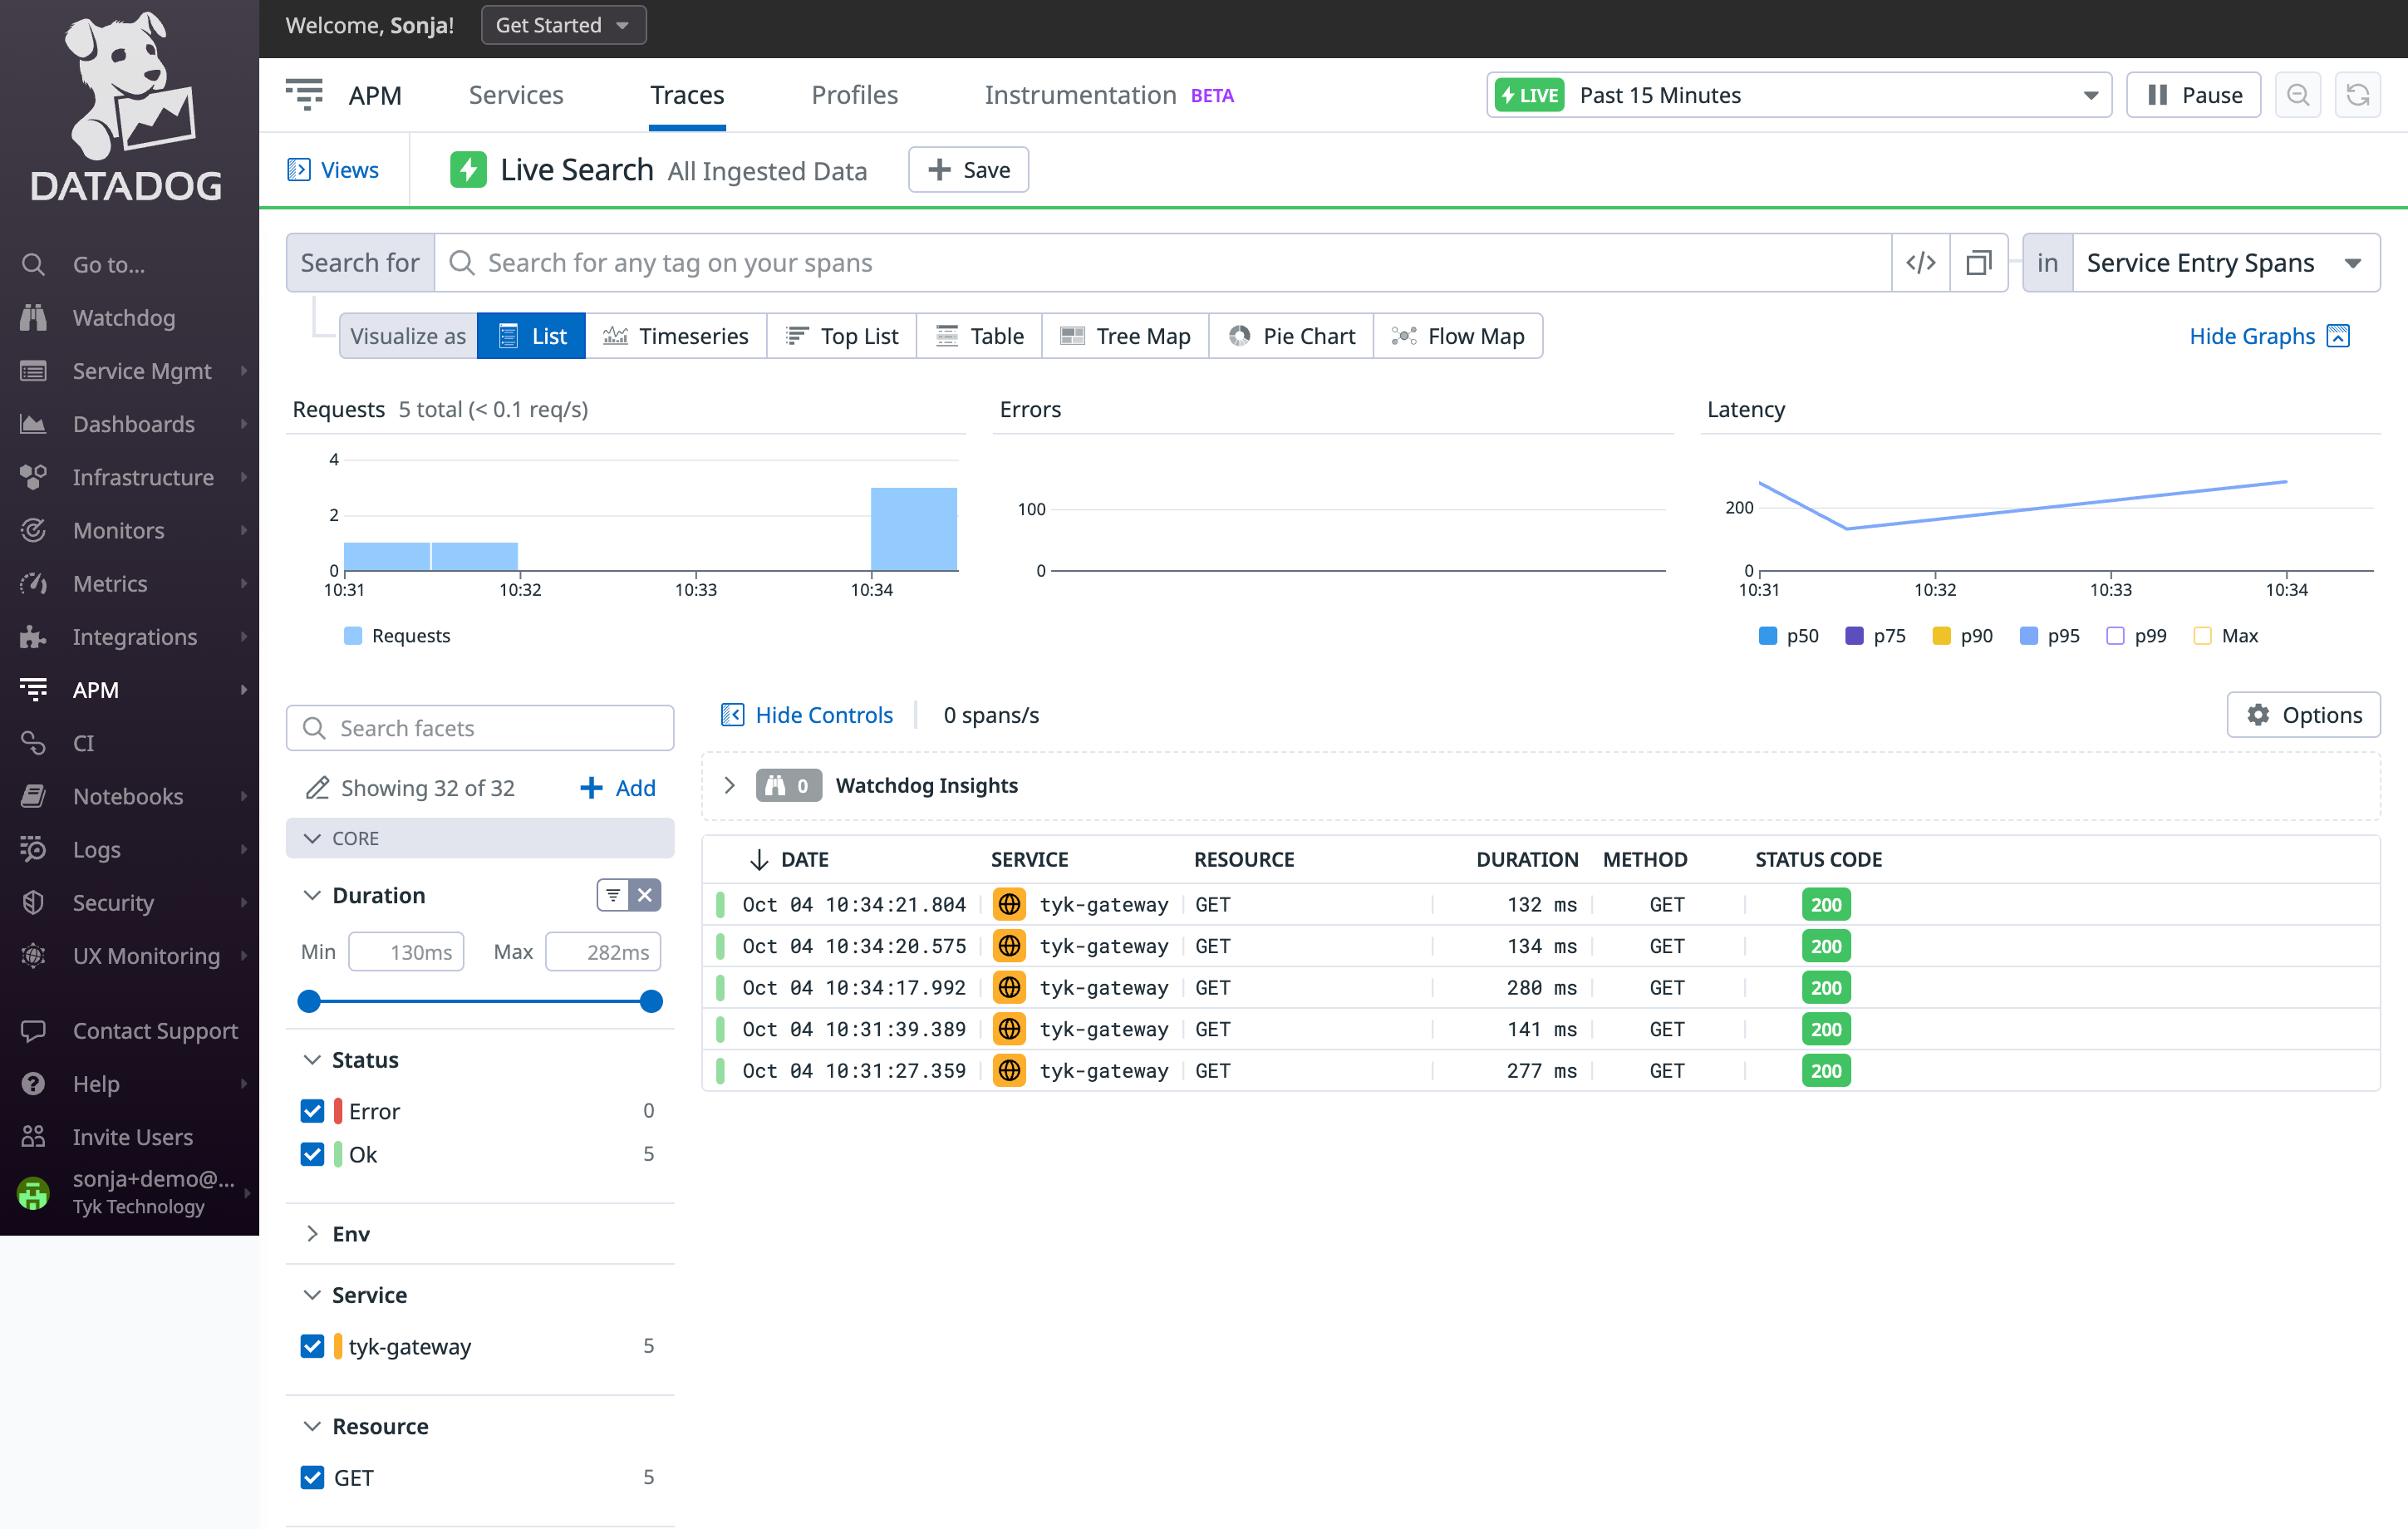
Next, log in to Datadog and navigate to the 'APM' / 'Traces' section. Here, you should start observing traces generated by Tyk:
By choosing the appropriate setting, you can customize the level of tracing detail to suit your monitoring needs.
**Tyk Classic APIs**
If you are using Tyk Classic APIs, then the equivalent field in the API definition is [detailed\_tracing](/5.12/api-management/gateway-config-tyk-classic#opentelemetry).
### Understanding The Traces
Tyk Gateway exposes a helpful set of *span attributes* and *resource attributes* with the generated spans. These attributes provide useful insights for analyzing your API requests. A clear analysis can be obtained by observing the specific actions and associated context within each request/response. This is where span and resource attributes play a significant role.
#### Span Attributes
A span is a named, timed operation that represents an operation. Multiple spans represent different parts of the workflow and are pieced together to create a trace. While each span includes a duration indicating how long the operation took, the span attributes provide additional contextual metadata.
Span attributes are key-value pairs that provide contextual metadata for individual spans. Tyk automatically sets the following span attributes:
* `tyk.api.name`: API name.
* `tyk.api.orgid`: Organization ID.
* `tyk.api.id`: API ID.
* `tyk.api.path`: API listen path.
* `tyk.api.tags`: If tagging is enabled in the API definition, the tags are added here.
* `tyk.api.apikey.alias`: The identity alias of the authenticated client. Populated for APIs using JWT authentication or multi-auth (compliant mode).
#### Resource Attributes
Resource attributes provide contextual information about the entity that produced the telemetry data. Tyk exposes following resource attributes:
#### Service Attributes
The service attributes supported by Tyk are:
| Attribute | Type | Description |
| :------------------------------------ | :-------- | :----------------------------------------------------------------------------------------------- |
| `service.name` | String | Service name for Tyk API Gateway: `tyk-gateway` |
| `service.instance.id` and `tyk.gw.id` | String | The Node ID assigned to the gateway. Example `solo-6b71c2de-5a3c-4ad3-4b54-d34d78c1f7a3` |
| `service.version` | String | Represents the service version. Example `v5.2.0` |
| `tyk.gw.dataplane` | Bool | Whether the Tyk Gateway is hybrid (`slave_options.use_rpc=true`) |
| `tyk.gw.group.id` | String | Represents the `slave_options.group_id` of the gateway. Populated only if the gateway is hybrid. |
| `tyk.gw.tags` | \[]String | Represents the gateway `segment_tags`. Populated only if the gateway is segmented. |
By understanding and using these resource attributes, you can gain better insights into the performance of your API Gateways.
#### Common HTTP Span Attributes
Tyk follows the OpenTelemetry semantic conventions for HTTP spans. You can find detailed information on common attributes [here](https://github.com/open-telemetry/semantic-conventions/blob/main/docs/http/http-spans.md#common-attributes).
Some of these common attributes include:
* `http.method`: HTTP request method.
* `http.scheme`: URL scheme.
* `http.status_code`: HTTP response status code.
* `http.url`: Full HTTP request URL.
For the full list and details, refer to the official [OpenTelemetry Semantic Conventions](https://github.com/open-telemetry/semantic-conventions/blob/main/docs/http/http-spans.md#common-attributes).
### Advanced OpenTelemetry Capabilities
#### Context Propagation
This setting allows you to specify the type of context propagator to use for trace data. It's essential for ensuring compatibility and data integrity between different services in your architecture. The available options are:
* **tracecontext**: Supports the [W3C Trace Context](https://www.w3.org/TR/trace-context/) format. This is the default.
* **b3**: Serializes `SpanContext` to/from the B3 multi-header format. [More information](https://github.com/openzipkin/b3-propagation).
* **custom**: Reads the trace ID from a custom header (set via `custom_trace_header`) and writes it back to that same custom header only. No standard headers are written to upstream.
* **composite**: Reads the trace ID from a custom header (priority) or standard headers (fallback), and writes **both** the custom header and the standard `traceparent` header to upstream.
`custom` and `composite` are available from Tyk Gateway v5.12.0 and require `custom_trace_header` to be set.
The default setting is `tracecontext`. To configure this setting, you have two options:
* **Environment Variable**: Use `TYK_GW_OPENTELEMETRY_CONTEXTPROPAGATION` to specify the context propagator type.
* **Configuration File**: Navigate to the `opentelemetry.context_propagation` field in your configuration file to set your preferred option.
#### Custom Trace Header
If your upstream systems use a proprietary correlation header (for example, `X-Correlation-ID`), set `custom_trace_header` to that header name. The behavior depends on `context_propagation`:
**Tracecontext mode** (`tracecontext` + `custom_trace_header`) — reads from the custom header (with fallback to `traceparent`), writes only the standard `traceparent` header to upstream.
```json theme={null}
{
"opentelemetry": {
"enabled": true,
"context_propagation": "tracecontext",
"custom_trace_header": "X-Correlation-ID"
}
}
```
**Custom mode** (`custom` + `custom_trace_header`) — reads from and writes to the custom header only. No standard headers are involved.
```json theme={null}
{
"opentelemetry": {
"enabled": true,
"context_propagation": "custom",
"custom_trace_header": "X-Correlation-ID"
}
}
```
**Composite mode** (`composite` + `custom_trace_header`) — reads from the custom header (priority) or standard headers (fallback), and writes both the custom header and `traceparent` to upstream.
```json theme={null}
{
"opentelemetry": {
"enabled": true,
"context_propagation": "composite",
"custom_trace_header": "X-Correlation-ID"
}
}
```
In all modes, if the custom header is absent from the incoming request, the gateway falls back to standard headers or generates a new trace ID. The custom header is never generated if it wasn't present in the original request.
#### Sampling Strategies
Tyk supports configuring the following sampling strategies via the Sampling configuration structure:
##### Sampling Type
This setting dictates the sampling policy that OpenTelemetry uses to decide if a trace should be sampled for analysis. The decision is made at the start of a trace and applies throughout its lifetime. By default, the setting is `AlwaysOn`.
To customize, you can either set the `TYK_GW_OPENTELEMETRY_SAMPLING_TYPE` environment variable or modify the `opentelemetry.sampling.type` field in the Tyk Gateway configuration file. Valid values for this setting are:
* **AlwaysOn**: All traces are sampled.
* **AlwaysOff**: No traces are sampled.
* **TraceIDRatioBased**: Samples traces based on a specified ratio.
##### Sampling Rate
This field is crucial when the `Type` is configured to `TraceIDRatioBased`. It defines the fraction of traces that OpenTelemetry will aim to sample, and accepts a value between 0.0 and 1.0. For example, a `Rate` set to 0.5 implies that approximately 50% of the traces will be sampled. The default value is 0.5. To configure this setting, you have the following options:
* **Environment Variable**: Use `TYK_GW_OPENTELEMETRY_SAMPLING_RATE`.
* **Configuration File**: Update the `opentelemetry.sampling.rate` field in the configuration file.
##### ParentBased Sampling
This option is useful for ensuring the sampling consistency between parent and child spans. Specifically, if a parent span is sampled, all it's child spans will be sampled as well. This setting is particularly effective when used with `TraceIDRatioBased`, as it helps to keep the entire transaction story together. Using `ParentBased` with `AlwaysOn` or `AlwaysOff` may not be as useful, since in these cases, either all or no spans are sampled. The default value is `false`. Configuration options include:
* **Environment Variable**: Use `TYK_GW_OPENTELEMETRY_SAMPLING_PARENTBASED`.
* **Configuration File**: Update the `opentelemetry.sampling.parent_based` field in the configuration file.
#### Span Processor Configuration
When using `span_processor_type: batch` (the default), you can tune the batch processor to prevent span loss under high traffic. Use the `span_batch_config` block to configure the following fields:
* `max_queue_size` — maximum number of spans buffered before export (default: `2048`)
* `max_export_batch_size` — maximum number of spans per export batch (default: `512`)
* `batch_timeout` — seconds to wait before forcing an export (default: `5`)
```json theme={null}
{
"opentelemetry": {
"enabled": true,
"span_processor_type": "batch",
"span_batch_config": {
"max_queue_size": 8192,
"max_export_batch_size": 1024,
"batch_timeout": 3
}
}
}
```
Increase `max_queue_size` and `max_export_batch_size` in high-throughput environments where spans are being dropped before they can be exported.
### OpenTelemetry Backends for Tracing
#### Datadog
This guide explains how to configure Tyk API Gateway and the OpenTelemetry Collector to collect distributed traces in Datadog. It follows the reference documentation from [Datadog](https://docs.datadoghq.com/opentelemetry/otel_collector_datadog_exporter/?tab=onahost).
While this tutorial demonstrates using an OpenTelemetry Collector running in Docker, the core concepts remain consistent regardless of how and where the OpenTelemetry collector is deployed.
Whether you're using Tyk API Gateway in an open-source (OSS) or commercial deployment, the configuration options remain identical.
##### Prerequisites
* [Docker installed on your machine](https://docs.docker.com/get-docker/)
* Tyk Gateway v5.2.0 or higher
* OpenTelemetry Collector Contrib [docker image](https://hub.docker.com/r/otel/opentelemetry-collector-contrib). Make sure to use the Contrib distribution of the OpenTelemetry Collector as it is required for the [Datadog exporter](https://github.com/open-telemetry/opentelemetry-collector-contrib/tree/main/exporter/datadogexporter).
##### Steps for Configuration
1. **Configure the OpenTelemetry Collector**
You will need:
* An [API key from Datadog](https://docs.datadoghq.com/account_management/api-app-keys/#add-an-api-key-or-client-token). For example, `6c35dacbf2e16aa8cda85a58d9015c3c`.
* Your [Datadog site](https://docs.datadoghq.com/getting_started/site/#access-the-datadog-site). Examples are: `datadoghq.com`, `us3.datadoghq.com` and `datadoghq.eu`.
Create a new YAML configuration file named `otel-collector.yml` with the following content:
```yaml theme={null}
receivers:
otlp:
protocols:
grpc:
endpoint: 0.0.0.0:4317
processors:
batch:
send_batch_max_size: 100
send_batch_size: 10
timeout: 10s
exporters:
datadog:
api:
site: "YOUR-DATADOG-SITE"
key: "YOUR-DATAGOG-API-KEY"
service:
pipelines:
traces:
receivers: [otlp]
processors: [batch]
exporters: [datadog]
```
2. **Configure a test API**
If you don't have any APIs configured yet, create a subdirectory called `apps` in the current directory. Create a new file `apidef-hello-world.json` and copy this very simple API definition for testing purposes:
```json theme={null}
{
"name": "Hello-World",
"slug": "hello-world",
"api_id": "Hello-World",
"org_id": "1",
"use_keyless": true,
"detailed_tracing": true,
"version_data": {
"not_versioned": true,
"versions": {
"Default": {
"name": "Default",
"use_extended_paths": true
}
}
},
"proxy": {
"listen_path": "/hello-world/",
"target_url": "http://httpbin.org/",
"strip_listen_path": true
},
"active": true
}
```
3. **Create the Docker-Compose file**
Save the following YAML configuration to a file named `docker-compose.yml`.
```yaml theme={null}
version: "2"
services:
# OpenTelemetry Collector Contrib
otel-collector:
image: otel/opentelemetry-collector-contrib:latest
volumes:
- ./otel-collector.yml:/etc/otel-collector.yml
command: ["--config=/etc/otel-collector.yml"]
ports:
- "4317" # OTLP gRPC receiver
networks:
- tyk
# Tyk API Gateway, open-source deployment
tyk:
image: tykio/tyk-gateway:v5.2
ports:
- 8080:8080
environment:
- TYK_GW_OPENTELEMETRY_ENABLED=true
- TYK_GW_OPENTELEMETRY_EXPORTER=grpc
- TYK_GW_OPENTELEMETRY_ENDPOINT=otel-collector:4317
volumes:
- ./apps:/opt/tyk-gateway/apps
depends_on:
- redis
networks:
- tyk
redis:
image: redis:4.0-alpine
ports:
- 6379:6379
command: redis-server --appendonly yes
networks:
- tyk
networks:
tyk:
```
To start the services, go to the directory that contains the docker-compose.yml file and run the following command:
```bash theme={null}
docker-compose up
```
4. **Explore OpenTelemetry traces in Datadog**
Begin by sending a few requests to the API endpoint configured in step 2:
` http://localhost:8080/hello-world/
`
Next, log in to Datadog and navigate to the 'APM' / 'Traces' section. Here, you should start observing traces generated by Tyk:
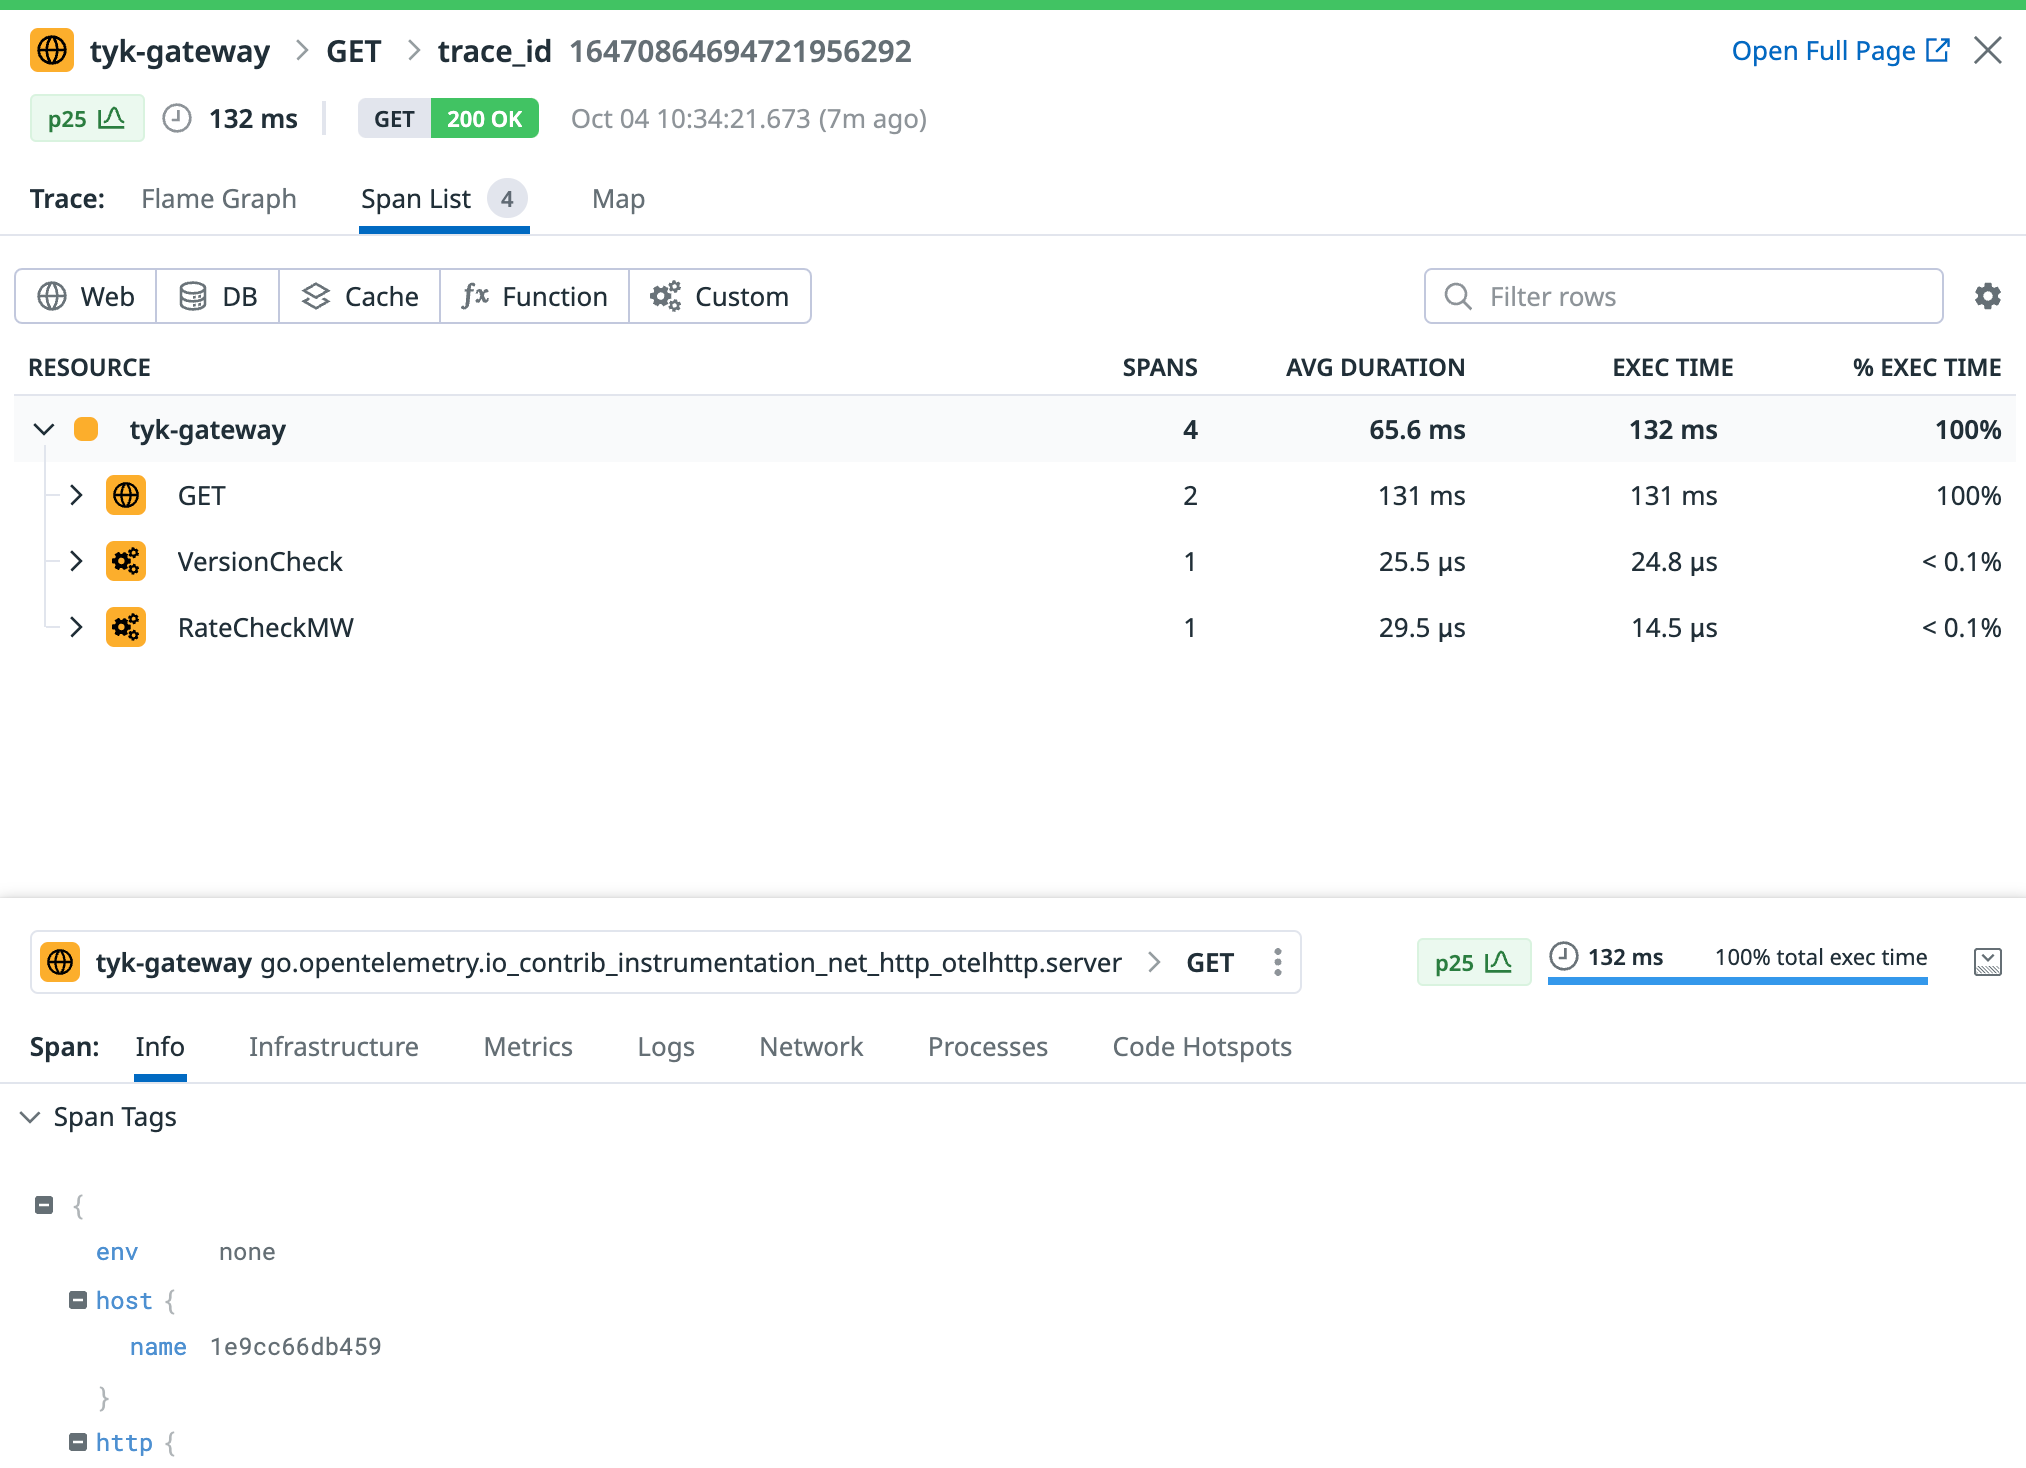
 Click on a trace to view all its internal spans:
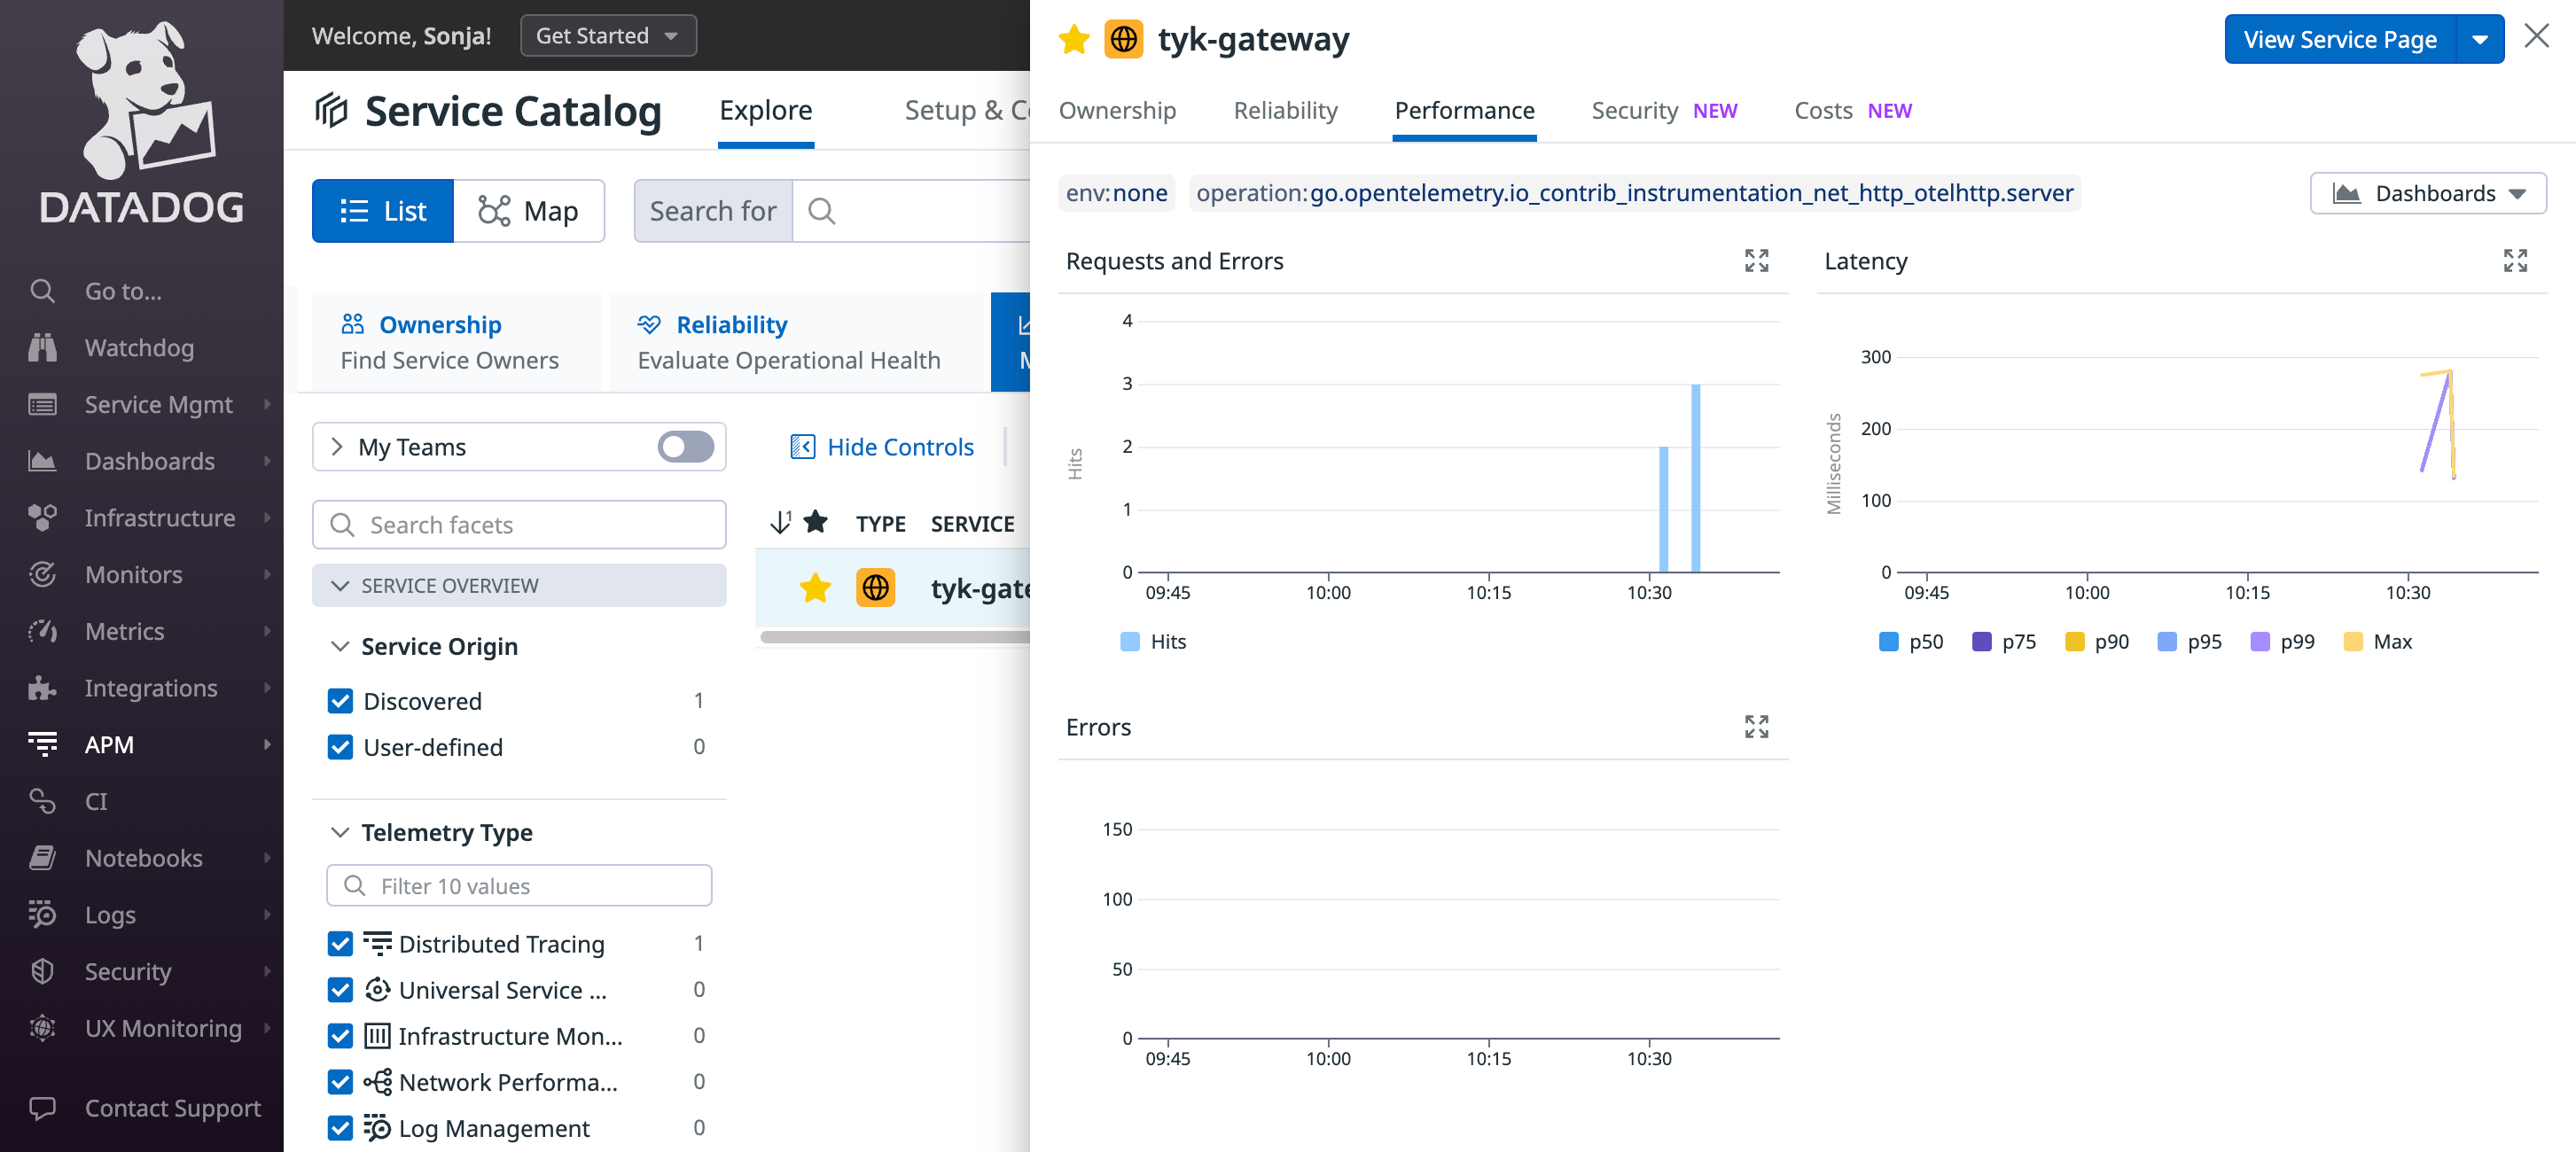
 Datadog will generate a service entry to monitor Tyk API Gateway and will automatically compute valuable metrics using the ingested traces.
 ##### Troubleshooting
If you do not observe any traces appearing in Datadog, consider the following steps for resolution:
* Logging: Examine logs from Tyk API Gateway and from the OpenTelemetry Collector for any issues or warnings that might provide insights.
* Data Ingestion Delays: Be patient, as there could be some delay in data ingestion. Wait for 10 seconds to see if traces eventually appear, as this is the timeout we have configured in the batch processing of the OpenTelemetry collector within step 1.
#### Dynatrace
This documentation covers how to set up Dynatrace to ingest OpenTelemetry traces via the OpenTelemetry Collector (OTel Collector) using Docker.
##### Prerequisites
* [Docker installed on your machine](https://docs.docker.com/get-docker/)
* [Dynatrace account](https://www.dynatrace.com/)
* Dynatrace Token
* Gateway v5.2.0 or higher
* OTel Collector [docker image](https://hub.docker.com/r/otel/opentelemetry-collector)
##### Steps for Configuration
1. **Generate Dynatrace Token**
1. In the Dynatrace console, navigate to access keys.
2. Click on *Create a new key*
3. You will be prompted to select a scope. Choose *Ingest OpenTelemetry* traces.
4. Save the generated token securely; it cannot be retrieved once lost.
Example of a generated token ([taken from Dynatrace website](https://www.dynatrace.com/support/help/dynatrace-api/basics/dynatrace-api-authentication#token-format-example)):
```bash theme={null}
dt0s01.ST2EY72KQINMH574WMNVI7YN.G3DFPBEJYMODIDAEX454M7YWBUVEFOWKPRVMWFASS64NFH52PX6BNDVFFM572RZM
```
2. **Configuration Files**
1. **OTel Collector Configuration File**
Create a YAML file named `otel-collector-config.yml`. In this file replace `` with the string from the address bar when you log into Dynatrace. Replace `` with the token you generated earlier.
Here's a sample configuration file:
```yaml theme={null}
receivers:
otlp:
protocols:
http:
endpoint: 0.0.0.0:4318
grpc:
endpoint: 0.0.0.0:4317
processors:
batch:
exporters:
otlphttp:
endpoint: "https://.live.dynatrace.com/api/v2/otlp"
headers:
Authorization: "Api-Token " # You must keep 'Api-Token', just modify
extensions:
health_check:
pprof:
endpoint: :1888
zpages:
endpoint: :55679
service:
extensions: [pprof, zpages, health_check]
pipelines:
traces:
receivers: [otlp]
processors: [batch]
exporters: [otlphttp]
```
2. **Docker Compose File**
Create a file named docker-compose.yml.
Here is the sample Docker Compose file:
```yaml theme={null}
version: "3.9"
services:
otel-collector:
image: otel/opentelemetry-collector:latest
volumes:
- ./configs/otel-collector-config.yml:/etc/otel-collector.yml
command: ["--config=/etc/otel-collector.yml"]
networks:
- tyk
ports:
- "1888:1888" # pprof extension
- "13133:13133" # health_check extension
- "4317:4317" # OTLP gRPC receiver
- "4318:4318" # OTLP http receiver
- "55670:55679" # zpages extension
networks:
tyk:
```
3. **Testing and Viewing Traces**
**1.** Launch the Docker containers: docker-compose up -d
**2.** Initialize your Tyk environment.
**3.** Configure a basic HTTP API on the Tyk Gateway or Dashboard.
**4.** Use cURL or Postman to send requests to the API gateway.
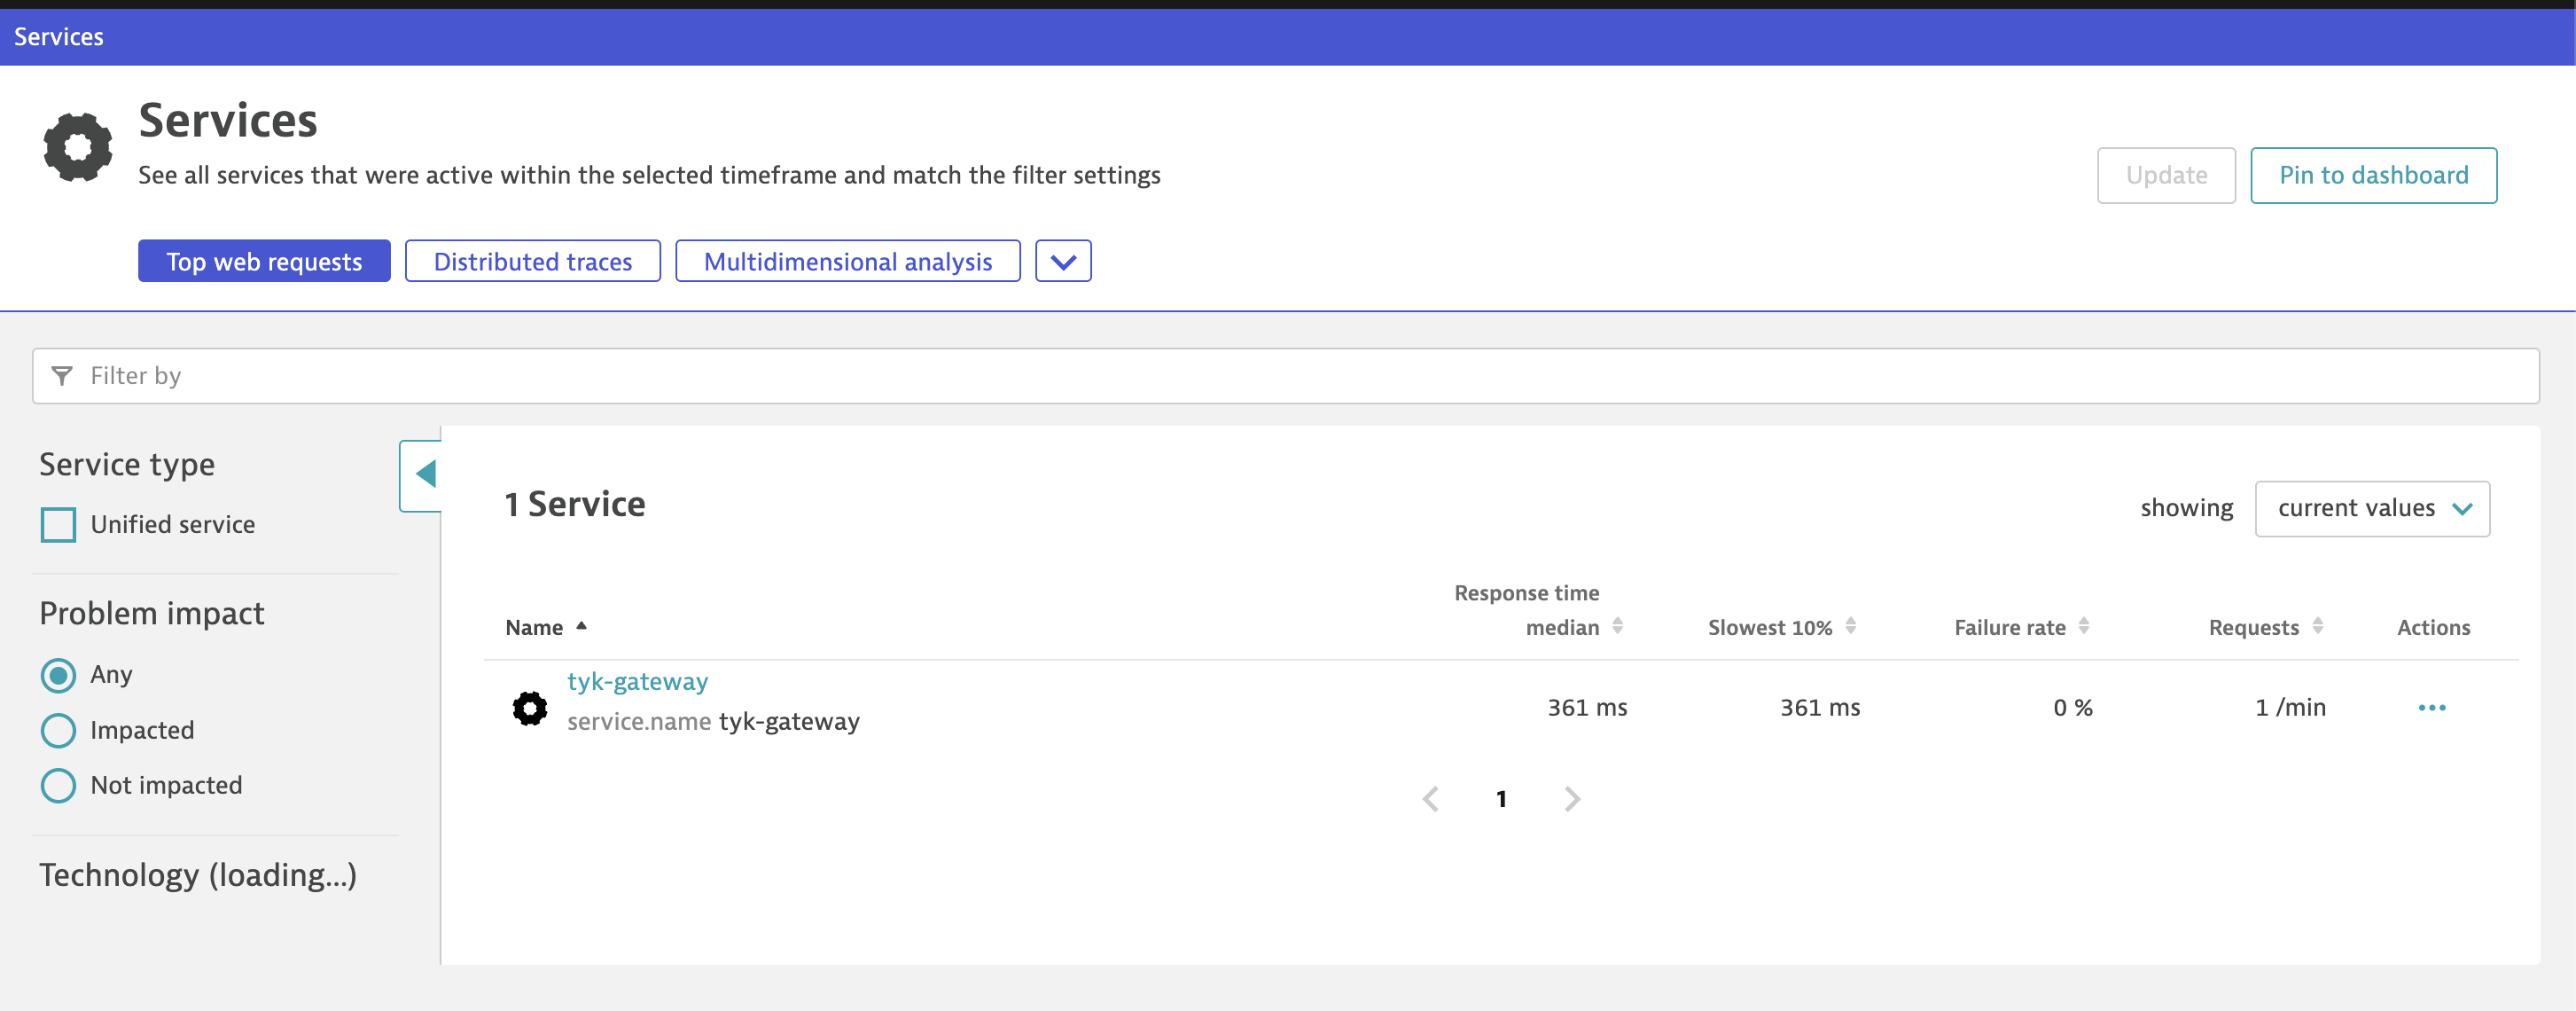
**5.** Navigate to Dynatrace -> Services -> Tyk-Gateway.
##### Troubleshooting
If you do not observe any traces appearing in Datadog, consider the following steps for resolution:
* Logging: Examine logs from Tyk API Gateway and from the OpenTelemetry Collector for any issues or warnings that might provide insights.
* Data Ingestion Delays: Be patient, as there could be some delay in data ingestion. Wait for 10 seconds to see if traces eventually appear, as this is the timeout we have configured in the batch processing of the OpenTelemetry collector within step 1.
#### Dynatrace
This documentation covers how to set up Dynatrace to ingest OpenTelemetry traces via the OpenTelemetry Collector (OTel Collector) using Docker.
##### Prerequisites
* [Docker installed on your machine](https://docs.docker.com/get-docker/)
* [Dynatrace account](https://www.dynatrace.com/)
* Dynatrace Token
* Gateway v5.2.0 or higher
* OTel Collector [docker image](https://hub.docker.com/r/otel/opentelemetry-collector)
##### Steps for Configuration
1. **Generate Dynatrace Token**
1. In the Dynatrace console, navigate to access keys.
2. Click on *Create a new key*
3. You will be prompted to select a scope. Choose *Ingest OpenTelemetry* traces.
4. Save the generated token securely; it cannot be retrieved once lost.
Example of a generated token ([taken from Dynatrace website](https://www.dynatrace.com/support/help/dynatrace-api/basics/dynatrace-api-authentication#token-format-example)):
```bash theme={null}
dt0s01.ST2EY72KQINMH574WMNVI7YN.G3DFPBEJYMODIDAEX454M7YWBUVEFOWKPRVMWFASS64NFH52PX6BNDVFFM572RZM
```
2. **Configuration Files**
1. **OTel Collector Configuration File**
Create a YAML file named `otel-collector-config.yml`. In this file replace `` with the string from the address bar when you log into Dynatrace. Replace `` with the token you generated earlier.
Here's a sample configuration file:
```yaml theme={null}
receivers:
otlp:
protocols:
http:
endpoint: 0.0.0.0:4318
grpc:
endpoint: 0.0.0.0:4317
processors:
batch:
exporters:
otlphttp:
endpoint: "https://.live.dynatrace.com/api/v2/otlp"
headers:
Authorization: "Api-Token " # You must keep 'Api-Token', just modify
extensions:
health_check:
pprof:
endpoint: :1888
zpages:
endpoint: :55679
service:
extensions: [pprof, zpages, health_check]
pipelines:
traces:
receivers: [otlp]
processors: [batch]
exporters: [otlphttp]
```
2. **Docker Compose File**
Create a file named docker-compose.yml.
Here is the sample Docker Compose file:
```yaml theme={null}
version: "3.9"
services:
otel-collector:
image: otel/opentelemetry-collector:latest
volumes:
- ./configs/otel-collector-config.yml:/etc/otel-collector.yml
command: ["--config=/etc/otel-collector.yml"]
networks:
- tyk
ports:
- "1888:1888" # pprof extension
- "13133:13133" # health_check extension
- "4317:4317" # OTLP gRPC receiver
- "4318:4318" # OTLP http receiver
- "55670:55679" # zpages extension
networks:
tyk:
```
3. **Testing and Viewing Traces**
**1.** Launch the Docker containers: docker-compose up -d
**2.** Initialize your Tyk environment.
**3.** Configure a basic HTTP API on the Tyk Gateway or Dashboard.
**4.** Use cURL or Postman to send requests to the API gateway.
**5.** Navigate to Dynatrace -> Services -> Tyk-Gateway.
 **6.** Wait for 5 minutes and refresh.
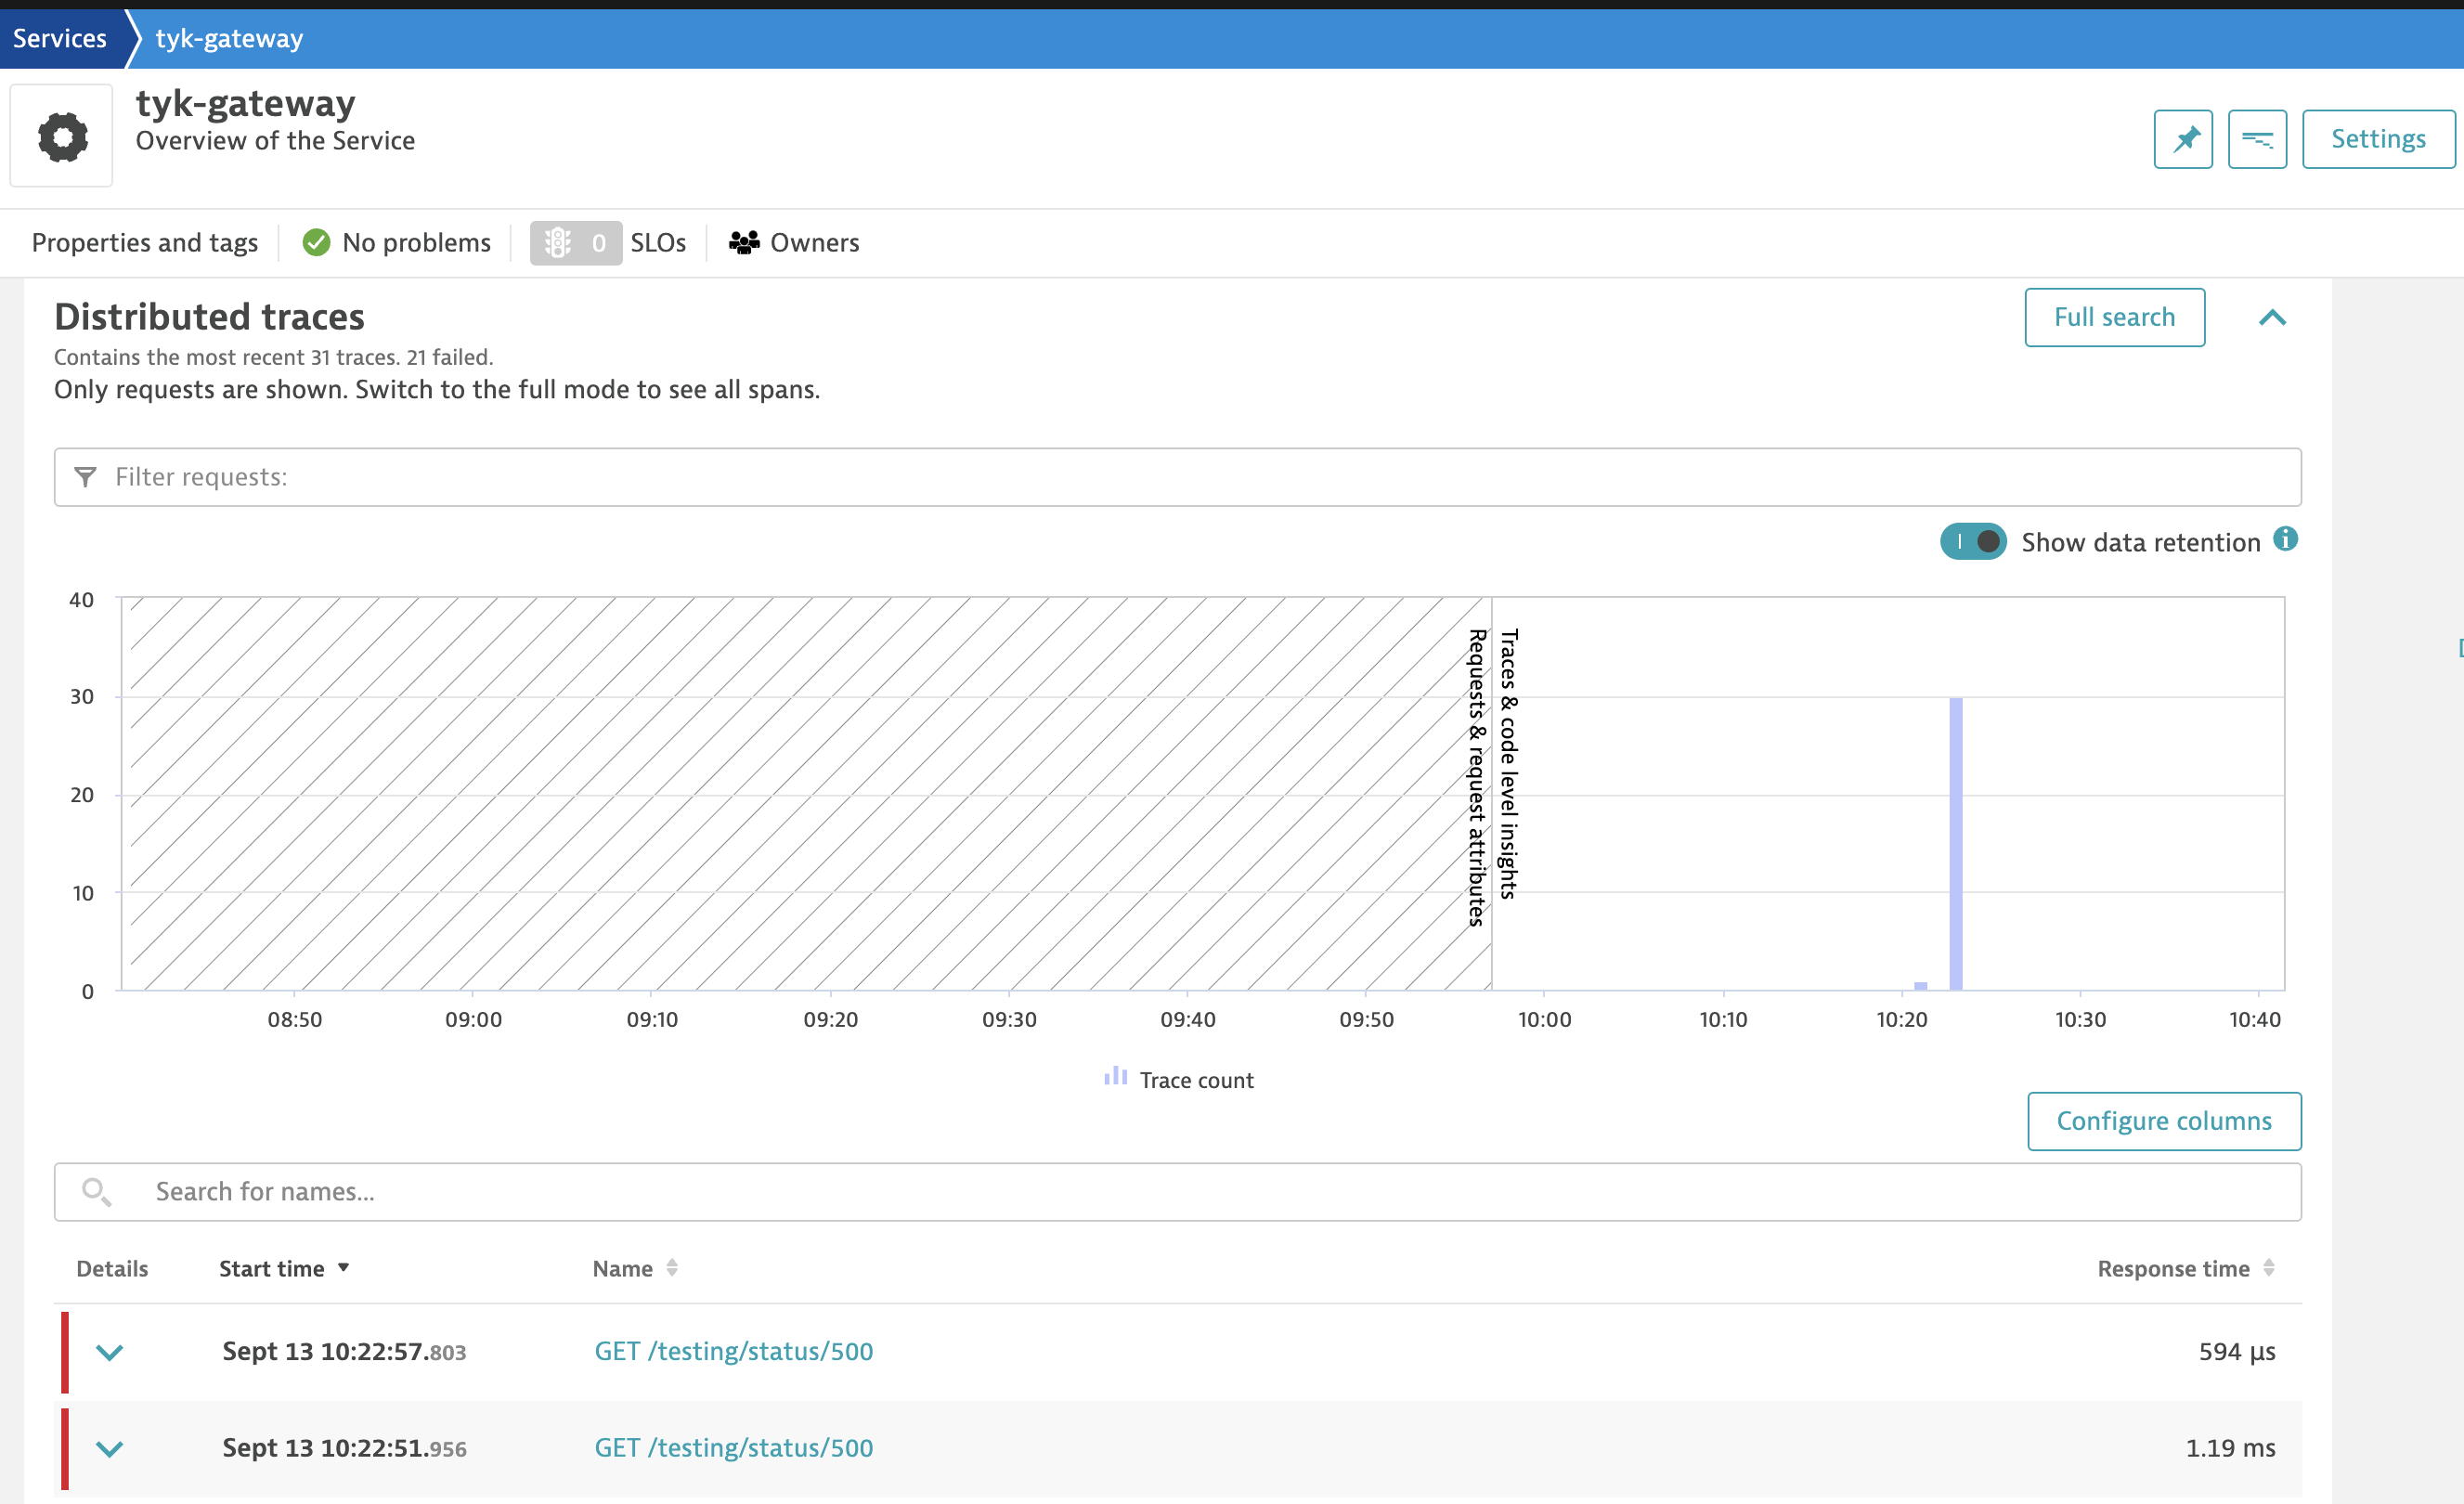
**7.** Traces, along with graphs, should appear. If they don't, click on the "Full Search" button.
**6.** Wait for 5 minutes and refresh.
**7.** Traces, along with graphs, should appear. If they don't, click on the "Full Search" button.
 4. **Troubleshooting**
* If traces are not appearing, try clicking on the "Full Search" button after waiting for 5 minutes.
Make sure your Dynatrace token is correct in the configuration files.
* Validate the Docker Compose setup by checking the logs for any errors: `docker-compose logs`
And there you have it! You've successfully integrated Dynatrace with the OpenTelemetry Collector using Docker.
#### Elasticsearch
This quick start explains how to configure Tyk API Gateway (OSS, self-managed or hybrid gateway connected to Tyk Cloud) with the OpenTelemetry Collector to export distributed traces to [Elasticsearch](https://www.elastic.co/observability).
##### Prerequisites
Ensure the following prerequisites are met before proceeding:
* Tyk Gateway v5.2 or higher
* OpenTelemetry Collector deployed locally
* Elasticsearch deployed locally or an account on Elastic Cloud with Elastic APM
Elastic Observability natively supports OpenTelemetry and its OpenTelemetry protocol (OTLP) to ingest traces, metrics, and logs.
4. **Troubleshooting**
* If traces are not appearing, try clicking on the "Full Search" button after waiting for 5 minutes.
Make sure your Dynatrace token is correct in the configuration files.
* Validate the Docker Compose setup by checking the logs for any errors: `docker-compose logs`
And there you have it! You've successfully integrated Dynatrace with the OpenTelemetry Collector using Docker.
#### Elasticsearch
This quick start explains how to configure Tyk API Gateway (OSS, self-managed or hybrid gateway connected to Tyk Cloud) with the OpenTelemetry Collector to export distributed traces to [Elasticsearch](https://www.elastic.co/observability).
##### Prerequisites
Ensure the following prerequisites are met before proceeding:
* Tyk Gateway v5.2 or higher
* OpenTelemetry Collector deployed locally
* Elasticsearch deployed locally or an account on Elastic Cloud with Elastic APM
Elastic Observability natively supports OpenTelemetry and its OpenTelemetry protocol (OTLP) to ingest traces, metrics, and logs.
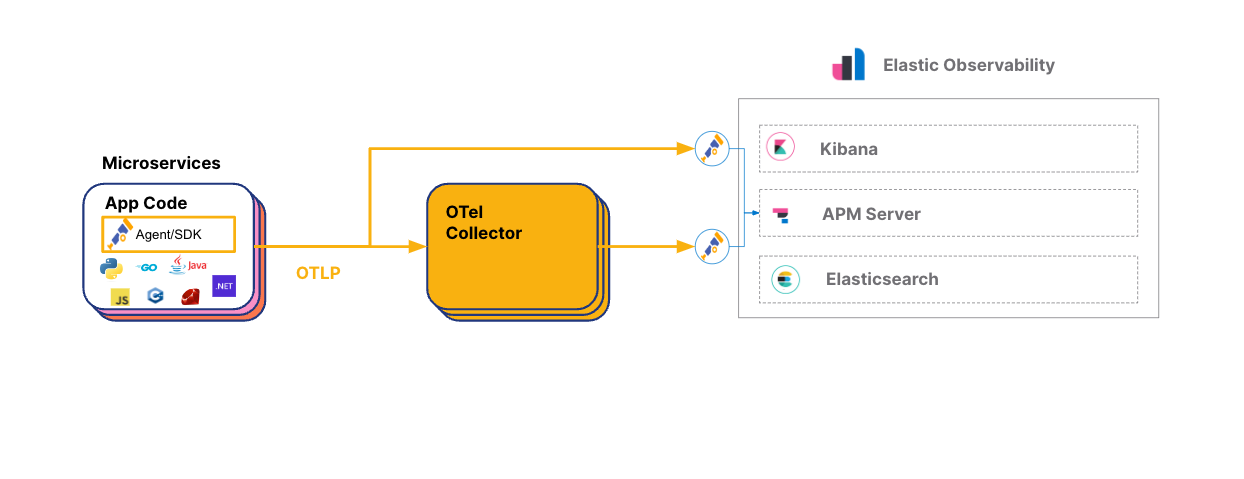 Credit: Elasticsearch, [OpenTelemetry on Elastic](https://www.elastic.co/blog/opentelemetry-observability)
##### Steps for Configuration
1. **Configure Tyk API Gateway**
To enable OpenTelemetry in Tyk API Gateway, follow these steps:
For Tyk Helm Charts:
* Add the following configuration to the Tyk Gateway section:
```yaml theme={null}
tyk-gateway:
gateway:
opentelemetry:
enabled: true
endpoint: {{Add your endpoint here}}
exporter: grpc
```
For Docker Compose:
* In your docker-compose.yml file for Tyk Gateway, add the following environment variables:
```yaml theme={null}
environment:
- TYK_GW_OPENTELEMETRY_ENABLED=true
- TYK_GW_OPENTELEMETRY_EXPORTER=grpc
- TYK_GW_OPENTELEMETRY_ENDPOINT={{Add your endpoint here}}
```
Make sure to replace `` with the appropriate endpoint from your OpenTelemetry collector.
After enabling OpenTelemetry at the Gateway level, you can activate [detailed tracing](/5.12/api-management/traces#opentelemetry) for specific APIs by editing their respective API definitions. Set the `detailed_tracing` option to either true or false. By default, this setting is false.
2. **Configure the OpenTelemetry Collector to Export to Elasticsearch**
To configure the OTel Collector with Elasticsearch Cloud, follow these steps:
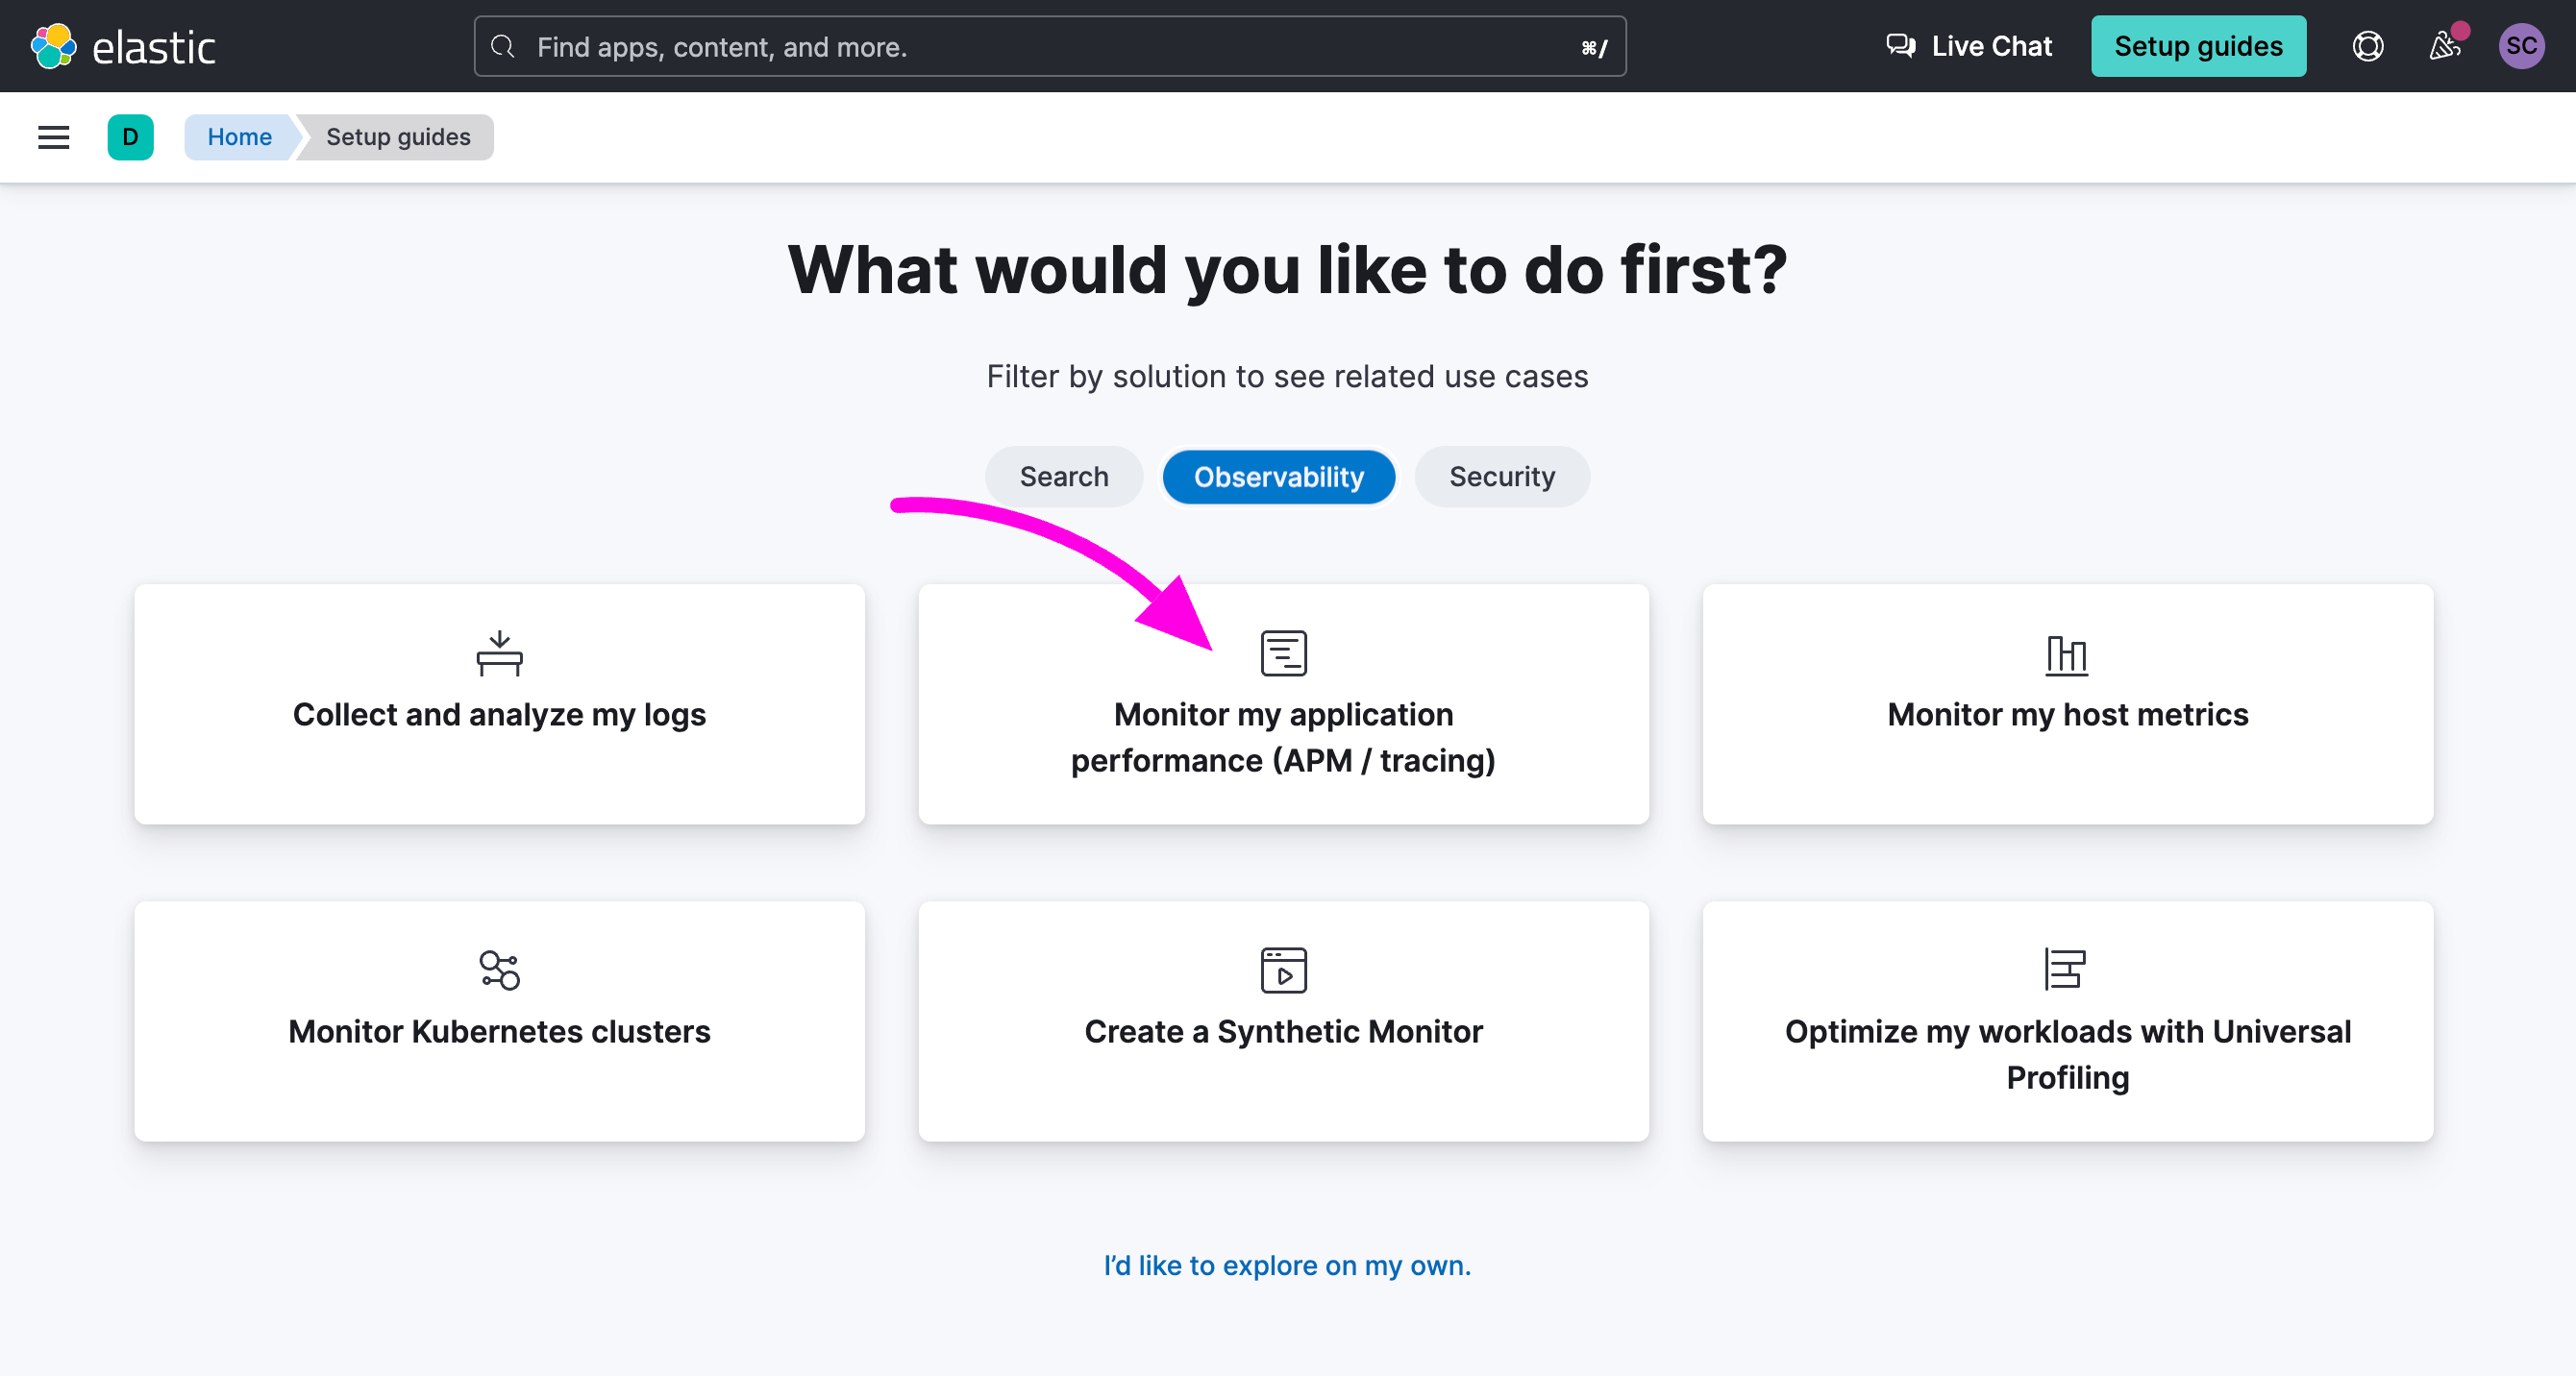
* Sign up for an [Elastic account](https://www.elastic.co/) if you haven't already
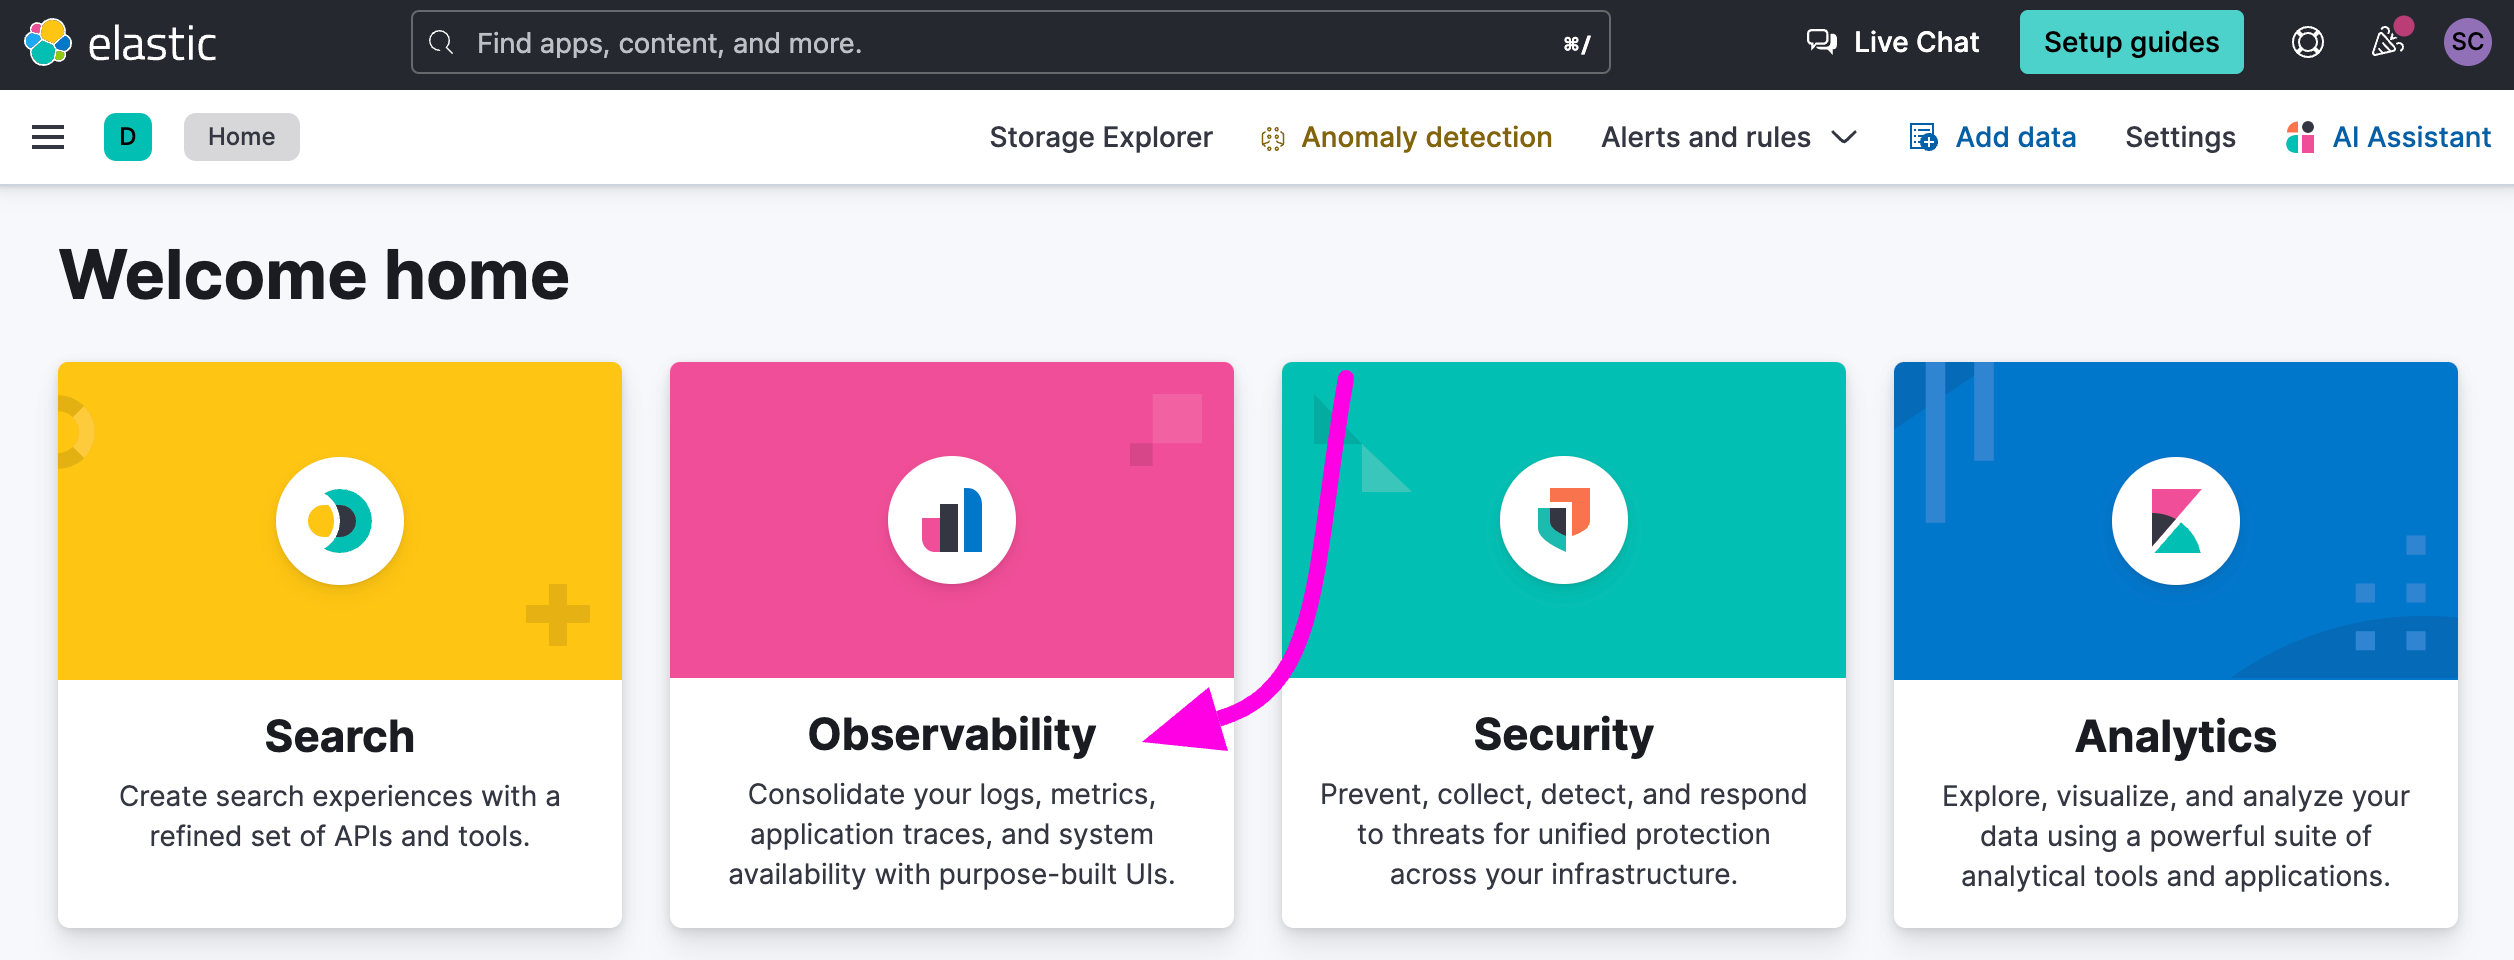
* Once logged in to your Elastic account, select "Observability" and click on the option "Monitor my application performance"
Credit: Elasticsearch, [OpenTelemetry on Elastic](https://www.elastic.co/blog/opentelemetry-observability)
##### Steps for Configuration
1. **Configure Tyk API Gateway**
To enable OpenTelemetry in Tyk API Gateway, follow these steps:
For Tyk Helm Charts:
* Add the following configuration to the Tyk Gateway section:
```yaml theme={null}
tyk-gateway:
gateway:
opentelemetry:
enabled: true
endpoint: {{Add your endpoint here}}
exporter: grpc
```
For Docker Compose:
* In your docker-compose.yml file for Tyk Gateway, add the following environment variables:
```yaml theme={null}
environment:
- TYK_GW_OPENTELEMETRY_ENABLED=true
- TYK_GW_OPENTELEMETRY_EXPORTER=grpc
- TYK_GW_OPENTELEMETRY_ENDPOINT={{Add your endpoint here}}
```
Make sure to replace `` with the appropriate endpoint from your OpenTelemetry collector.
After enabling OpenTelemetry at the Gateway level, you can activate [detailed tracing](/5.12/api-management/traces#opentelemetry) for specific APIs by editing their respective API definitions. Set the `detailed_tracing` option to either true or false. By default, this setting is false.
2. **Configure the OpenTelemetry Collector to Export to Elasticsearch**
To configure the OTel Collector with Elasticsearch Cloud, follow these steps:
* Sign up for an [Elastic account](https://www.elastic.co/) if you haven't already
* Once logged in to your Elastic account, select "Observability" and click on the option "Monitor my application performance"
 * Scroll down to the APM Agents section and click on the OpenTelemetry tab
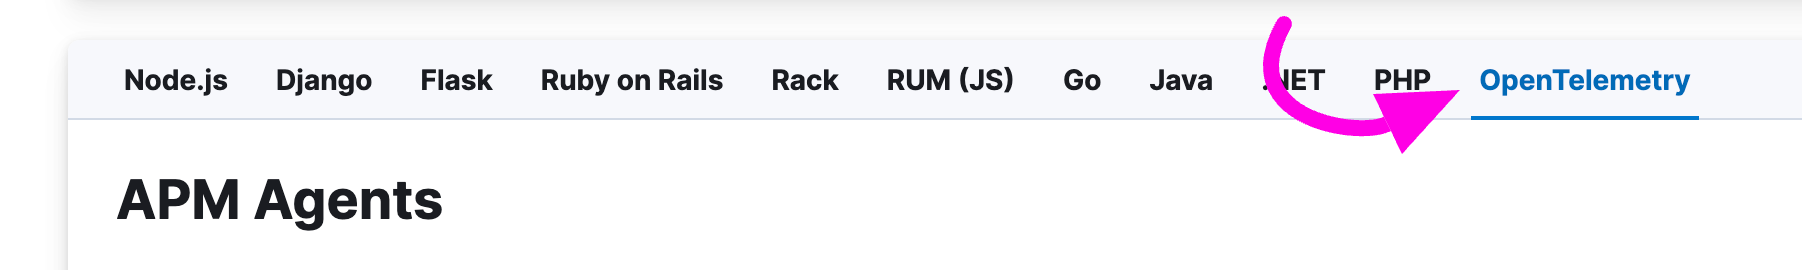 * Search for the section "Configure OpenTelemetry in your application". You will need to copy the value of "OTEL\_EXPORTER\_OTLP\_ENDPOINT" and "OTEL\_EXPORTER\_OTLP\_HEADERS" in your OpenTelemetry Collector configuration file.
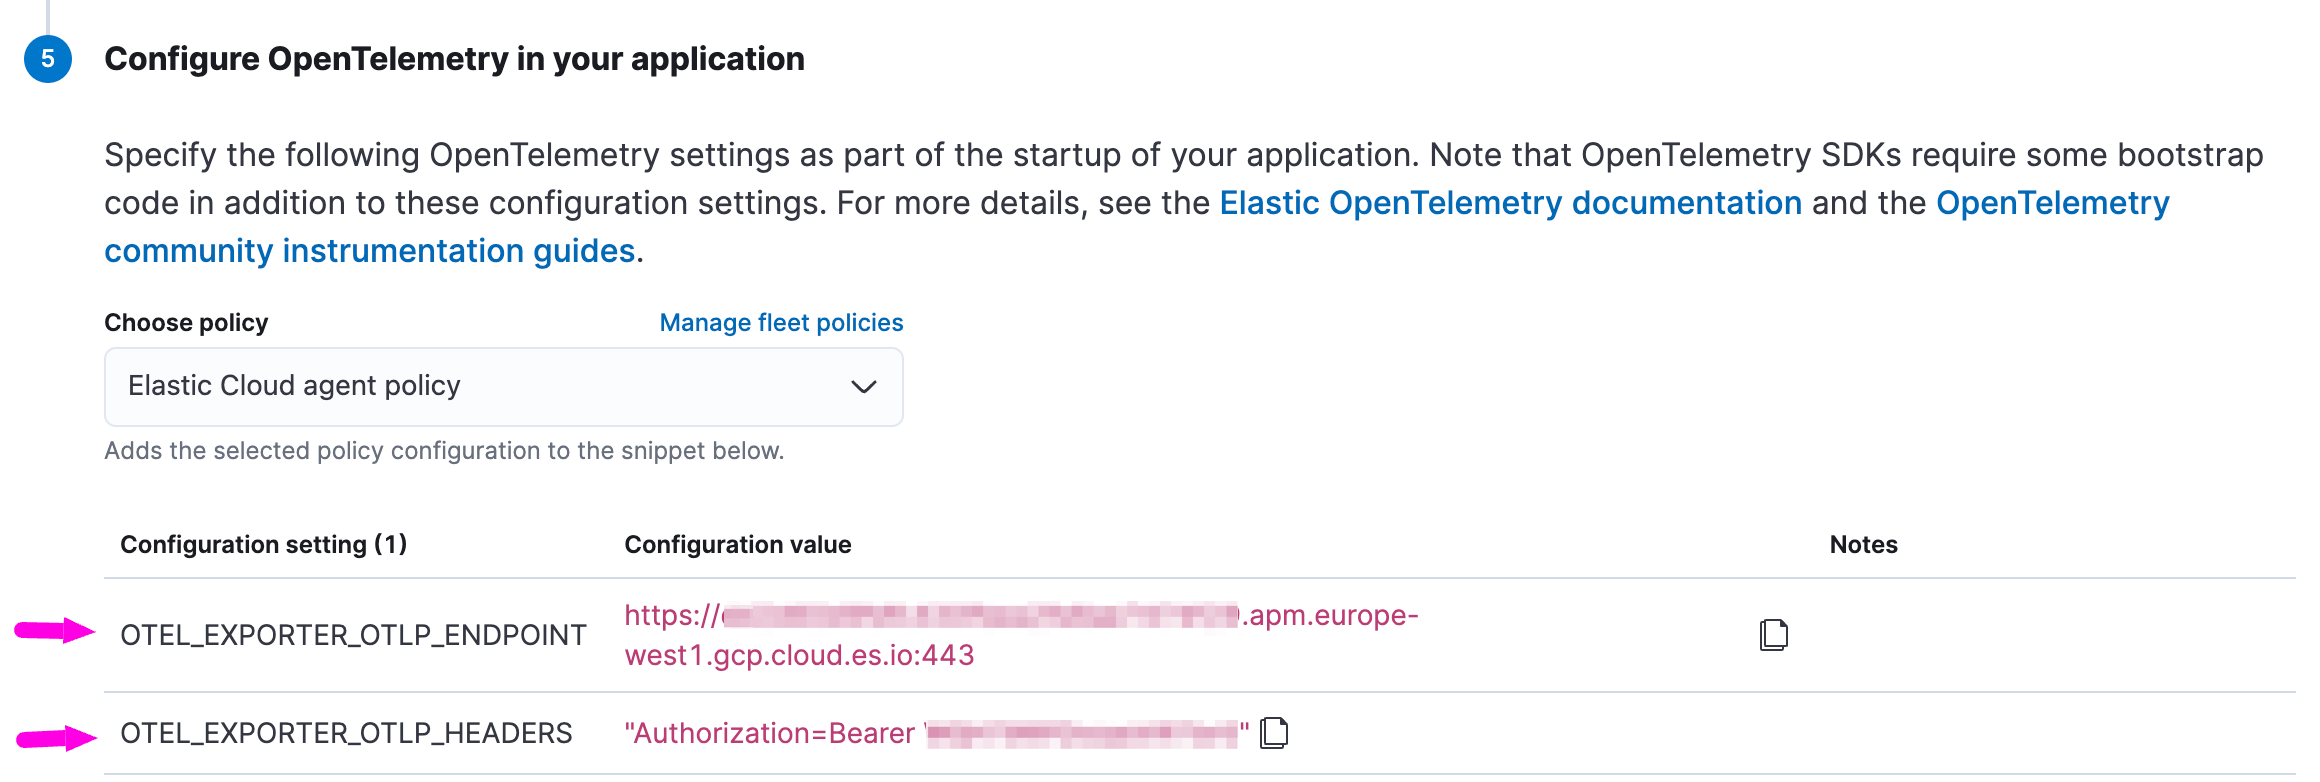 * Update your OpenTelemetry Collector configuration, here's a simple example:
```yaml theme={null}
receivers:
otlp:
protocols:
grpc:
endpoint: 0.0.0.0:4317 # OpenTelemetry receiver endpoint
processors:
batch:
exporters:
otlp/elastic:
endpoint: "ELASTIC_APM_SERVER_ENDPOINT_GOES_HERE" #exclude scheme, e.g. HTTPS:// or HTTP://
headers:
# Elastic APM Server secret token
Authorization: "Bearer ELASTIC_APM_SECRET_TOKEN_GOES_HERE"
service:
pipelines:
traces:
receivers: [otlp]
exporters: [otlp/elastic]
```
If are running Elasticsearch locally, you will need to use your APM Server endpoint (elastic-apm-server:8200) and set-up [a secret token authorization in ElasticSearch](https://www.elastic.co/guide/en/observability/current/secret-token.html).
You can refer to the [example configuration provided by Elastic](https://www.elastic.co/guide/en/observability/current/open-telemetry-direct.html#connect-open-telemetry-collector) for more guidance on the OpenTelemetry Collector configuration.
3. **Explore OpenTelemetry Traces in Elasticsearch**
* In Elasticsearch Cloud:
* Go to "Home" and select "Observability."
* Update your OpenTelemetry Collector configuration, here's a simple example:
```yaml theme={null}
receivers:
otlp:
protocols:
grpc:
endpoint: 0.0.0.0:4317 # OpenTelemetry receiver endpoint
processors:
batch:
exporters:
otlp/elastic:
endpoint: "ELASTIC_APM_SERVER_ENDPOINT_GOES_HERE" #exclude scheme, e.g. HTTPS:// or HTTP://
headers:
# Elastic APM Server secret token
Authorization: "Bearer ELASTIC_APM_SECRET_TOKEN_GOES_HERE"
service:
pipelines:
traces:
receivers: [otlp]
exporters: [otlp/elastic]
```
If are running Elasticsearch locally, you will need to use your APM Server endpoint (elastic-apm-server:8200) and set-up [a secret token authorization in ElasticSearch](https://www.elastic.co/guide/en/observability/current/secret-token.html).
You can refer to the [example configuration provided by Elastic](https://www.elastic.co/guide/en/observability/current/open-telemetry-direct.html#connect-open-telemetry-collector) for more guidance on the OpenTelemetry Collector configuration.
3. **Explore OpenTelemetry Traces in Elasticsearch**
* In Elasticsearch Cloud:
* Go to "Home" and select "Observability."
 * On the right menu, click on "APM / Services."
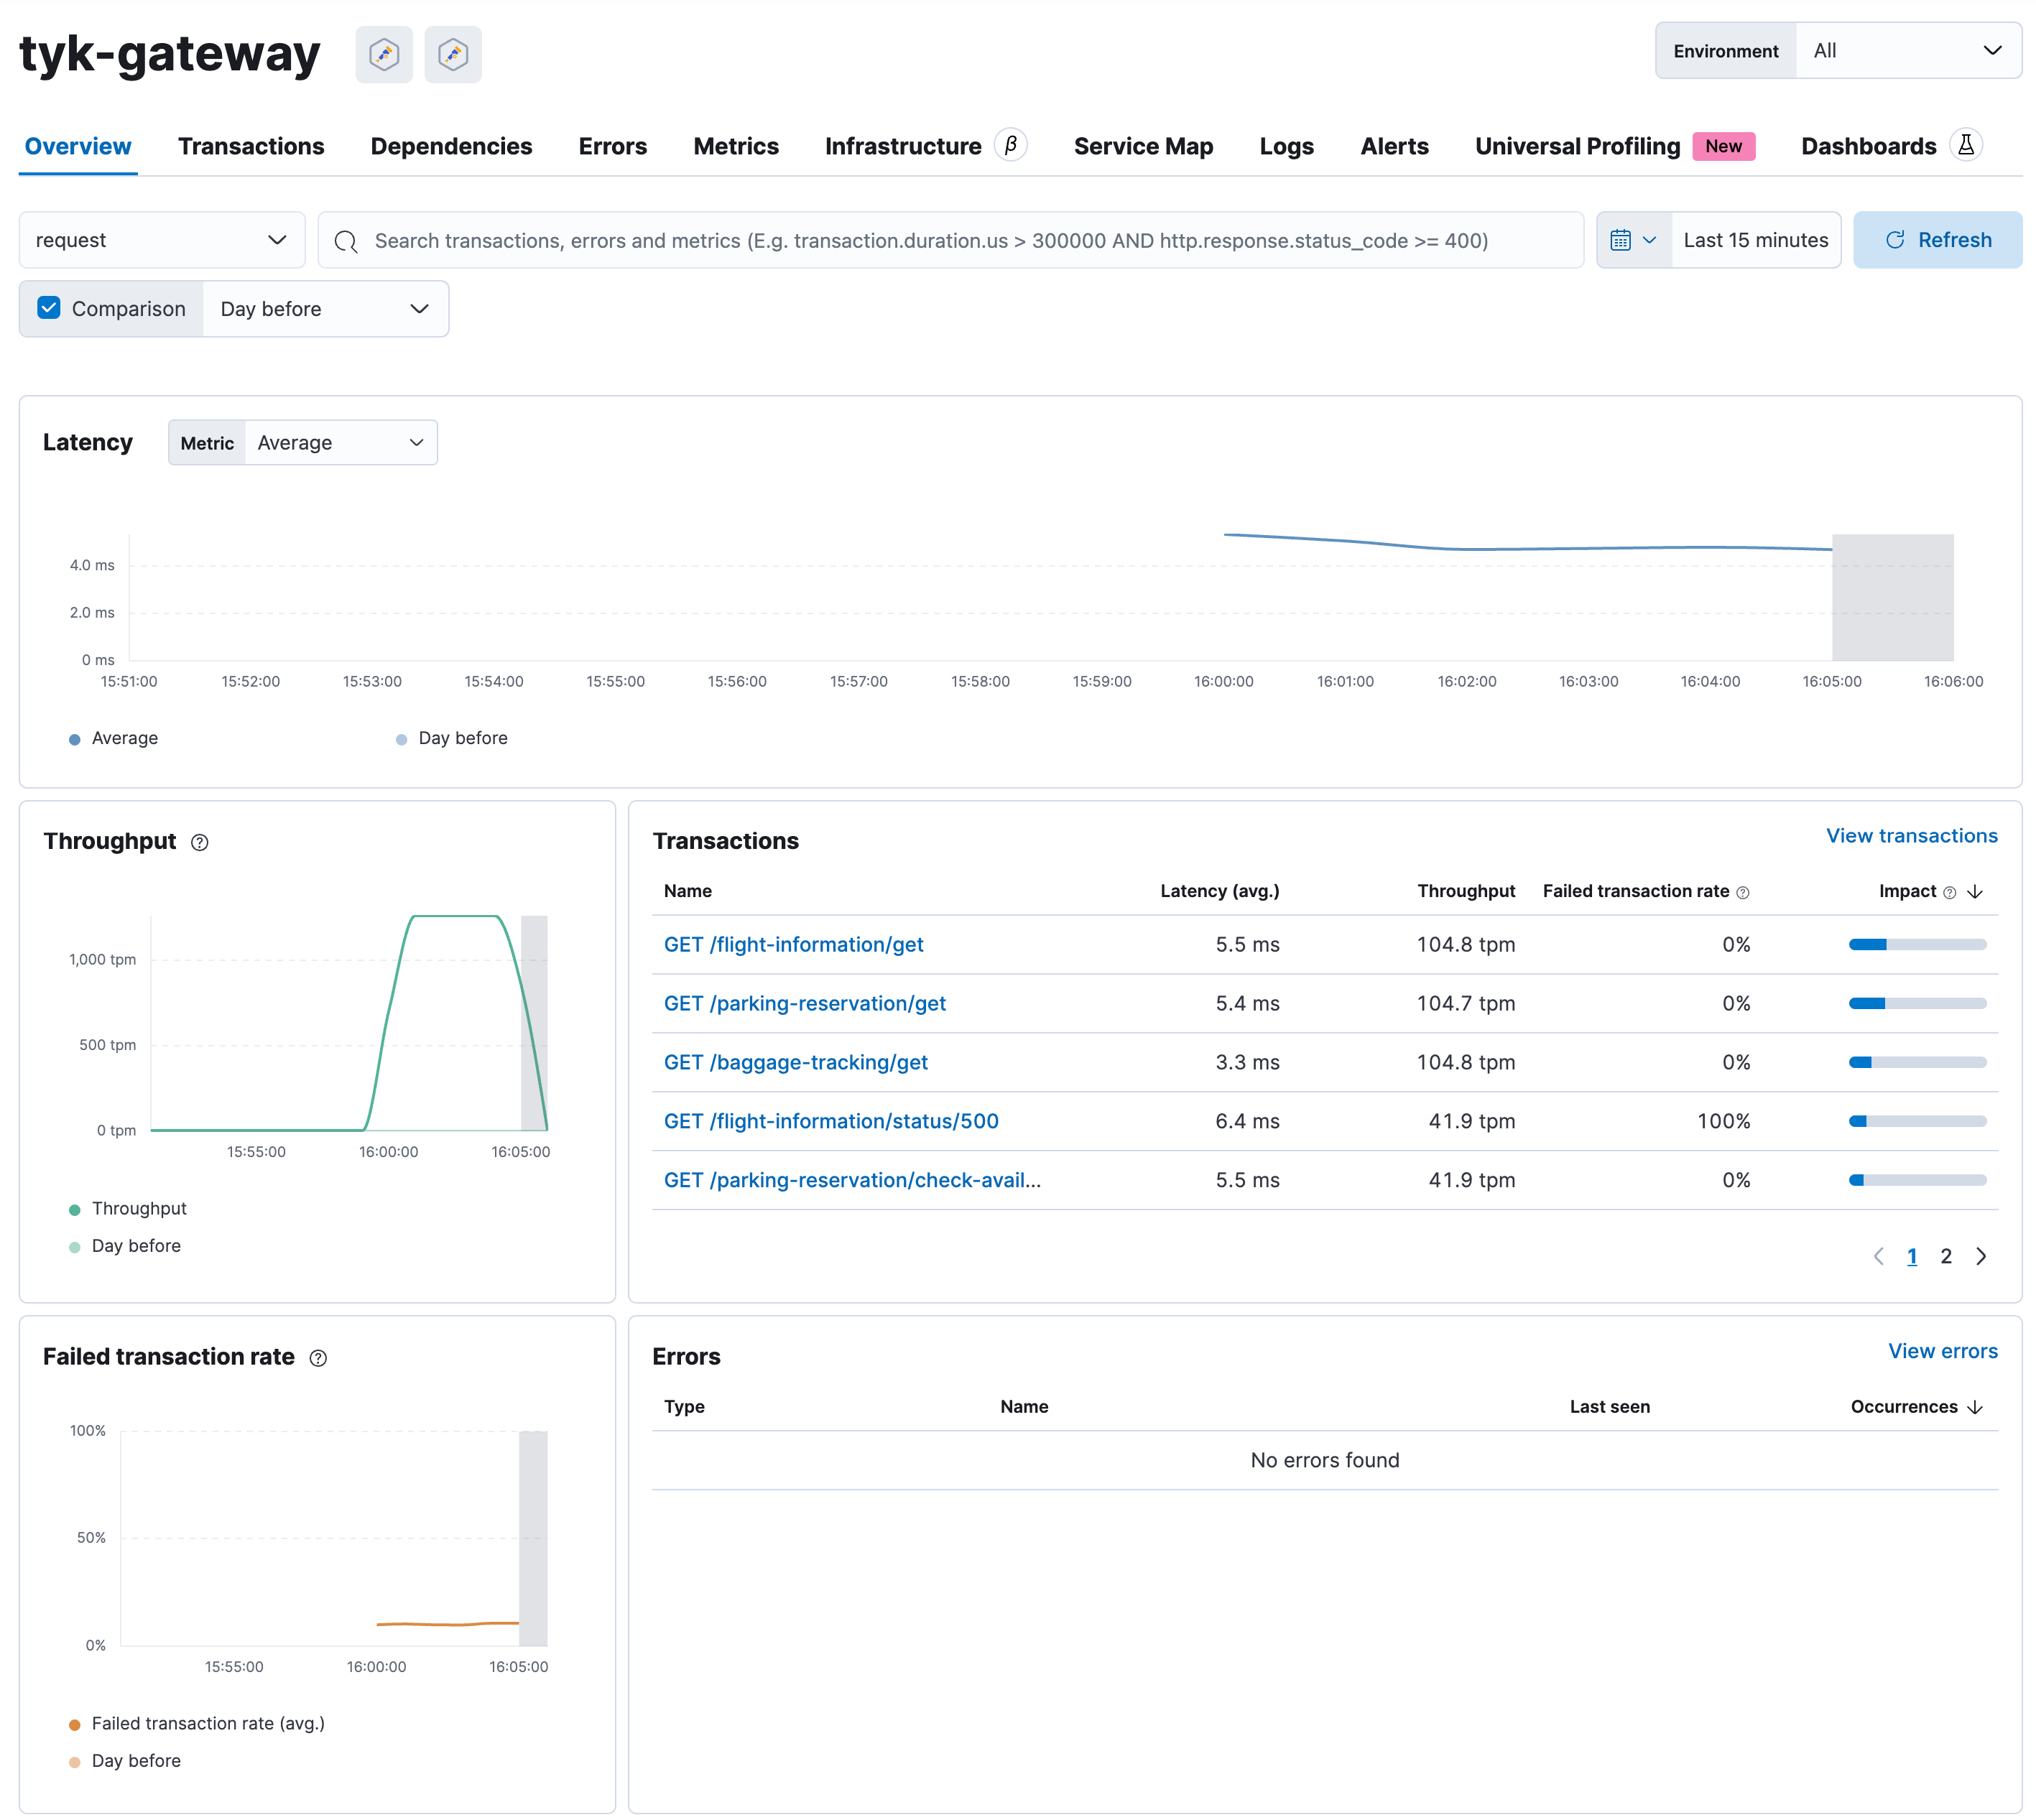
* Click on "tyk-gateway."
You will see a dashboard automatically generated based on the distributed traces sent by Tyk API Gateway to Elasticsearch.
* On the right menu, click on "APM / Services."
* Click on "tyk-gateway."
You will see a dashboard automatically generated based on the distributed traces sent by Tyk API Gateway to Elasticsearch.
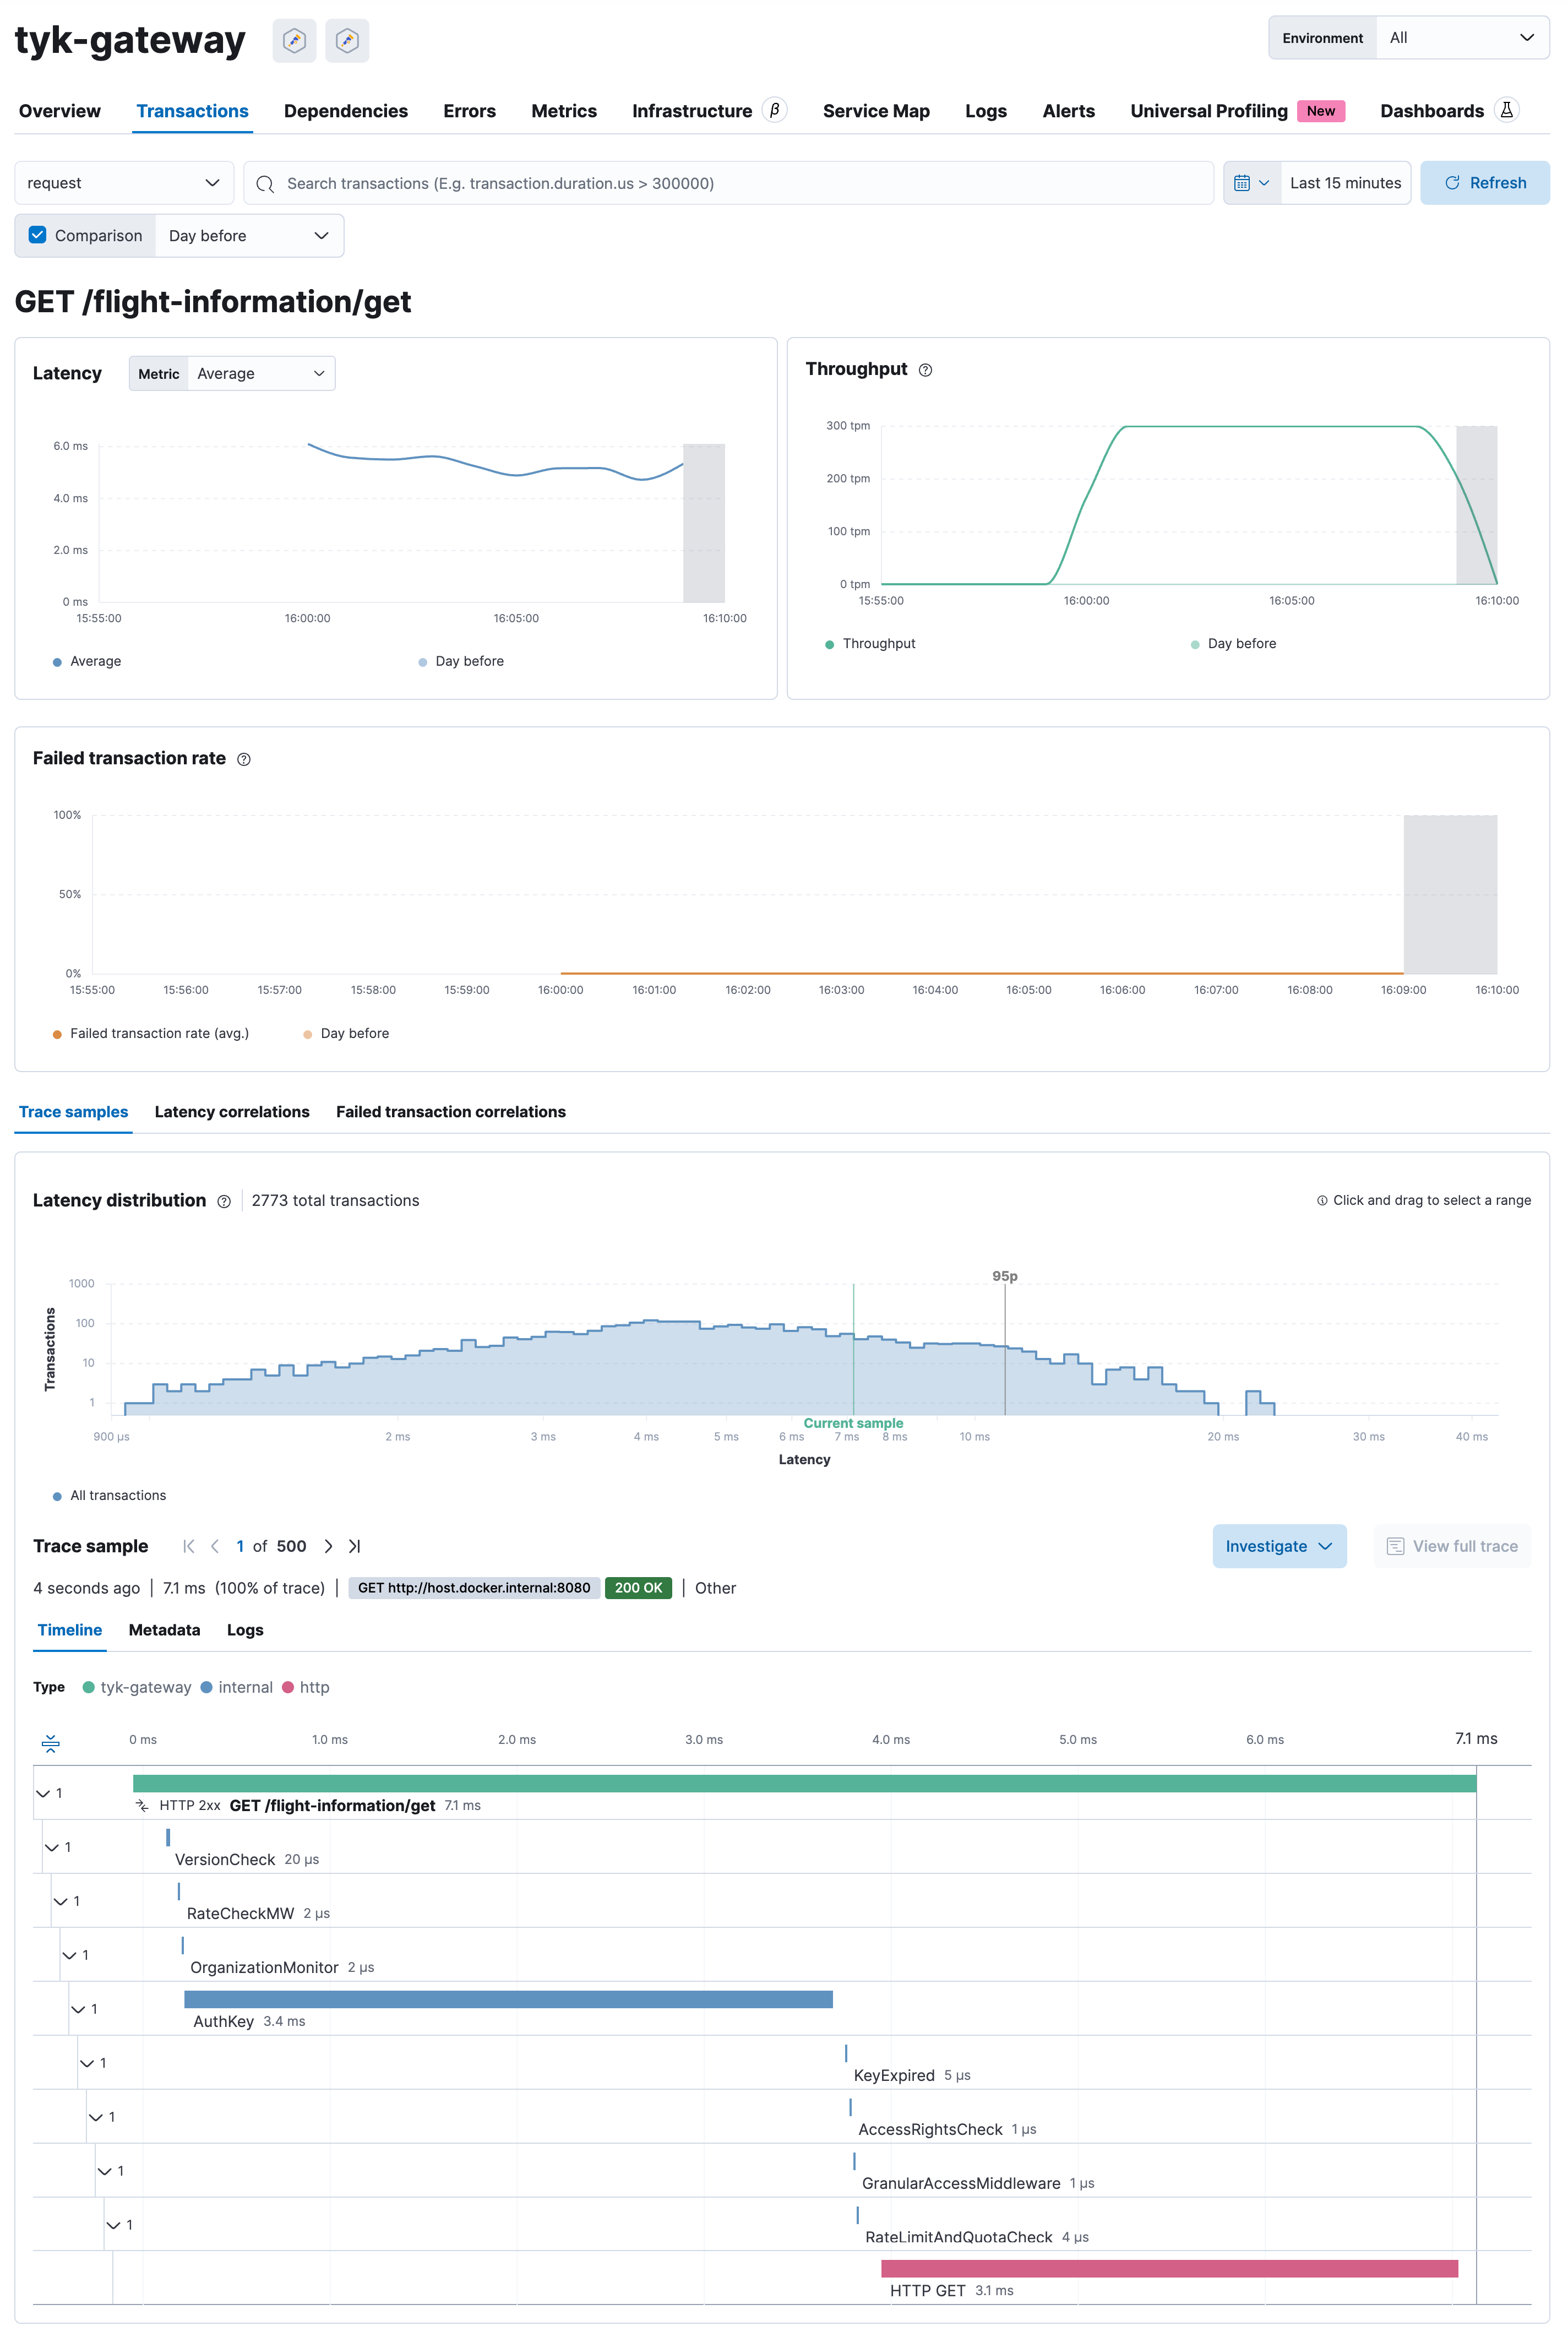
 Select a transaction to view more details, including the distributed traces:
 #### New Relic
This guide provides a step-by-step procedure to integrate New Relic with Tyk Gateway via the OpenTelemetry Collector. At the end of this guide, you will be able to visualize traces and metrics from your Tyk Gateway on the New Relic console.
##### Prerequisites
* [Docker installed on your machine](https://docs.docker.com/get-docker/)
* [New Relic Account](https://newrelic.com/)
* New Relic API Key
* Gateway v5.2.0 or higher
* OTel Collector [docker image](https://hub.docker.com/r/otel/opentelemetry-collector)
##### Steps for Configuration
1. **Obtain New Relic API Key**
1. Navigate to your New Relic Console.
2. Go to `Profile → API keys`.
3. Copy the key labeled as `INGEST-LICENSE`.
#### New Relic
This guide provides a step-by-step procedure to integrate New Relic with Tyk Gateway via the OpenTelemetry Collector. At the end of this guide, you will be able to visualize traces and metrics from your Tyk Gateway on the New Relic console.
##### Prerequisites
* [Docker installed on your machine](https://docs.docker.com/get-docker/)
* [New Relic Account](https://newrelic.com/)
* New Relic API Key
* Gateway v5.2.0 or higher
* OTel Collector [docker image](https://hub.docker.com/r/otel/opentelemetry-collector)
##### Steps for Configuration
1. **Obtain New Relic API Key**
1. Navigate to your New Relic Console.
2. Go to `Profile → API keys`.
3. Copy the key labeled as `INGEST-LICENSE`.
You can follow the [official New Relic documentation](https://docs.newrelic.com/docs/apis/intro-apis/new-relic-api-keys/) for more information.
**Example token:**
```bash theme={null}
93qwr27e49e168d3844c5h3d1e878a463f24NZJL
```
2. **Configuration Files**
**OTel Collector Configuration YAML**
1. Create a file named `otel-collector-config.yml` under the configs directory.
2. Copy the following template into that file:
```yaml theme={null}
receivers:
otlp:
protocols:
http:
endpoint: 0.0.0.0:4318
grpc:
endpoint: 0.0.0.0:4317
processors:
batch:
exporters:
otlphttp:
endpoint: ""
headers:
api-Key: ""
extensions:
health_check:
pprof:
endpoint: :1888
zpages:
endpoint: :55679
service:
extensions: [pprof, zpages, health_check]
pipelines:
traces:
receivers: [otlp]
processors: [batch]
exporters: [otlphttp]
```
* Replace `` with your specific New Relic endpoint (`https://otlp.nr-data.net` for US or `https://otlp.eu01.nr-data.net` for EU).
* Replace `` with the API key obtained in Step 1.
**Docker Compose configuration**
1. Create a file named docker-compose.yml at the root level of your project directory.
2. Paste the following code into that file:
```yaml theme={null}
version: "3.9"
services:
otel-collector:
image: otel/opentelemetry-collector:latest
volumes:
- ./otel-collector-config.yml:/etc/otel-collector.yml
command: ["--config=/etc/otel-collector.yml"]
networks:
- tyk
ports:
- "1888:1888" # pprof extension
- "13133:13133" # health_check extension
- "4317:4317" # OTLP gRPC receiver
- "4318:4318" # OTLP http receiver
- "55670:55679" # zpages extension
networks:
tyk:
```
Replace the variable fields with the relevant data.
3. **Testing and Verifying Traces**
1. Run `docker-compose up -d` to start all services.
2. Initialize your Tyk environment.
3. Create a simple `httpbin` API using Tyk Dashboard. You can follow the [Tyk Dashboard documentation](/5.12/api-management/gateway-config-managing-classic#create-an-api) for more information.
4. Send requests to the API using cURL or Postman.
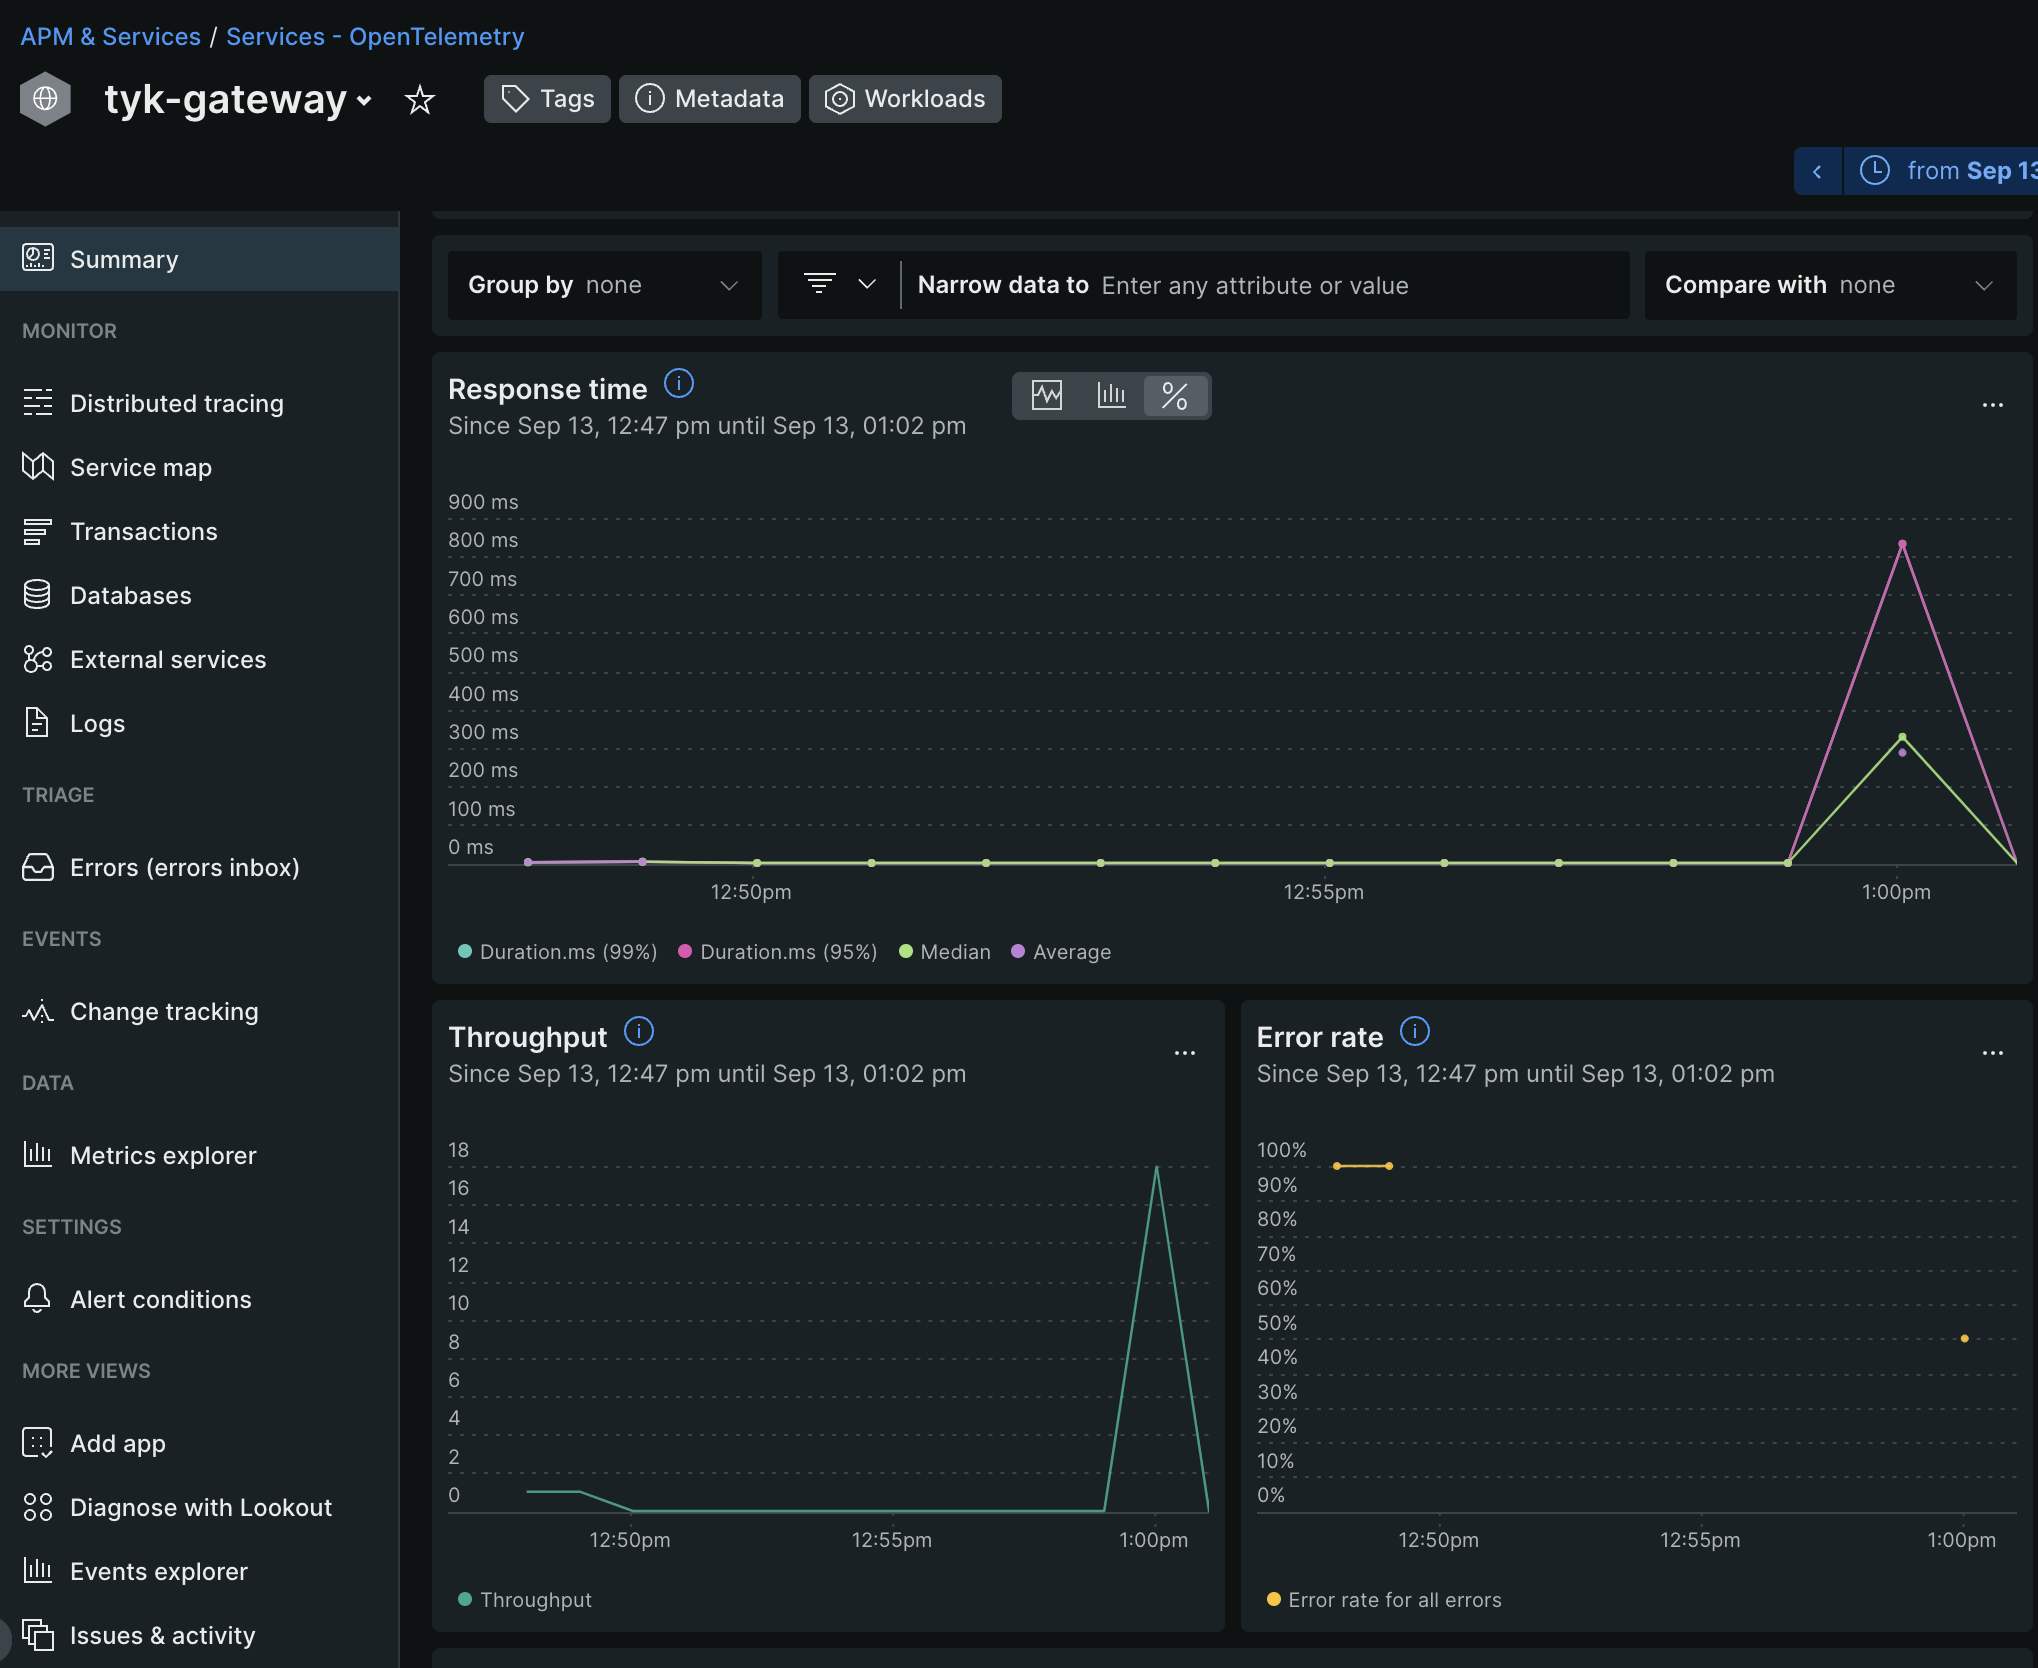
5. Open New Relic Console.
6. Navigate to `APM & Services → Services - OpenTelemetry → tyk-gateway`.
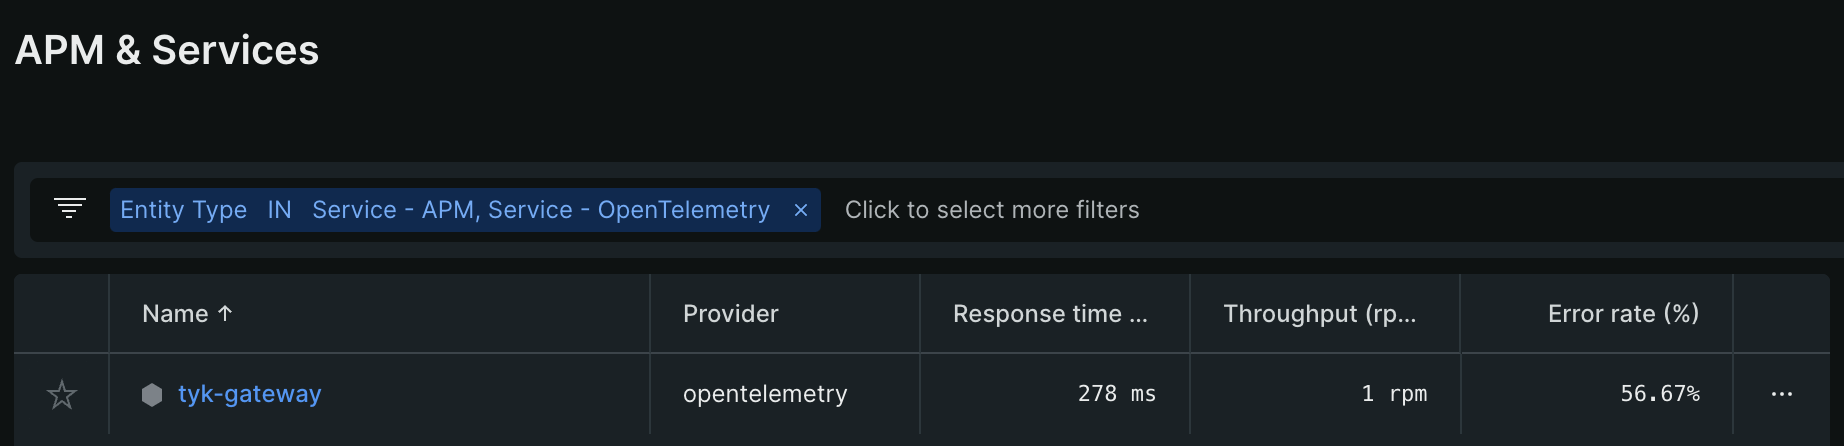 7. Wait for about 5 minutes for the data to populate.
Traces and graphs should now be visible on your New Relic console.
7. Wait for about 5 minutes for the data to populate.
Traces and graphs should now be visible on your New Relic console.
If traces are not showing, try refreshing the New Relic dashboard.
##### Troubleshooting
* If the traces aren't appearing, double-check your API key and endpoints.
* Ensure that your Tyk Gateway and New Relic are both running and connected.
##### Conclusion
You have successfully integrated New Relic with Tyk Gateway via the OpenTelemetry Collector. You can now monitor and trace your APIs directly from the New Relic console.
#### Jaeger
##### Using Docker
This quick start guide offers a detailed, step-by-step walkthrough for configuring Tyk API Gateway (OSS, self-managed or hybrid gateway connected to Tyk Cloud) with OpenTelemetry and [Jaeger](https://www.jaegertracing.io/) to significantly improve API observability. We will cover the installation of essential components, their configuration, and the process of ensuring seamless integration.
For Kubernetes instructions, please refer to [How to integrate with Jaeger on Kubernetes](/5.12/#using-kubernetes).
###### Prerequisites
Ensure the following prerequisites are met before proceeding:
* [Docker installed on your machine](https://docs.docker.com/get-docker/)
* Gateway v5.2.0 or higher
###### Steps for Configuration
1. **Create the Docker-Compose File for Jaeger**
Save the following YAML configuration in a file named docker-compose.yml:
```yaml theme={null}
version: "2"
services:
# Jaeger: Distributed Tracing System
jaeger-all-in-one:
image: jaegertracing/all-in-one:latest
ports:
- "16686:16686" # Jaeger UI
- "4317:4317" # OTLP receiver
```
This configuration sets up Jaeger's all-in-one instance with ports exposed for Jaeger UI and the OTLP receiver.
2. **Deploy a Test API Definition**
If you haven't configured any APIs yet, follow these steps:
* Create a subdirectory named apps in the current directory.
* Create a new file named `apidef-hello-world.json`.
* Copy the provided simple API definition below into the `apidef-hello-world.json` file:
```json theme={null}
{
"name": "Hello-World",
"slug": "hello-world",
"api_id": "Hello-World",
"org_id": "1",
"use_keyless": true,
"detailed_tracing": true,
"version_data": {
"not_versioned": true,
"versions": {
"Default": {
"name": "Default",
"use_extended_paths": true
}
}
},
"proxy": {
"listen_path": "/hello-world/",
"target_url": "http://httpbin.org/",
"strip_listen_path": true
},
"active": true
}
```
This API definition sets up a basic API named Hello-World for testing purposes, configured to proxy requests to `http://httpbin.org/`.
3. **Run Tyk Gateway OSS with OpenTelemetry Enabled**
To run Tyk Gateway with OpenTelemetry integration, extend the previous Docker Compose file to include Tyk Gateway and Redis services. Follow these steps:
* Add the following configuration to your existing docker-compose.yml file:
```yaml theme={null}
# ... Existing docker-compose.yml content for jaeger
tyk:
image: tykio/tyk-gateway:v5.2.0
ports:
- 8080:8080
environment:
- TYK_GW_OPENTELEMETRY_ENABLED=true
- TYK_GW_OPENTELEMETRY_EXPORTER=grpc
- TYK_GW_OPENTELEMETRY_ENDPOINT=jaeger-all-in-one:4317
volumes:
- ${TYK_APPS:-./apps}:/opt/tyk-gateway/apps
depends_on:
- redis
redis:
image: redis:4.0-alpine
ports:
- 6379:6379
command: redis-server --appendonly yes
```
* Navigate to the directory containing the docker-compose.yml file in your terminal.
* Execute the following command to start the services:
```bash theme={null}
docker compose up
```
4. **Explore OpenTelemetry Traces in Jaeger**
* Start by sending a few requests to the API endpoint configured in Step 2:
```bash theme={null}
curl http://localhost:8080/hello-world/ -i
```
* Access Jaeger at [http://localhost:16686](http://localhost:16686).
* In Jaeger's interface:
* Select the service named tyk-gateway.
* Click the *Find Traces* button.
You should observe traces generated by Tyk Gateway, showcasing the distributed tracing information.
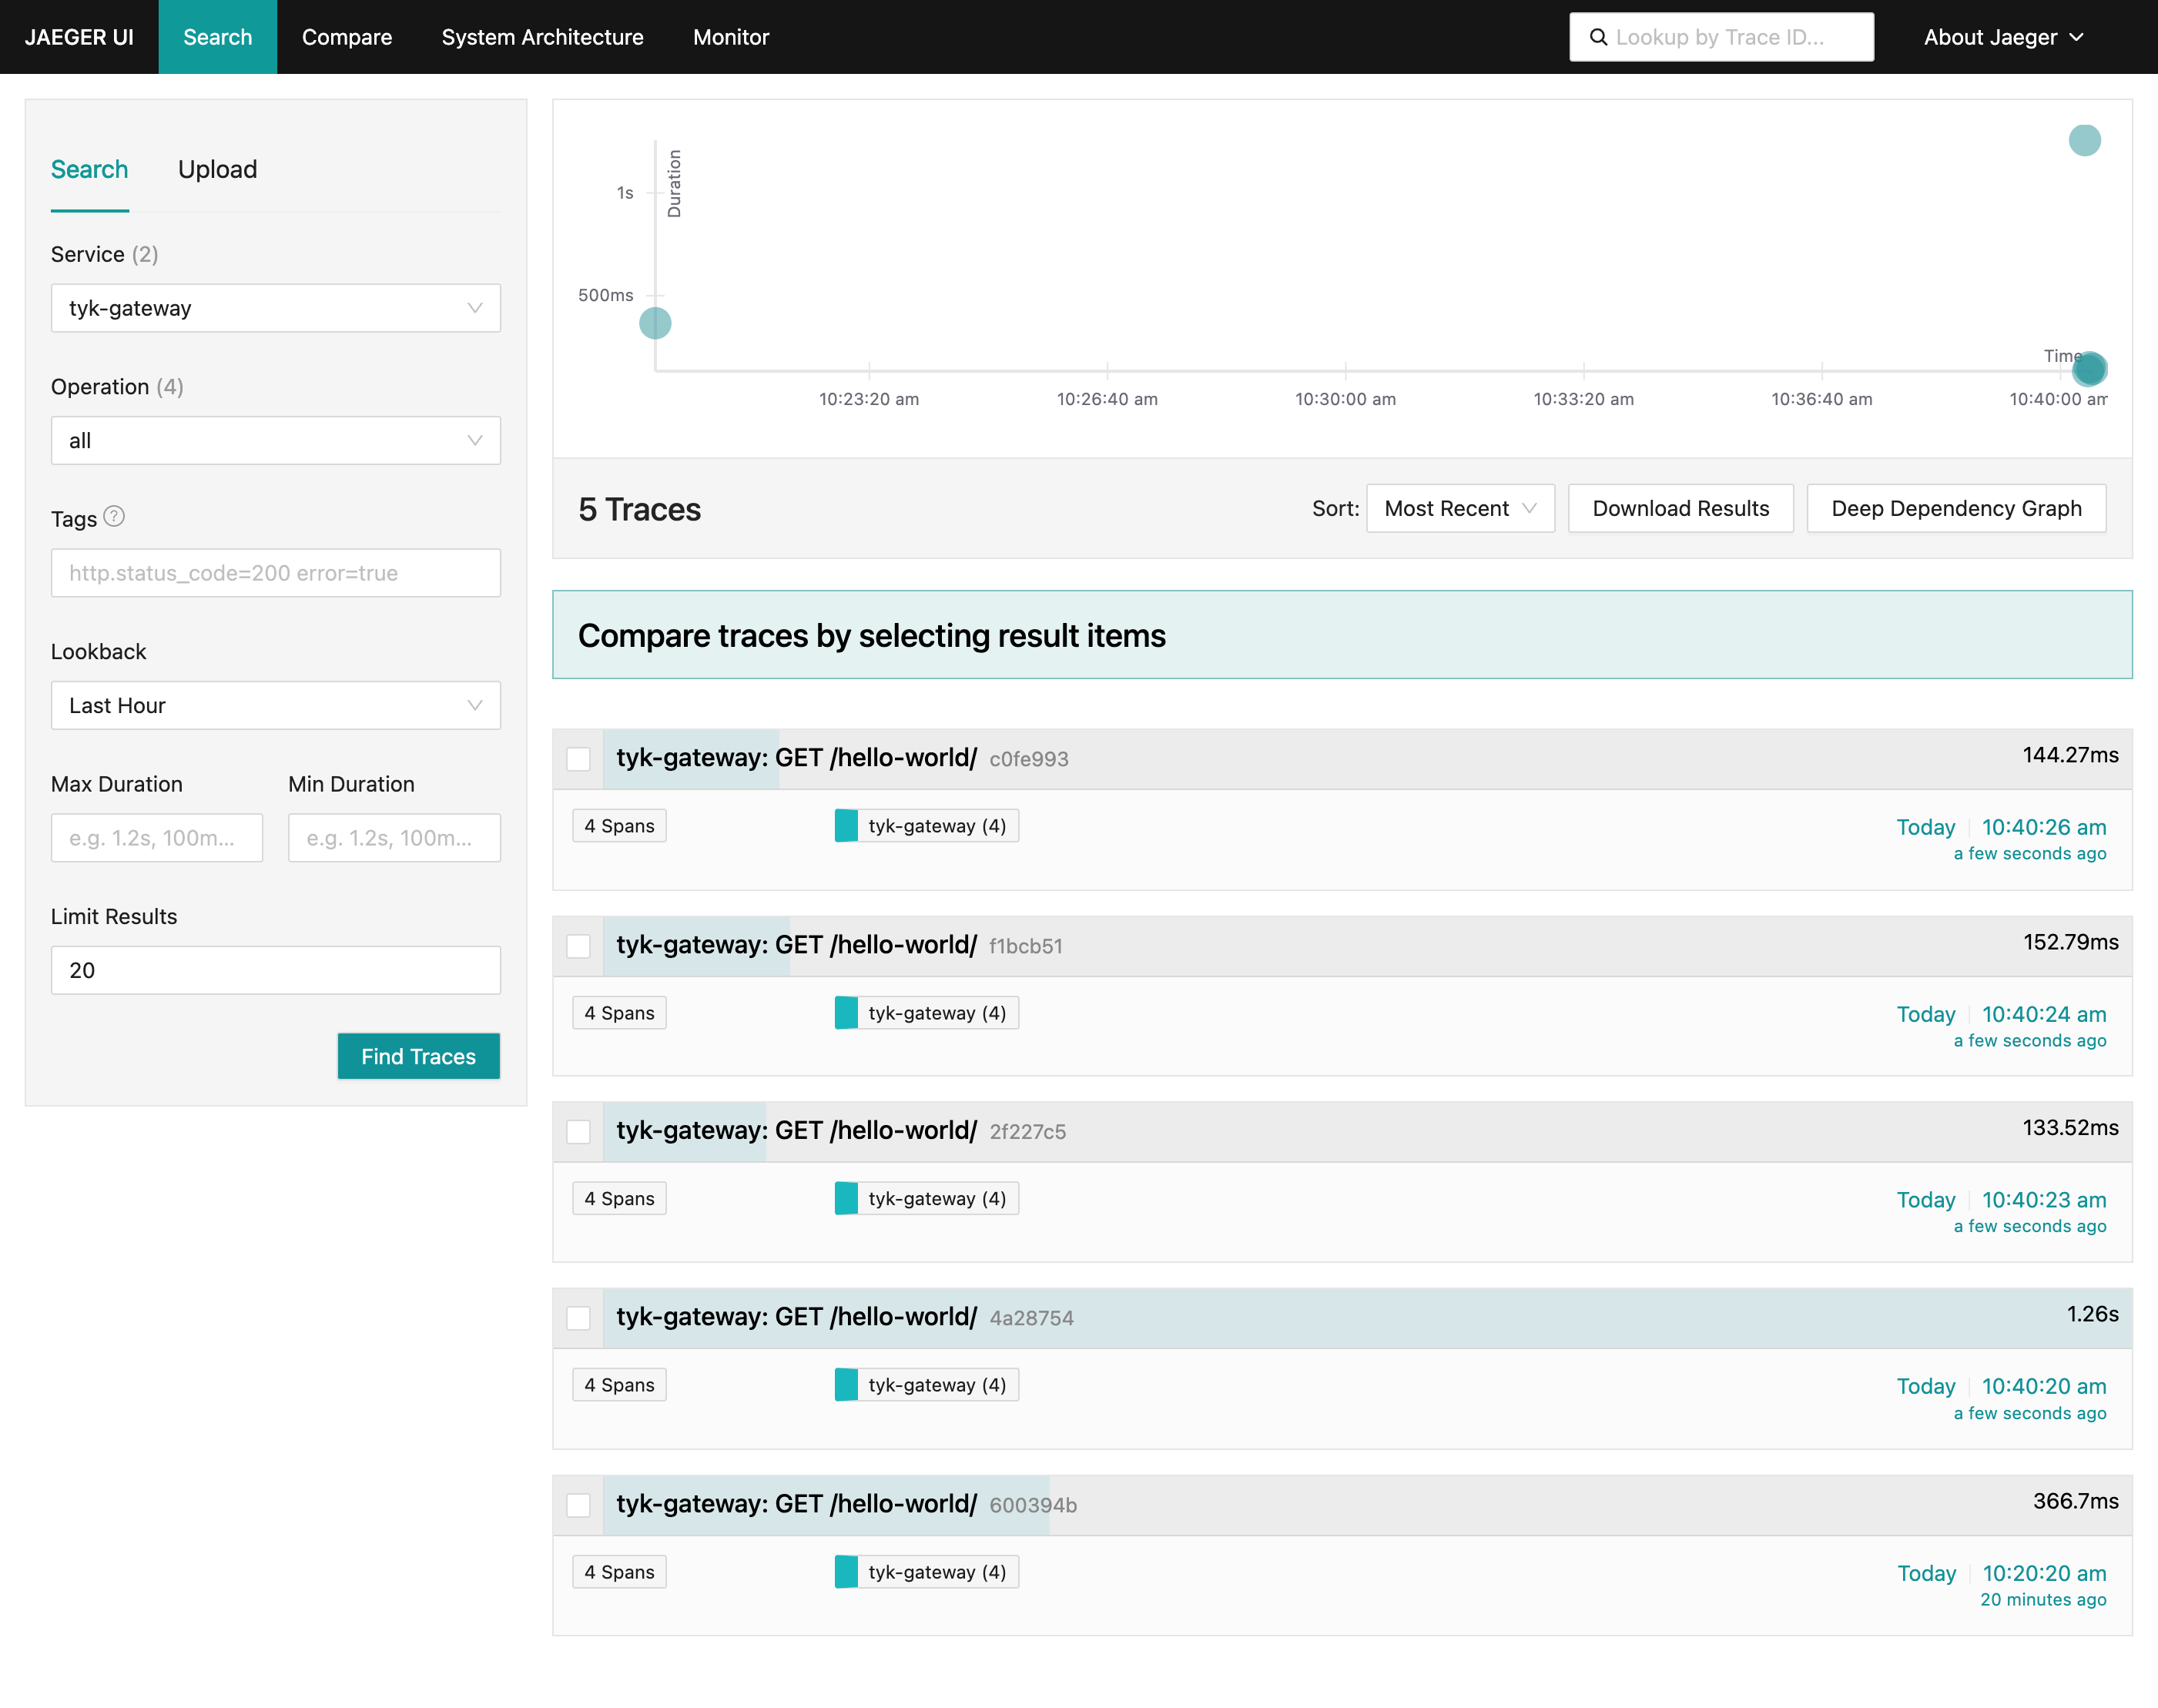 Select a trace to visualize its corresponding internal spans:
 ##### Using Kubernetes
This quick start guide offers a detailed, step-by-step walkthrough for configuring Tyk Gateway OSS with OpenTelemetry and [Jaeger](https://www.jaegertracing.io/) on Kubernetes to significantly improve API observability. We will cover the installation of essential components, their configuration, and the process of ensuring seamless integration.
For Docker instructions, please refer to [How to integrate with Jaeger on Docker](/5.12/#using-docker).
###### Prerequisites
Ensure the following prerequisites are in place before proceeding:
* A functional Kubernetes cluster
* [kubectl](https://kubernetes.io/docs/tasks/tools/#kubectl) and [helm](https://helm.sh/docs/intro/install/) CLI tools installed
###### Steps for Configuration
1. **Install Jaeger Operator**
For the purpose of this tutorial, we will use jaeger-all-in-one, which includes the Jaeger agent, collector, query, and UI in a single pod with in-memory storage. This deployment is intended for development, testing, and demo purposes. Other deployment patterns can be found in the [Jaeger Operator documentation](https://www.jaegertracing.io/docs/1.51/operator/#deployment-strategies).
1. Install the cert-manager release manifest (required by Jaeger)
```bash theme={null}
kubectl apply -f https://github.com/cert-manager/cert-manager/releases/download/v1.13.2/cert-manager.yaml
```
2. Install [Jaeger Operator](https://www.jaegertracing.io/docs/1.51/operator/).
```bash theme={null}
kubectl create namespace observability
kubectl create -f https://github.com/jaegertracing/jaeger-operator/releases/download/v1.51.0/jaeger-operator.yaml -n observability
```
3. After the Jaeger Operator is deployed to the `observability` namespace, create a Jaeger instance:
```bash theme={null}
kubectl apply -n observability -f - <
Please make sure you are installing Redis versions that are supported by Tyk. Please refer to Tyk docs to get list of [supported versions](/5.12/tyk-self-managed/install#redis).
Tyk Gateway is now accessible through service gateway-svc-tyk-oss-tyk-gateway at port 8080 and exports the OpenTelemetry traces to the `jaeger-all-in-one-collector` service.
3. **Deploy Tyk Operator**
Deploy Tyk Operator to manage APIs in your cluster:
```bash theme={null}
kubectl create namespace tyk-operator-system
kubectl create secret -n tyk-operator-system generic tyk-operator-conf \
--from-literal "TYK_AUTH=$APISecret" \
--from-literal "TYK_ORG=org" \
--from-literal "TYK_MODE=ce" \
--from-literal "TYK_URL=http://gateway-svc-tyk-otel-tyk-gateway.tyk.svc:8080" \
--from-literal "TYK_TLS_INSECURE_SKIP_VERIFY=true"
helm install tyk-operator tyk-helm/tyk-operator -n tyk-operator-system
```
4. **Deploy a Test API Definition**
Save the following API definition as `apidef-hello-world.yaml`:
```yaml theme={null}
apiVersion: tyk.tyk.io/v1alpha1
kind: ApiDefinition
metadata:
name: hello-world
spec:
name: hello-world
use_keyless: true
protocol: http
active: true
proxy:
target_url: http://httpbin.org/
listen_path: /hello-world
strip_listen_path: true
```
To apply this API definition, run the following command:
```bash theme={null}
kubectl apply -f apidef-hello-world.yaml
```
This step deploys an API definition named hello-world using the provided configuration. It enables a keyless HTTP API proxying requests to [http://httpbin.org/](http://httpbin.org/) and accessible via the path /hello-world.
5. **Explore OpenTelemetry traces in Jaeger**
You can use the kubectl `port-forward command` to access Tyk and Jaeger services running in the cluster from your local machine's localhost:
For Tyk API Gateway:
```bash theme={null}
kubectl port-forward service/gateway-svc-tyk-otel-tyk-gateway 8080:8080 -n tyk
```
For Jaeger:
```bash theme={null}
kubectl port-forward service/jaeger-all-in-one-query 16686 -n observability
```
Begin by sending a few requests to the API endpoint configured in step 2:
```bash theme={null}
curl http://localhost:8080/hello-world/ -i
```
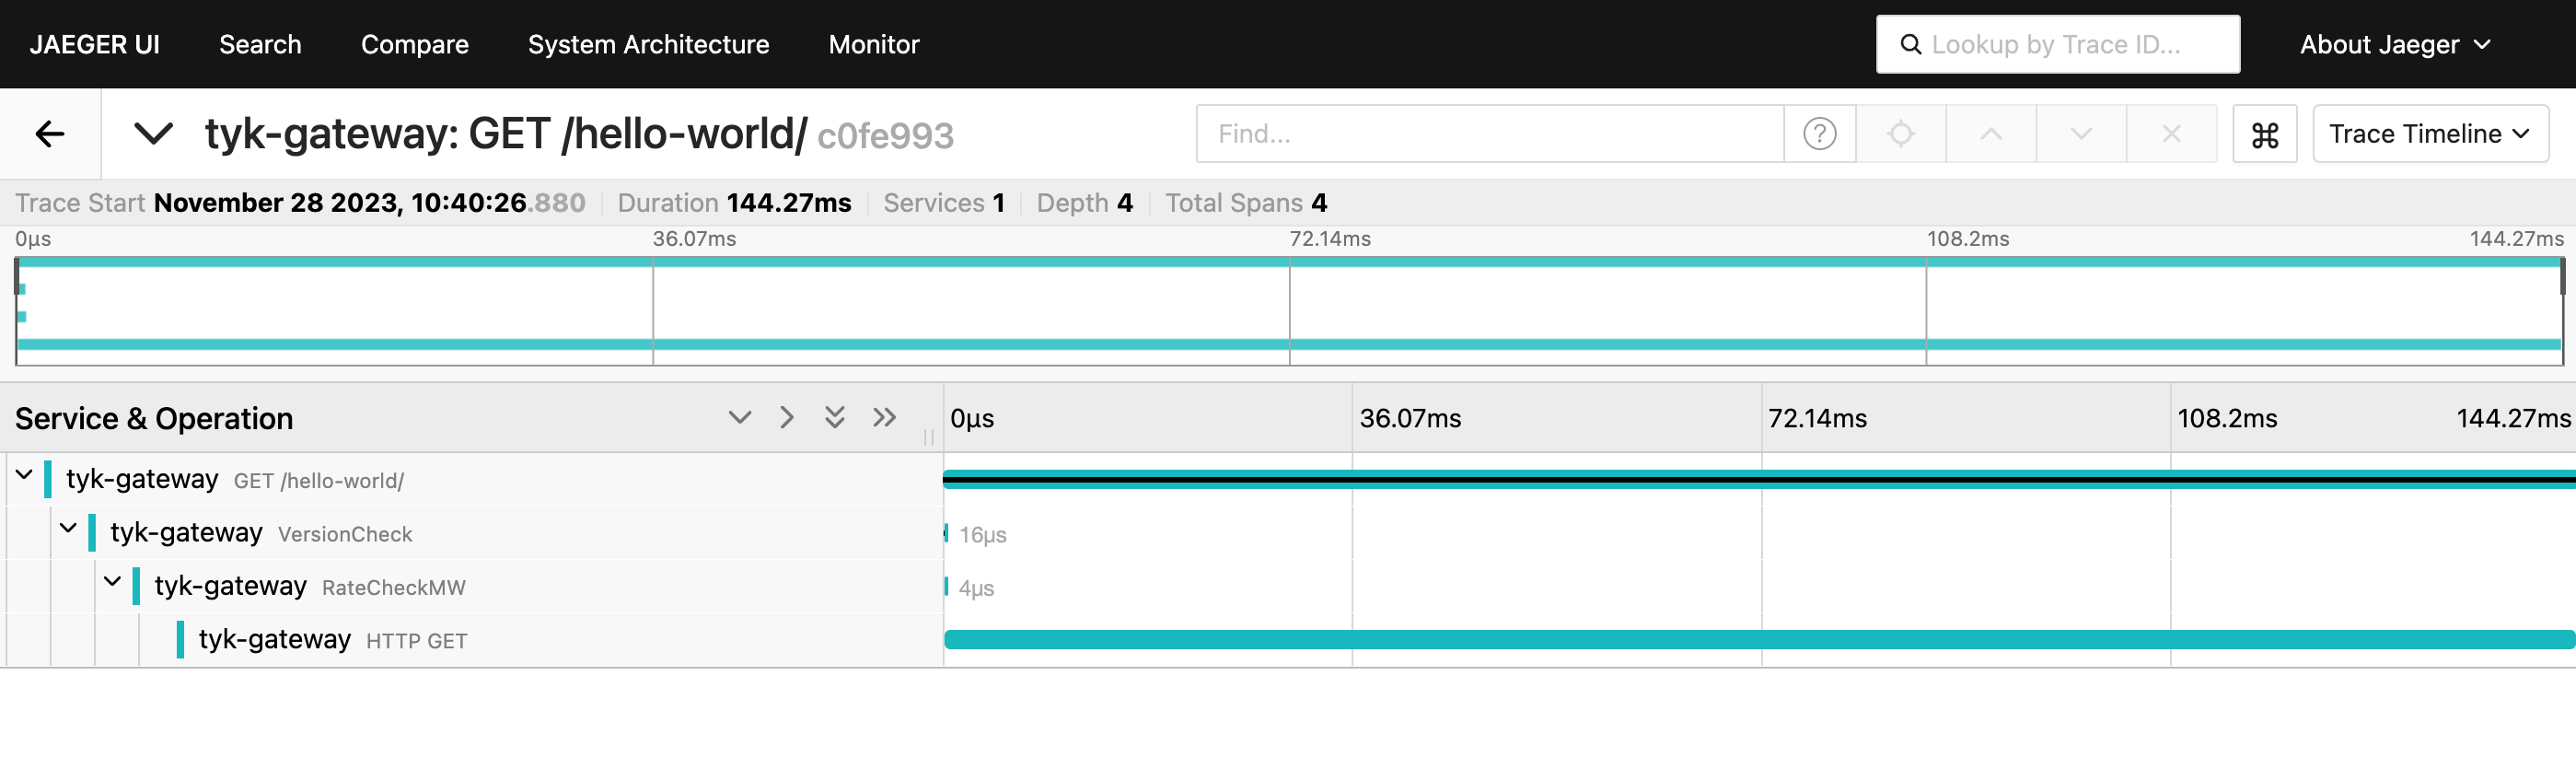
Next, navigate to Jaeger on `http://localhost:16686`, select the ´service´ called ´tyk-gateway´ and click on the button ´Find traces´. You should see traces generated by Tyk:
Click on a trace to view all its internal spans:
## OpenTracing (deprecated)
**Deprecation**
The CNCF (Cloud Native Foundation) has archived the OpenTracing project. This means that no new pull requests or feature requests are accepted into OpenTracing repositories.
We introduced support for [OpenTelemetry](/5.12/api-management/traces#opentelemetry) in Tyk v5.2. We recommend that users migrate to OpenTelemetry for better support of your tracing needs.
OpenTracing is now deprecated in Tyk products.
### OpenTracing tools with legacy Tyk integration
* [Jaeger](/5.12/api-management/traces#jaeger-1)
* [Zipkin](/5.12/api-management/traces#zipkin)
* [New Relic](/5.12/api-management/traces#new-relic-1)
### Enabling OpenTracing
OpenTracing can be configured at the Gateway level by adding the following configuration to your Gateway configuration (typically via the `tyk.conf` file or equivalent [environment variables](/5.12/tyk-oss-gateway/configuration).
```.json theme={null}
{
"tracing": {
"enabled": true,
"name": "${tracer_name}",
"options": {}
}
}
```
Where:
* `name` is the name of the supported tracer
* `enabled`: set this to true to enable tracing
* `options`: key/value pairs for configuring the enabled tracer. See the
supported tracer documentation for more details.
Tyk will automatically propagate tracing headers to APIs when tracing is enabled.
### Jaeger
Tyk's OpenTelemetry Tracing works with Jaeger and we recommend following our guide to [use OpenTelemetry with Jaeger](/5.12/api-management/traces#jaeger) rather than the following deprecated Open Tracing method.
Prior to Tyk 5.2, you cannot use OpenTelemetry and so must use [OpenTracing](https://opentracing.io/) with the [Jaeger client libraries](https://www.jaegertracing.io/docs/) to send Tyk Gateway traces to Jaeger.
**Configuring Jaeger**
In `tyk.conf` on `tracing` setting
```{.json} theme={null}
{
"tracing": {
"enabled": true,
"name": "jaeger",
"options": {}
}
}
```
`options` are settings that are used to initialise the Jaeger client. For more details about the options [see client libraries](https://www.jaegertracing.io/docs/)
**Sample configuration**
```{.json} theme={null}
{
"tracing": {
"enabled": true,
"name": "jaeger",
"options": {
"baggage_restrictions": null,
"disabled": false,
"headers": null,
"reporter": {
"BufferFlushInterval": "0s",
"collectorEndpoint": "",
"localAgentHostPort": "jaeger:6831",
"logSpans": true,
"password": "",
"queueSize": 0,
"user": ""
},
"rpc_metrics": false,
"sampler": {
"maxOperations": 0,
"param": 1,
"samplingRefreshInterval": "0s",
"samplingServerURL": "",
"type": "const"
},
"serviceName": "tyk-gateway",
"tags": null,
"throttler": null
}
}
}
```
### New Relic
Tyk's OpenTelemetry Tracing works with New Relic and we recommend following our guide to [use OpenTelemetry with New Relic](/5.12/api-management/traces#new-relic) rather than the following deprecated Open Tracing method.
Prior to Tyk 5.2, you cannot use OpenTelemetry and so must use [OpenTracing](https://opentracing.io/) to send Tyk Gateway traces to [*New Relic*](https://newrelic.com/) using the *Zipkin* format.
##### Using Kubernetes
This quick start guide offers a detailed, step-by-step walkthrough for configuring Tyk Gateway OSS with OpenTelemetry and [Jaeger](https://www.jaegertracing.io/) on Kubernetes to significantly improve API observability. We will cover the installation of essential components, their configuration, and the process of ensuring seamless integration.
For Docker instructions, please refer to [How to integrate with Jaeger on Docker](/5.12/#using-docker).
###### Prerequisites
Ensure the following prerequisites are in place before proceeding:
* A functional Kubernetes cluster
* [kubectl](https://kubernetes.io/docs/tasks/tools/#kubectl) and [helm](https://helm.sh/docs/intro/install/) CLI tools installed
###### Steps for Configuration
1. **Install Jaeger Operator**
For the purpose of this tutorial, we will use jaeger-all-in-one, which includes the Jaeger agent, collector, query, and UI in a single pod with in-memory storage. This deployment is intended for development, testing, and demo purposes. Other deployment patterns can be found in the [Jaeger Operator documentation](https://www.jaegertracing.io/docs/1.51/operator/#deployment-strategies).
1. Install the cert-manager release manifest (required by Jaeger)
```bash theme={null}
kubectl apply -f https://github.com/cert-manager/cert-manager/releases/download/v1.13.2/cert-manager.yaml
```
2. Install [Jaeger Operator](https://www.jaegertracing.io/docs/1.51/operator/).
```bash theme={null}
kubectl create namespace observability
kubectl create -f https://github.com/jaegertracing/jaeger-operator/releases/download/v1.51.0/jaeger-operator.yaml -n observability
```
3. After the Jaeger Operator is deployed to the `observability` namespace, create a Jaeger instance:
```bash theme={null}
kubectl apply -n observability -f - <
Please make sure you are installing Redis versions that are supported by Tyk. Please refer to Tyk docs to get list of [supported versions](/5.12/tyk-self-managed/install#redis).
Tyk Gateway is now accessible through service gateway-svc-tyk-oss-tyk-gateway at port 8080 and exports the OpenTelemetry traces to the `jaeger-all-in-one-collector` service.
3. **Deploy Tyk Operator**
Deploy Tyk Operator to manage APIs in your cluster:
```bash theme={null}
kubectl create namespace tyk-operator-system
kubectl create secret -n tyk-operator-system generic tyk-operator-conf \
--from-literal "TYK_AUTH=$APISecret" \
--from-literal "TYK_ORG=org" \
--from-literal "TYK_MODE=ce" \
--from-literal "TYK_URL=http://gateway-svc-tyk-otel-tyk-gateway.tyk.svc:8080" \
--from-literal "TYK_TLS_INSECURE_SKIP_VERIFY=true"
helm install tyk-operator tyk-helm/tyk-operator -n tyk-operator-system
```
4. **Deploy a Test API Definition**
Save the following API definition as `apidef-hello-world.yaml`:
```yaml theme={null}
apiVersion: tyk.tyk.io/v1alpha1
kind: ApiDefinition
metadata:
name: hello-world
spec:
name: hello-world
use_keyless: true
protocol: http
active: true
proxy:
target_url: http://httpbin.org/
listen_path: /hello-world
strip_listen_path: true
```
To apply this API definition, run the following command:
```bash theme={null}
kubectl apply -f apidef-hello-world.yaml
```
This step deploys an API definition named hello-world using the provided configuration. It enables a keyless HTTP API proxying requests to [http://httpbin.org/](http://httpbin.org/) and accessible via the path /hello-world.
5. **Explore OpenTelemetry traces in Jaeger**
You can use the kubectl `port-forward command` to access Tyk and Jaeger services running in the cluster from your local machine's localhost:
For Tyk API Gateway:
```bash theme={null}
kubectl port-forward service/gateway-svc-tyk-otel-tyk-gateway 8080:8080 -n tyk
```
For Jaeger:
```bash theme={null}
kubectl port-forward service/jaeger-all-in-one-query 16686 -n observability
```
Begin by sending a few requests to the API endpoint configured in step 2:
```bash theme={null}
curl http://localhost:8080/hello-world/ -i
```
Next, navigate to Jaeger on `http://localhost:16686`, select the ´service´ called ´tyk-gateway´ and click on the button ´Find traces´. You should see traces generated by Tyk:
Click on a trace to view all its internal spans:
## OpenTracing (deprecated)
**Deprecation**
The CNCF (Cloud Native Foundation) has archived the OpenTracing project. This means that no new pull requests or feature requests are accepted into OpenTracing repositories.
We introduced support for [OpenTelemetry](/5.12/api-management/traces#opentelemetry) in Tyk v5.2. We recommend that users migrate to OpenTelemetry for better support of your tracing needs.
OpenTracing is now deprecated in Tyk products.
### OpenTracing tools with legacy Tyk integration
* [Jaeger](/5.12/api-management/traces#jaeger-1)
* [Zipkin](/5.12/api-management/traces#zipkin)
* [New Relic](/5.12/api-management/traces#new-relic-1)
### Enabling OpenTracing
OpenTracing can be configured at the Gateway level by adding the following configuration to your Gateway configuration (typically via the `tyk.conf` file or equivalent [environment variables](/5.12/tyk-oss-gateway/configuration).
```.json theme={null}
{
"tracing": {
"enabled": true,
"name": "${tracer_name}",
"options": {}
}
}
```
Where:
* `name` is the name of the supported tracer
* `enabled`: set this to true to enable tracing
* `options`: key/value pairs for configuring the enabled tracer. See the
supported tracer documentation for more details.
Tyk will automatically propagate tracing headers to APIs when tracing is enabled.
### Jaeger
Tyk's OpenTelemetry Tracing works with Jaeger and we recommend following our guide to [use OpenTelemetry with Jaeger](/5.12/api-management/traces#jaeger) rather than the following deprecated Open Tracing method.
Prior to Tyk 5.2, you cannot use OpenTelemetry and so must use [OpenTracing](https://opentracing.io/) with the [Jaeger client libraries](https://www.jaegertracing.io/docs/) to send Tyk Gateway traces to Jaeger.
**Configuring Jaeger**
In `tyk.conf` on `tracing` setting
```{.json} theme={null}
{
"tracing": {
"enabled": true,
"name": "jaeger",
"options": {}
}
}
```
`options` are settings that are used to initialise the Jaeger client. For more details about the options [see client libraries](https://www.jaegertracing.io/docs/)
**Sample configuration**
```{.json} theme={null}
{
"tracing": {
"enabled": true,
"name": "jaeger",
"options": {
"baggage_restrictions": null,
"disabled": false,
"headers": null,
"reporter": {
"BufferFlushInterval": "0s",
"collectorEndpoint": "",
"localAgentHostPort": "jaeger:6831",
"logSpans": true,
"password": "",
"queueSize": 0,
"user": ""
},
"rpc_metrics": false,
"sampler": {
"maxOperations": 0,
"param": 1,
"samplingRefreshInterval": "0s",
"samplingServerURL": "",
"type": "const"
},
"serviceName": "tyk-gateway",
"tags": null,
"throttler": null
}
}
}
```
### New Relic
Tyk's OpenTelemetry Tracing works with New Relic and we recommend following our guide to [use OpenTelemetry with New Relic](/5.12/api-management/traces#new-relic) rather than the following deprecated Open Tracing method.
Prior to Tyk 5.2, you cannot use OpenTelemetry and so must use [OpenTracing](https://opentracing.io/) to send Tyk Gateway traces to [*New Relic*](https://newrelic.com/) using the *Zipkin* format.
**Configuring New Relic**
In `tyk.conf` under the `tracing` section
```.json theme={null}
{
"tracing": {
"enabled": true,
"name": "zipkin",
"options": {}
}
}
```
In the `options` setting you can set the initialisation of the *Zipkin* client.
**Sample configuration**
```.json theme={null}
{
"tracing": {
"enabled": true,
"name": "zipkin",
"options": {
"reporter": {
"url": "https://trace-api.newrelic.com/trace/v1?Api-Key=NEW_RELIC_LICENSE_KEY&Data-Format=zipkin&Data-Format-Version=2"
}
}
}
}
```
`reporter.url` is the URL to the *New Relic* server, where trace data will be sent to.
### Zipkin
Prior to Tyk 5.2, you cannot use OpenTelemetry and so must use [OpenTracing](https://opentracing.io/) with the [Zipkin Go tracer](https://zipkin.io/pages/tracers_instrumentation) to send Tyk Gateway traces to Zipkin.
**Configuring Zipkin**
In `tyk.conf` on `tracing` setting
```{.json} theme={null}
{
"tracing": {
"enabled": true,
"name": "zipkin",
"options": {}
}
}
```
`options` are settings that are used to initialise the Zipkin client.
**Sample configuration**
```{.json} theme={null}
{
"tracing": {
"enabled": true,
"name": "zipkin",
"options": {
"reporter": {
"url": "http:localhost:9411/api/v2/spans"
}
}
}
}
```
`reporter.url` is the URL to the Zipkin server, where trace data will be sent.